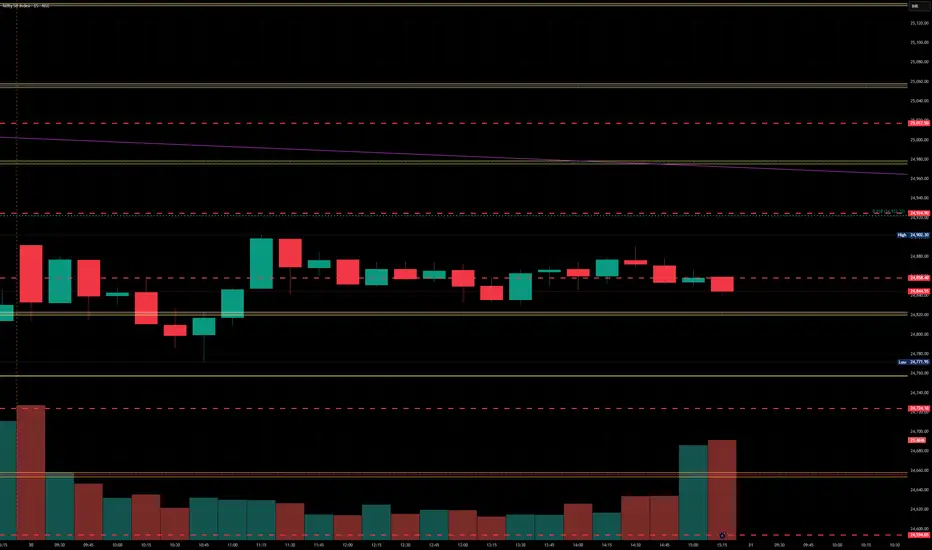
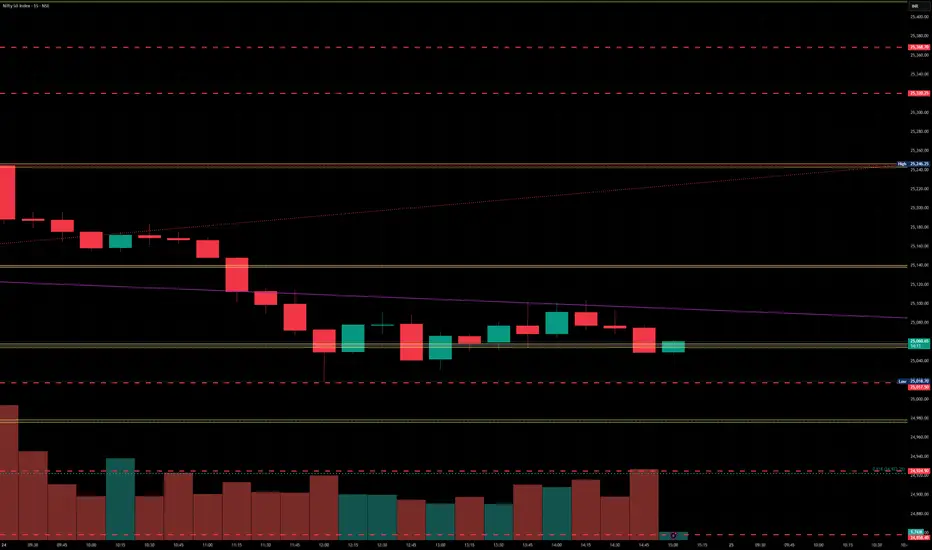
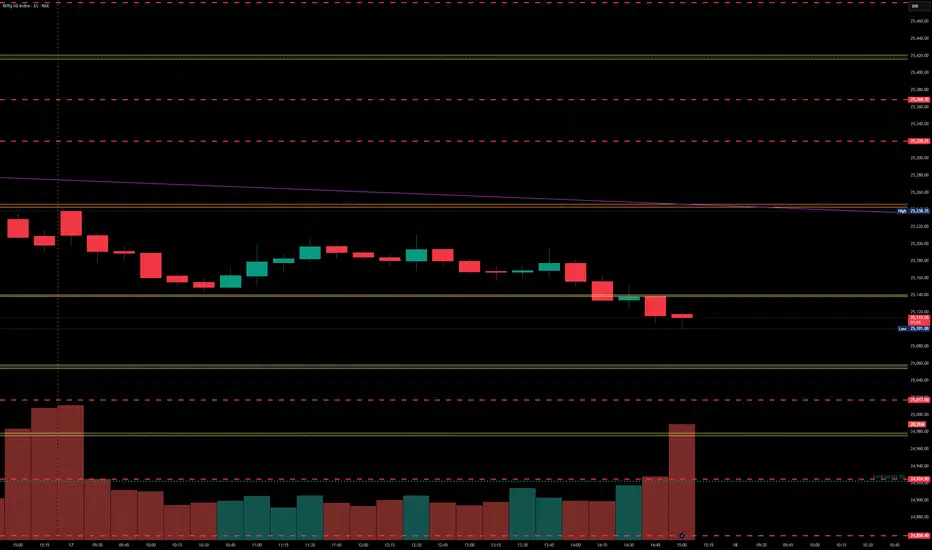
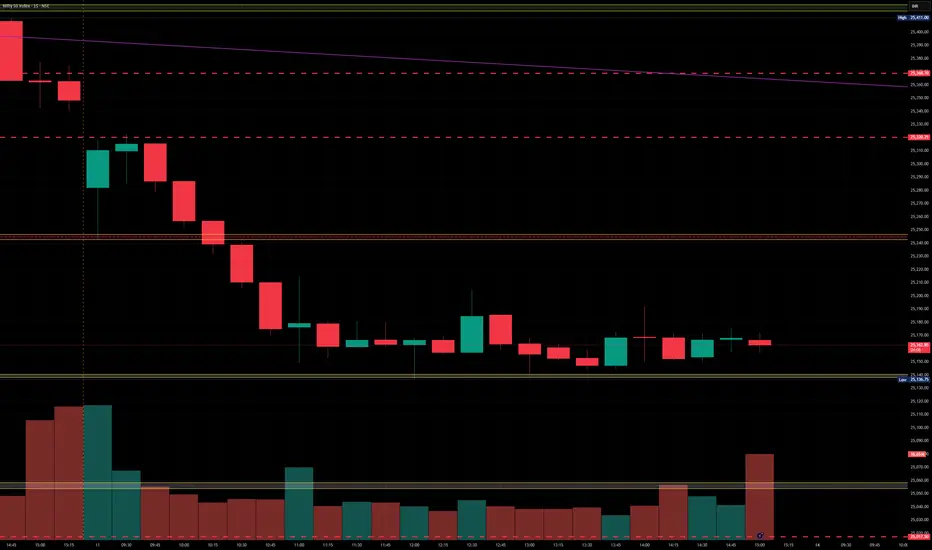
Nifty levels - Aug 01, 2025Nifty support and resistance levels are valuable tools for making informed trading decisions, specifically when combined with the analysis of 5-minute timeframe candlesticks and VWAP. By closely monitoring these levels and observing the price movements within this timeframe, traders can enhance the accuracy of their entry and exit points. It is important to bear in mind that support and resistance levels are not fixed, and they can change over time as market conditions evolve.
The dashed lines on the chart indicate the reaction levels, serving as additional points of significance to consider. Furthermore, take note of the response at the levels of the High, Low, and Close values from the day prior.
We hope you find this information beneficial in your trading endeavors.
* If you found the idea appealing, kindly tap the Boost icon located below the chart. We encourage you to share your thoughts and comments regarding it.
Wishing you success in your trading activities!
Niftyview

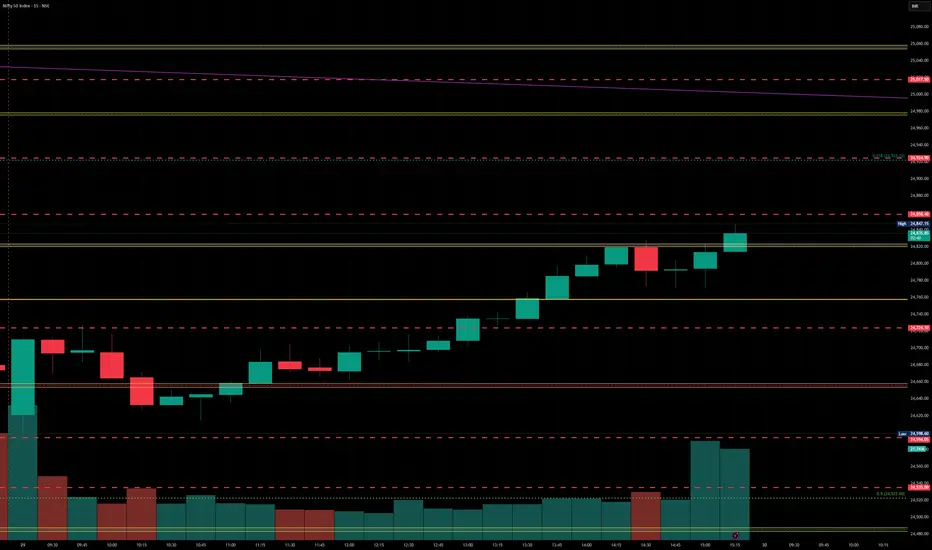
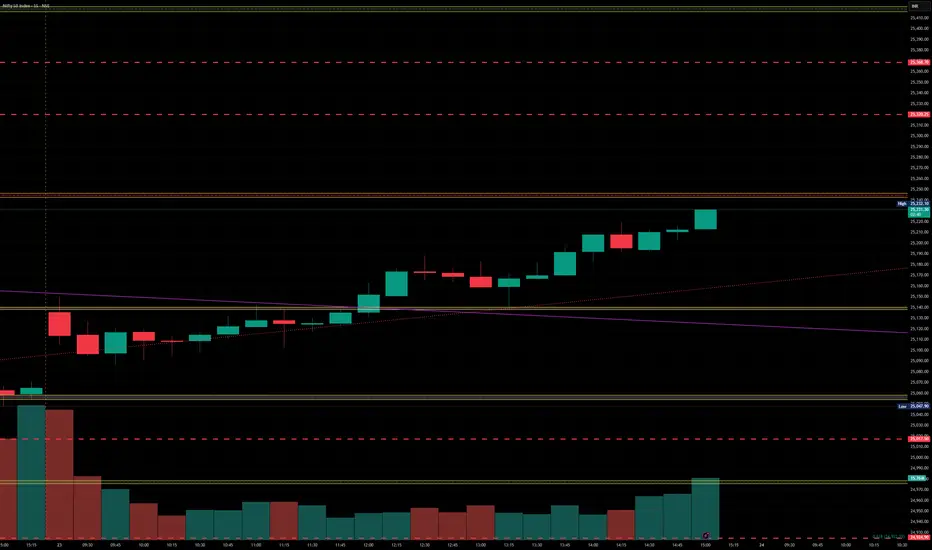
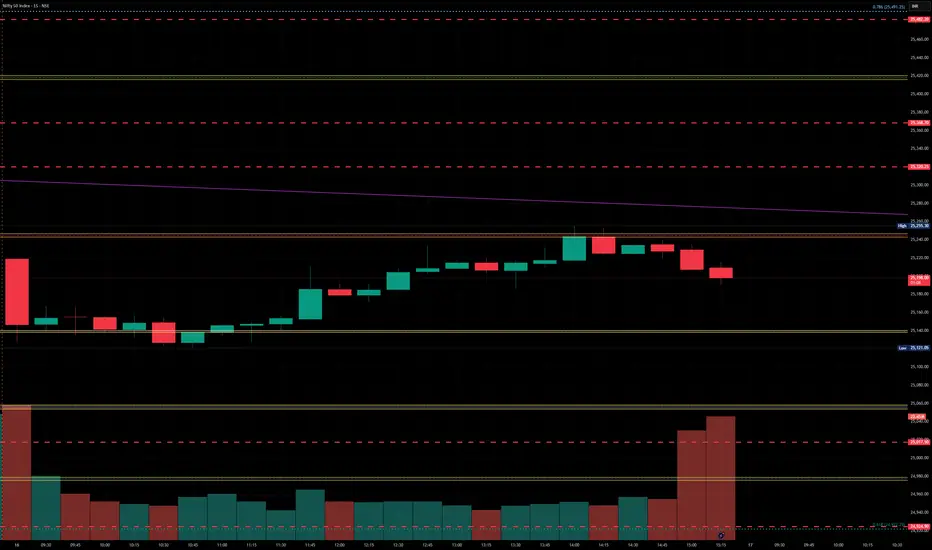
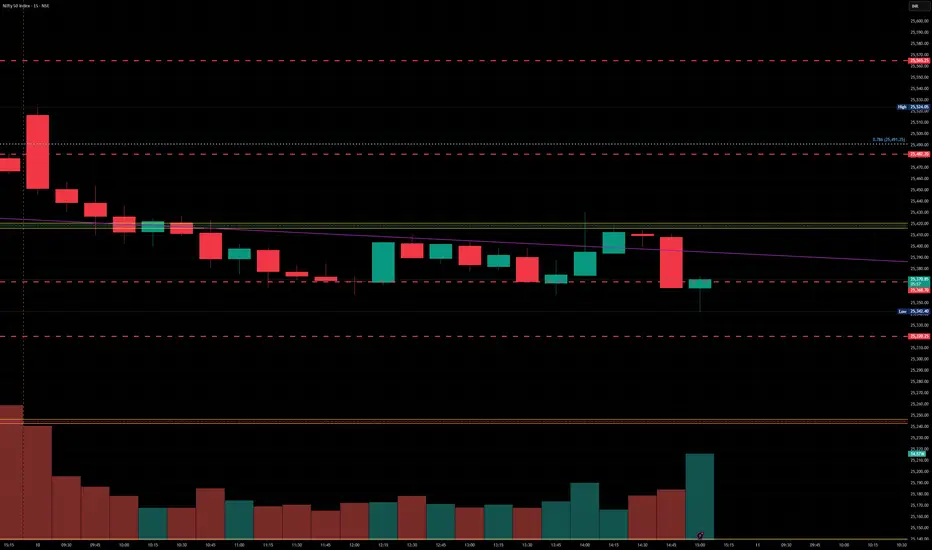
Nifty levels - Jul 31, 2025Nifty support and resistance levels are valuable tools for making informed trading decisions, specifically when combined with the analysis of 5-minute timeframe candlesticks and VWAP. By closely monitoring these levels and observing the price movements within this timeframe, traders can enhance the accuracy of their entry and exit points. It is important to bear in mind that support and resistance levels are not fixed, and they can change over time as market conditions evolve.
The dashed lines on the chart indicate the reaction levels, serving as additional points of significance to consider. Furthermore, take note of the response at the levels of the High, Low, and Close values from the day prior.
We hope you find this information beneficial in your trading endeavors.
* If you found the idea appealing, kindly tap the Boost icon located below the chart. We encourage you to share your thoughts and comments regarding it.
Wishing you success in your trading activities!
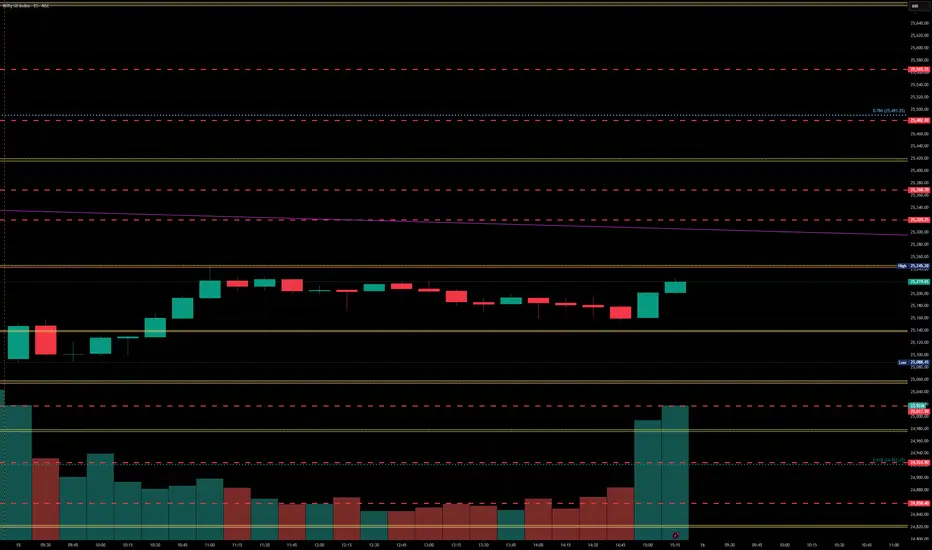
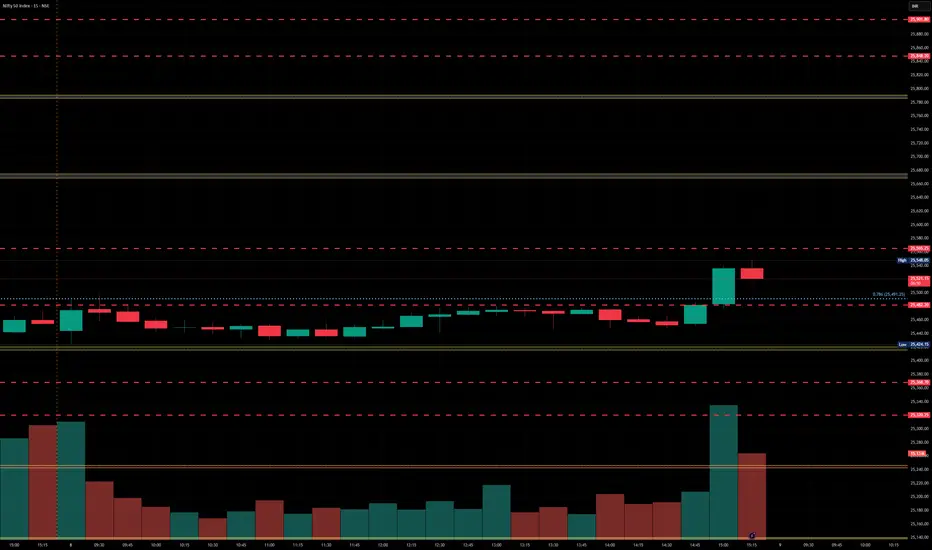
Nifty levels - Jul 04, 2025Nifty support and resistance levels are valuable tools for making informed trading decisions, specifically when combined with the analysis of 5-minute timeframe candlesticks and VWAP. By closely monitoring these levels and observing the price movements within this timeframe, traders can enhance the accuracy of their entry and exit points. It is important to bear in mind that support and resistance levels are not fixed, and they can change over time as market conditions evolve.
The dashed lines on the chart indicate the reaction levels, serving as additional points of significance to consider. Furthermore, take note of the response at the levels of the High, Low, and Close values from the day prior.
We hope you find this information beneficial in your trading endeavors.
* If you found the idea appealing, kindly tap the Boost icon located below the chart. We encourage you to share your thoughts and comments regarding it.
Wishing you success in your trading activities!

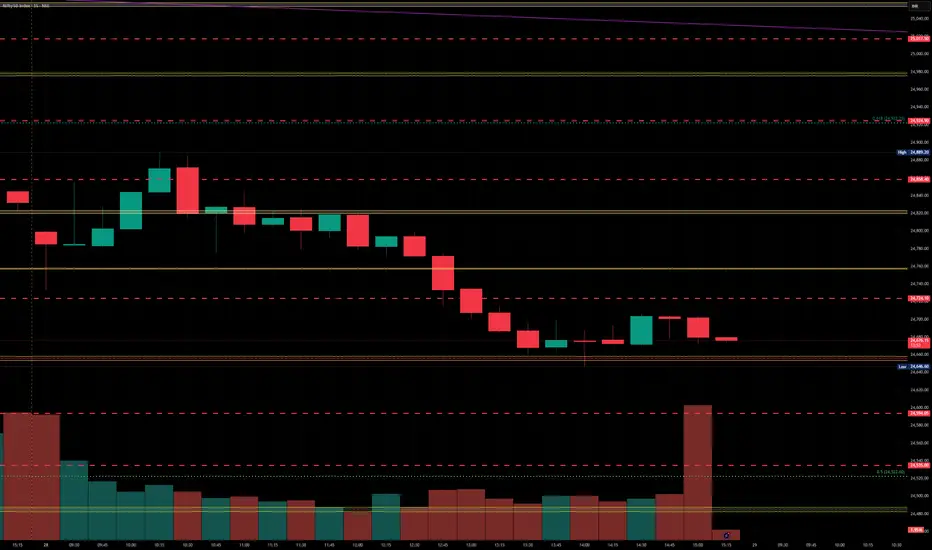
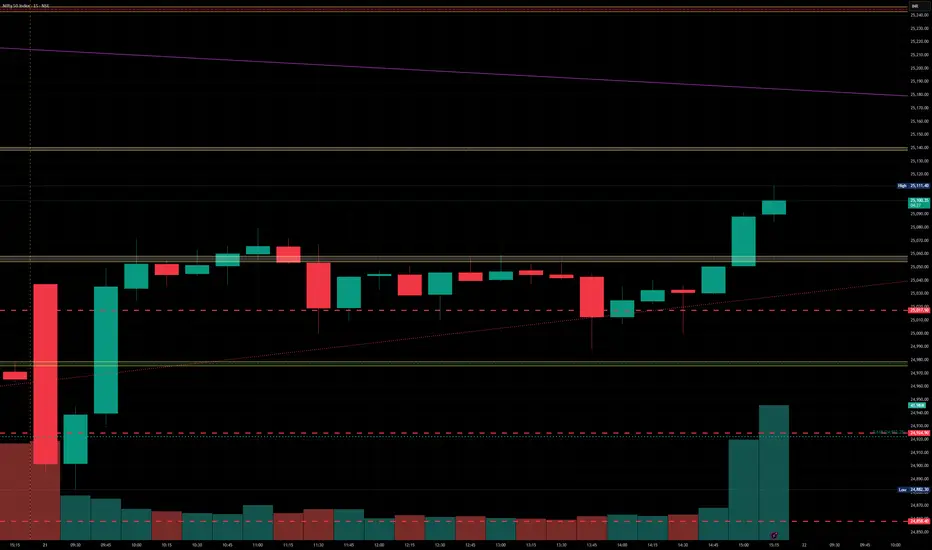
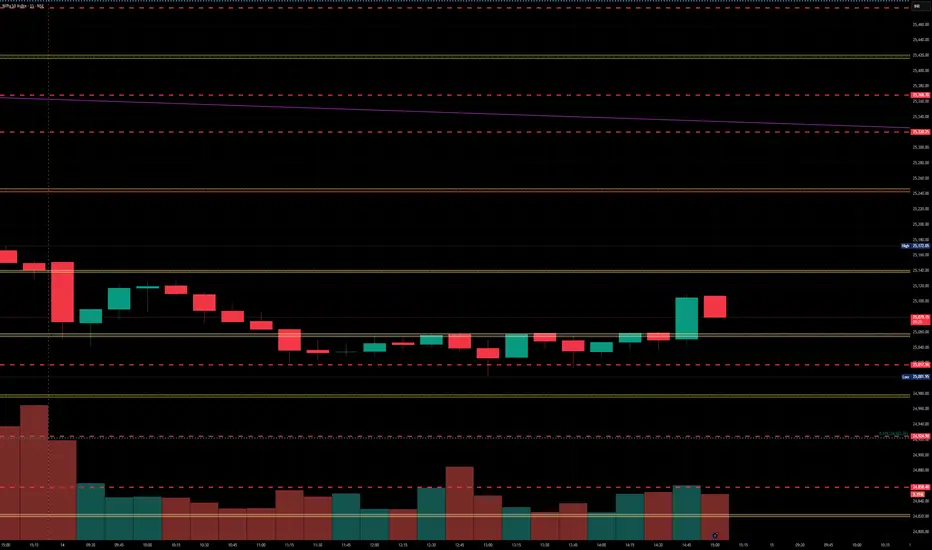
Nifty levels - Jul 30, 2025Nifty support and resistance levels are valuable tools for making informed trading decisions, specifically when combined with the analysis of 5-minute timeframe candlesticks and VWAP. By closely monitoring these levels and observing the price movements within this timeframe, traders can enhance the accuracy of their entry and exit points. It is important to bear in mind that support and resistance levels are not fixed, and they can change over time as market conditions evolve.
The dashed lines on the chart indicate the reaction levels, serving as additional points of significance to consider. Furthermore, take note of the response at the levels of the High, Low, and Close values from the day prior.
We hope you find this information beneficial in your trading endeavors.
* If you found the idea appealing, kindly tap the Boost icon located below the chart. We encourage you to share your thoughts and comments regarding it.
Wishing you success in your trading activities!
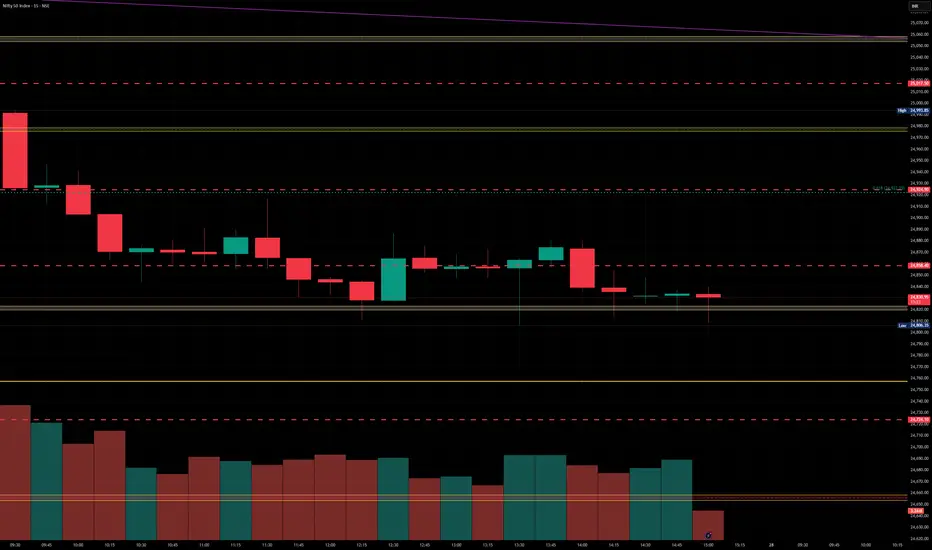
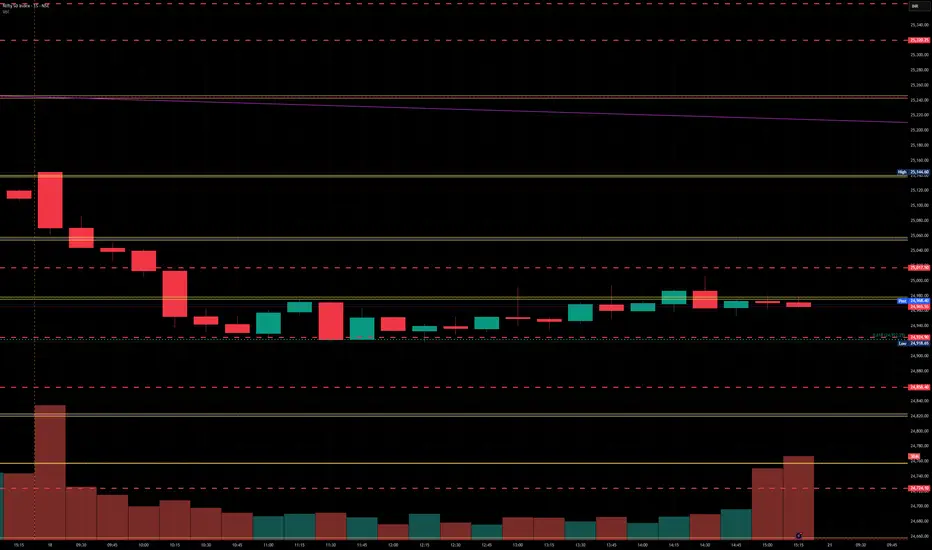
Nifty levels - Jul 29, 2025Nifty support and resistance levels are valuable tools for making informed trading decisions, specifically when combined with the analysis of 5-minute timeframe candlesticks and VWAP. By closely monitoring these levels and observing the price movements within this timeframe, traders can enhance the accuracy of their entry and exit points. It is important to bear in mind that support and resistance levels are not fixed, and they can change over time as market conditions evolve.
The dashed lines on the chart indicate the reaction levels, serving as additional points of significance to consider. Furthermore, take note of the response at the levels of the High, Low, and Close values from the day prior.
We hope you find this information beneficial in your trading endeavors.
* If you found the idea appealing, kindly tap the Boost icon located below the chart. We encourage you to share your thoughts and comments regarding it.
Wishing you success in your trading activities!
Nifty levels - Jul 28, 2025Nifty support and resistance levels are valuable tools for making informed trading decisions, specifically when combined with the analysis of 5-minute timeframe candlesticks and VWAP. By closely monitoring these levels and observing the price movements within this timeframe, traders can enhance the accuracy of their entry and exit points. It is important to bear in mind that support and resistance levels are not fixed, and they can change over time as market conditions evolve.
The dashed lines on the chart indicate the reaction levels, serving as additional points of significance to consider. Furthermore, take note of the response at the levels of the High, Low, and Close values from the day prior.
We hope you find this information beneficial in your trading endeavors.
* If you found the idea appealing, kindly tap the Boost icon located below the chart. We encourage you to share your thoughts and comments regarding it.
Wishing you success in your trading activities!
Nifty levels - July 25, 2025Nifty support and resistance levels are valuable tools for making informed trading decisions, specifically when combined with the analysis of 5-minute timeframe candlesticks and VWAP. By closely monitoring these levels and observing the price movements within this timeframe, traders can enhance the accuracy of their entry and exit points. It is important to bear in mind that support and resistance levels are not fixed, and they can change over time as market conditions evolve.
The dashed lines on the chart indicate the reaction levels, serving as additional points of significance to consider. Furthermore, take note of the response at the levels of the High, Low, and Close values from the day prior.
We hope you find this information beneficial in your trading endeavors.
* If you found the idea appealing, kindly tap the Boost icon located below the chart. We encourage you to share your thoughts and comments regarding it.
Wishing you success in your trading activities!
Nifty levels - Jul 24, 2025Nifty support and resistance levels are valuable tools for making informed trading decisions, specifically when combined with the analysis of 5-minute timeframe candlesticks and VWAP. By closely monitoring these levels and observing the price movements within this timeframe, traders can enhance the accuracy of their entry and exit points. It is important to bear in mind that support and resistance levels are not fixed, and they can change over time as market conditions evolve.
The dashed lines on the chart indicate the reaction levels, serving as additional points of significance to consider. Furthermore, take note of the response at the levels of the High, Low, and Close values from the day prior.
We hope you find this information beneficial in your trading endeavors.
* If you found the idea appealing, kindly tap the Boost icon located below the chart. We encourage you to share your thoughts and comments regarding it.
Wishing you success in your trading activities!
Nifty levels - Jul 23, 2025Nifty support and resistance levels are valuable tools for making informed trading decisions, specifically when combined with the analysis of 5-minute timeframe candlesticks and VWAP. By closely monitoring these levels and observing the price movements within this timeframe, traders can enhance the accuracy of their entry and exit points. It is important to bear in mind that support and resistance levels are not fixed, and they can change over time as market conditions evolve.
The dashed lines on the chart indicate the reaction levels, serving as additional points of significance to consider. Furthermore, take note of the response at the levels of the High, Low, and Close values from the day prior.
We hope you find this information beneficial in your trading endeavors.
* If you found the idea appealing, kindly tap the Boost icon located below the chart. We encourage you to share your thoughts and comments regarding it.
Wishing you success in your trading activities!

Nifty levels - Jul 22, 2025Nifty support and resistance levels are valuable tools for making informed trading decisions, specifically when combined with the analysis of 5-minute timeframe candlesticks and VWAP. By closely monitoring these levels and observing the price movements within this timeframe, traders can enhance the accuracy of their entry and exit points. It is important to bear in mind that support and resistance levels are not fixed, and they can change over time as market conditions evolve.
The dashed lines on the chart indicate the reaction levels, serving as additional points of significance to consider. Furthermore, take note of the response at the levels of the High, Low, and Close values from the day prior.
We hope you find this information beneficial in your trading endeavors.
* If you found the idea appealing, kindly tap the Boost icon located below the chart. We encourage you to share your thoughts and comments regarding it.
Wishing you success in your trading activities!
Nifty levels - Jul 21, 2025Nifty support and resistance levels are valuable tools for making informed trading decisions, specifically when combined with the analysis of 5-minute timeframe candlesticks and VWAP. By closely monitoring these levels and observing the price movements within this timeframe, traders can enhance the accuracy of their entry and exit points. It is important to bear in mind that support and resistance levels are not fixed, and they can change over time as market conditions evolve.
The dashed lines on the chart indicate the reaction levels, serving as additional points of significance to consider. Furthermore, take note of the response at the levels of the High, Low, and Close values from the day prior.
We hope you find this information beneficial in your trading endeavors.
* If you found the idea appealing, kindly tap the Boost icon located below the chart. We encourage you to share your thoughts and comments regarding it.
Wishing you success in your trading activities!
Nifty levels - Jul 18, 2025Nifty support and resistance levels are valuable tools for making informed trading decisions, specifically when combined with the analysis of 5-minute timeframe candlesticks and VWAP. By closely monitoring these levels and observing the price movements within this timeframe, traders can enhance the accuracy of their entry and exit points. It is important to bear in mind that support and resistance levels are not fixed, and they can change over time as market conditions evolve.
The dashed lines on the chart indicate the reaction levels, serving as additional points of significance to consider. Furthermore, take note of the response at the levels of the High, Low, and Close values from the day prior.
We hope you find this information beneficial in your trading endeavors.
* If you found the idea appealing, kindly tap the Boost icon located below the chart. We encourage you to share your thoughts and comments regarding it.
Wishing you success in your trading activities!
Nifty levels - Jul 17, 2025Nifty support and resistance levels are valuable tools for making informed trading decisions, specifically when combined with the analysis of 5-minute timeframe candlesticks and VWAP. By closely monitoring these levels and observing the price movements within this timeframe, traders can enhance the accuracy of their entry and exit points. It is important to bear in mind that support and resistance levels are not fixed, and they can change over time as market conditions evolve.
The dashed lines on the chart indicate the reaction levels, serving as additional points of significance to consider. Furthermore, take note of the response at the levels of the High, Low, and Close values from the day prior.
We hope you find this information beneficial in your trading endeavors.
* If you found the idea appealing, kindly tap the Boost icon located below the chart. We encourage you to share your thoughts and comments regarding it.
Wishing you success in your trading activities!
Nifty levels - Jul 16, 2025Nifty support and resistance levels are valuable tools for making informed trading decisions, specifically when combined with the analysis of 5-minute timeframe candlesticks and VWAP. By closely monitoring these levels and observing the price movements within this timeframe, traders can enhance the accuracy of their entry and exit points. It is important to bear in mind that support and resistance levels are not fixed, and they can change over time as market conditions evolve.
The dashed lines on the chart indicate the reaction levels, serving as additional points of significance to consider. Furthermore, take note of the response at the levels of the High, Low, and Close values from the day prior.
We hope you find this information beneficial in your trading endeavors.
* If you found the idea appealing, kindly tap the Boost icon located below the chart. We encourage you to share your thoughts and comments regarding it.
Wishing you success in your trading activities!
Nifty levels - Jul 15, 2025Nifty support and resistance levels are valuable tools for making informed trading decisions, specifically when combined with the analysis of 5-minute timeframe candlesticks and VWAP. By closely monitoring these levels and observing the price movements within this timeframe, traders can enhance the accuracy of their entry and exit points. It is important to bear in mind that support and resistance levels are not fixed, and they can change over time as market conditions evolve.
The dashed lines on the chart indicate the reaction levels, serving as additional points of significance to consider. Furthermore, take note of the response at the levels of the High, Low, and Close values from the day prior.
We hope you find this information beneficial in your trading endeavors.
* If you found the idea appealing, kindly tap the Boost icon located below the chart. We encourage you to share your thoughts and comments regarding it.
Wishing you success in your trading activities!
Nifty levels - Jul 14, 2025Nifty support and resistance levels are valuable tools for making informed trading decisions, specifically when combined with the analysis of 5-minute timeframe candlesticks and VWAP. By closely monitoring these levels and observing the price movements within this timeframe, traders can enhance the accuracy of their entry and exit points. It is important to bear in mind that support and resistance levels are not fixed, and they can change over time as market conditions evolve.
The dashed lines on the chart indicate the reaction levels, serving as additional points of significance to consider. Furthermore, take note of the response at the levels of the High, Low, and Close values from the day prior.
We hope you find this information beneficial in your trading endeavors.
* If you found the idea appealing, kindly tap the Boost icon located below the chart. We encourage you to share your thoughts and comments regarding it.
Wishing you success in your trading activities!
Nifty levels - Jul 11, 2025Nifty support and resistance levels are valuable tools for making informed trading decisions, specifically when combined with the analysis of 5-minute timeframe candlesticks and VWAP. By closely monitoring these levels and observing the price movements within this timeframe, traders can enhance the accuracy of their entry and exit points. It is important to bear in mind that support and resistance levels are not fixed, and they can change over time as market conditions evolve.
The dashed lines on the chart indicate the reaction levels, serving as additional points of significance to consider. Furthermore, take note of the response at the levels of the High, Low, and Close values from the day prior.
We hope you find this information beneficial in your trading endeavors.
* If you found the idea appealing, kindly tap the Boost icon located below the chart. We encourage you to share your thoughts and comments regarding it.
Wishing you success in your trading activities!
Nifty levels - Jul 10, 2025Nifty support and resistance levels are valuable tools for making informed trading decisions, specifically when combined with the analysis of 5-minute timeframe candlesticks and VWAP. By closely monitoring these levels and observing the price movements within this timeframe, traders can enhance the accuracy of their entry and exit points. It is important to bear in mind that support and resistance levels are not fixed, and they can change over time as market conditions evolve.
The dashed lines on the chart indicate the reaction levels, serving as additional points of significance to consider. Furthermore, take note of the response at the levels of the High, Low, and Close values from the day prior.
We hope you find this information beneficial in your trading endeavors.
* If you found the idea appealing, kindly tap the Boost icon located below the chart. We encourage you to share your thoughts and comments regarding it.
Wishing you success in your trading activities!

Nifty levels - Jul 09, 2025Nifty support and resistance levels are valuable tools for making informed trading decisions, specifically when combined with the analysis of 5-minute timeframe candlesticks and VWAP. By closely monitoring these levels and observing the price movements within this timeframe, traders can enhance the accuracy of their entry and exit points. It is important to bear in mind that support and resistance levels are not fixed, and they can change over time as market conditions evolve.
The dashed lines on the chart indicate the reaction levels, serving as additional points of significance to consider. Furthermore, take note of the response at the levels of the High, Low, and Close values from the day prior.
We hope you find this information beneficial in your trading endeavors.
* If you found the idea appealing, kindly tap the Boost icon located below the chart. We encourage you to share your thoughts and comments regarding it.
Wishing you success in your trading activities!
Nifty levels - Jul 08. 2025Nifty support and resistance levels are valuable tools for making informed trading decisions, specifically when combined with the analysis of 5-minute timeframe candlesticks and VWAP. By closely monitoring these levels and observing the price movements within this timeframe, traders can enhance the accuracy of their entry and exit points. It is important to bear in mind that support and resistance levels are not fixed, and they can change over time as market conditions evolve.
The dashed lines on the chart indicate the reaction levels, serving as additional points of significance to consider. Furthermore, take note of the response at the levels of the High, Low, and Close values from the day prior.
We hope you find this information beneficial in your trading endeavors.
* If you found the idea appealing, kindly tap the Boost icon located below the chart. We encourage you to share your thoughts and comments regarding it.
Wishing you success in your trading activities!

Nifty levels - Jul 07, 2025Nifty support and resistance levels are valuable tools for making informed trading decisions, specifically when combined with the analysis of 5-minute timeframe candlesticks and VWAP. By closely monitoring these levels and observing the price movements within this timeframe, traders can enhance the accuracy of their entry and exit points. It is important to bear in mind that support and resistance levels are not fixed, and they can change over time as market conditions evolve.
The dashed lines on the chart indicate the reaction levels, serving as additional points of significance to consider. Furthermore, take note of the response at the levels of the High, Low, and Close values from the day prior.
We hope you find this information beneficial in your trading endeavors.
* If you found the idea appealing, kindly tap the Boost icon located below the chart. We encourage you to share your thoughts and comments regarding it.
Wishing you success in your trading activities!

Nifty in Volatile Range#NIFTY FUT– 25,508.0
S1 – 25,395.0
S2 – 25,348.0
R1 – 25,658.0
R2 – 25,718.0
Doji formation has seen post Red
candle with inline volume,
indicates consolidation on daily
chart. Nifty has closed above 7, 14
and 21 DMA that seen at 25487,
25337 and 25222 levels. Nifty
future has resistance at 25658
levels while support seen at 25395
level..
More support and Resistance Show in chart...
All information Education Purpose only

Nifty levels - Jul 04, 2025Nifty support and resistance levels are valuable tools for making informed trading decisions, specifically when combined with the analysis of 5-minute timeframe candlesticks and VWAP. By closely monitoring these levels and observing the price movements within this timeframe, traders can enhance the accuracy of their entry and exit points. It is important to bear in mind that support and resistance levels are not fixed, and they can change over time as market conditions evolve.
The dashed lines on the chart indicate the reaction levels, serving as additional points of significance to consider. Furthermore, take note of the response at the levels of the High, Low, and Close values from the day prior.
We hope you find this information beneficial in your trading endeavors.
* If you found the idea appealing, kindly tap the Boost icon located below the chart. We encourage you to share your thoughts and comments regarding it.
Wishing you success in your trading activities!
