JSW steel - long"JSW Steel has broken its all-time high today, ranging between 816 and 770. If you can get this share at any price within this range, you can consider investing in it, as it is expected to provide excellent returns in the near future."
Niftyview

NIFTY updateNifty is not done yet as per this count and there's clearly more upside to be seen in coming weeks.
Alternatively an expanded flat in red wave iV cannot be ruled out for now, which however would still lead to more upside later.
I will update the chart as it develops further.
Thanks for reading!

NIFTY -"G" - 20kEvents, Socio Economics, Moods and Mania are more powerful indicator than drill down economic analysis. While the later can satisfy your rational taste buds, the former keeps you grounded when the irrationality hits the ground. The G-20 meeting brings INDIA on headlines, while the bulls rise a toast on the occasion, nothing seems go wrong for us. While the Index making headlines, after completing very healthy correction to 19300 and then rise, this time it appears we are propelled to life above 20 K. Usually it is bull's vs bears, but this last three months it has clearly becomes bulls Vs bulls. No longer happy with 100% returns in three months kind of euphoria. Let that sink in. Kotak gives first warning, don't think markets would take cognisance of this yet. Focus remains on the bull side. What is magical about this is the structural bottom moved to 19300 and that is quite safe for anyone to approach the markets. No wonder, everyone is a bull, every group is active with bull views. There is clamour for tips. All the indicators are in healthy trend, so far, no signs of a U turn. The graph is half weekly and is in incomplete stage. We started with huge engulfing bull candle around the 19300 area, no wicks there. Then followed by large bull body with minor wicks. Now the current candle opens with a gap and completes tomorrow. The question that worries for those who are in sidelines is at level to enter, then whether to enter or not. For the SIP it is a static buy at all levels, no brain power is required for that. For the traders, it is a fight that they are used to it. 19930 is the near-term support while it holds, we aim toward 20180.

NIFTY POLE and FLAG continue BULL rallyAs we Have been discussing NIFTY gave a breakout on 2st SEP, SInce than we have been playing long on NIFTY.
NIFTY flag and pole target is still not completed. Nifty has broken all time high but today's volume was not good enough thats shows people are having Fear of all time high.
If we see Nifty Options chain data its super bullish.
I am expecting a little consolidation at this level . you can not go short by considering that it's all time high.
Reason :
Nifty price is far from EMAs, that means it has to consolidate after a big bull move of continues 2 weeks.
RSI is in Oversold zone that also indicate it need some consolidation.
This all time high is touched 2nd time, very low probablity to break and continue the trend.
VWAP << to Price means price need some rest to get average out.
PCR: 1.42, if 20,000 is crossed then it will have a heavy call unwinding of 20,000 level, that might take it to 20250. but chances to be continious bullish is very less.
Verdict :
Some Consolidation is expected.
Plan of Action :
Sell 19950 PE and Sell 20,000 CE

NIFTY--Rally Base Rally ??After the break of trendline,the Index is continue its momentum towards high...
If this rally continues to move upside, we are still pending with some more momentum left,
will soon this will touch 20600 levels.
Price broken the Bench mark of 20000 level today, but failed to close above the 20K.

NIFTY 11.09.2023 LEVELNifty Spot : 19819.95
Dear Followers Kindly Don't Take Any Buy or Sell Trades Today... Please Watch My Option Level One Week.
Draw Buy, Sl, T1 to T5 Lines In Your Broker Application
Trailing Purpose Only.
Option Strike : 19800 CE :
Buy At : 98, Sl : 64
Target : 122
Target : 147
Target : 172
Target : 196
Target : ++++++++
Option Strike 20150 PE :
Buy At : 95, Sl :62
Target : 119
Target : 143
Target : 166
Target : 196
Target : +++++++++
Every Target Is An Entry Point. First You Conform The Trend..
Market Goes Uptrend Or Downtrend. Then Only You Entre or buy The Strike.
If You Enter Stop Loss is Below The Target 20 To 30 Points.. Otherwise You Loss The Money.
Kindly Watch My Break Even Point. Every Day.
Above The Break Even Point UPTREND Starts
Below The Break Even Point DOWNTREND Starts.
Don"t Enter Blindly.

NIFTY--Retracement or Reversal ?? The price has exhibited significant bullish momentum starting from the 19,200 levels. However, before attempting to challenge the bearish gap left at the all-time high (ATH), it's likely to experience retracements towards previous resistance levels.
Should these resistance levels fail to sustain upward pressure, a notable bearish reversal could become apparent. Following a period of strong bullish movement, the price appears to have entered a ranging phase.
During this phase, it may be prudent to consider short positions, anticipating the possibility of price offering discounts before potentially resuming its upward trajectory.
If retracement failed, they will take the price entirely to the bottom side...keep safe before long. Reversal may occur.

A proper Breakout above the mid channel resistance for NiftyNifty has given a proper Breakout above the mid channel resistance showing bullish momentum. 20,000 points on Nifty along with G-20 can be the theme for the next week. For this to happen there are 2 important resistances which Nifty has to cross. These resistances are 19867 and 19991. Supports on the lower side for Nifty in case the breakout fails will be at 19720, 19516, 19360 and 19223. Trend changes to negative in case we get a closing below 19223.

Pin point predictions of Bharat Forge for 10-9-23 to 14-9-23Hello Traders,
This is my trade plan for Bharat Forge next week all markings for support and resistance where entry and exit can be taken . For complete plan check below.

Bullish kicker reversal confirmation A strong bullish candle post Bullish Kicker Candle sticks reflect the reversal
Key level:
Support: 19230 - 19300
Resistance: 19900-20000

NIFTY looking to Shot the Moon.As per the Recent Price Actions, it seems Nifty is ready to make a new move for the Upside and target 19980. as we have found some support around 19300. already we are in a long term momentum for the upside.

NIFTY--08/09/23I am sharing the important levels of Support and Resistance. These levels play a crucial role in trading decisions, as they act as reliable markers of price movements. Support levels are price points where an asset tends to find buying interest, preventing it from falling further. Resistance levels, on the other hand, are points where selling pressure typically prevents the asset from rising higher.
Take a look at these levels and trade accordingly. Recognizing and respecting these support and resistance levels can help traders make informed decisions and manage risk effectively. They serve as key reference points for technical analysis and are vital tools in successful trading strategies.
Trade safe...Thank you guys for your support.

Nifty 50 next stepsThere is below probabilities in this analysis
1. Completed correction as per fibo 23.8%. from monday it will start new upside wave, still its not confirmed but (if its holds this low or above 19800 close) it will confirm soon.
2. Completed A wave 19230 levels now started B wave with ABC pattern for the minimum targets of 19700. Then C wave upto 19090-18784 .
3. C wave running from Recent high of 19584 and it will end near 19784 levels . This will be activated below 19235 levels.
If any one need further clarification kindly ping me...

NIFTY 08.09.2023 LEVELSNifty Spot : 19727.05
Dear Followers Kindly Don't Take Any Buy or Sell Trades Today... Please Watch My Option Level One Week.
Draw Buy, Sl, T1 to T5 Lines In Your Broker Application
Trailing Purpose Only.
Option Buy 19600 CE : Buy At : 133, Sl : 86
T1 :166, T2 : 200, T3 : 233, T4 : 270, T5 : 300
Option Buy 19600 PE : Buy At : 82, Sl : 53
T1 : 102, T2 : 123, T3 : 143, T4 : 164, T5 : 184
Kindly Watch My Break Even Point. Every Day.
Above The Break Even Point UPTREND Starts
Below The Break Even Point DOWNTREND Starts.
SL Break Even Point Near

NIFTY-08-09-23I am sharing the important levels of support and Resistance, based on my personal view.
If want to take the trade if any 15-minute candle closes above these levels enter in trade.
these levels act as strong levels of support and resistance.
Follow for more.

NIFTY--Bull trap or Bear Trap??Price is exactly closed in the previous strong fall area.
At the end of the session, the price is showing strong bullishness.
In this bullishness, if buyers exit their positions at this zone...tomorrow it is bearish, continue its move downside.
If this is a bull's continuous move, it will continue upwards and test the bearish gap.
will see in the next session what happens.

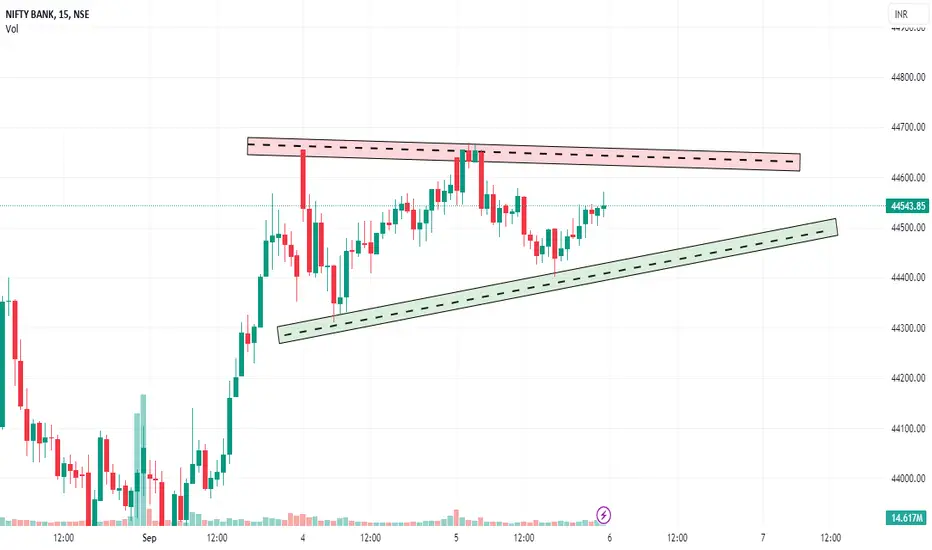
06 SEPT 2023 BANKNIFTY SUPPORT AND RESISTANCE LEVELSHello Guys,
Good Morning everyone,
According to the data today market is going to open Flat
After A Flat opening if Banknifty sustain Above 44650 and taking Support from 44650 then open target for T1-44700,T2-44900,T3-45000
If the Banknifty Flat opening sustain Below 44400 and taking resistance below 44400 then the open Targets for T1-44300,T2-43100,T3-44000
Major Levels 44500,44200,44600
If the market stande in this area of 44500 to 44700, then it is possible that even today the market will remain in the range.
Nifty 50 for 9/6/2023Hello Traders,
Hope you're well.
Today, buying options, especially Puts, was tough as the market made three peaks and premium prices dropped fast. Even if you were right about the direction, it was hard to hold onto your trade.
Earlier, we pointed out that 19,230 was a good buying area, and it turned out right. We saw a 350-point rise from there. Many expected the market to go below 19,230, but it surprised us by going up to 19,574.50. What's next? Read below.
Support Areas for Nifty 50:
Two buying zones to watch are around 19,482 to 19,452. Wait for the market to hit these levels before buying. Aim for 19,527 and 19,562 with a stop loss below 19,445. Be patient and don't rush into trades. If Nifty goes under 19,440, be prepared for a drop to 19,260.
Resistance Areas for Nifty 50:
The high today was 19,587, a strong resistance. We think the market might return to these levels to shake out sellers and attract new buyers. If Nifty goes above 19,587 and then drops back down, consider buying Put options (PE) with a stop loss at the highest point of that drop. This could result in an 87-point move to 19,500.
Personal Opinion:
While we've given different scenarios, our personal view is that if the market stays above 19,600 for a whole day, it could aim for 20,000 soon. Many traders are still ready to buy Puts, and sentiment remains unchanged.
Please note that I am not a SEBI registered advisor, and these trades are for educational purposes only.
We recommend focusing on intraday trades and avoiding holding positions overnight.

NIFTY--Liquidity @19400 ??Price is trending upwards from 19250 levels..
we have a bearish gap left at 19650 levels...
that bearish gap may again acts as resistance...
on bottom side we have liquidity @19400 levels.One more strong resistance at 19750 levels,
at 19650 levels wait if turned to be bearish ...if no bearishness price will touch the 19750, keep in bullish side from 19400 levels.


NIFTY 06-09-23I am sharing the important levels of support and Resistance, based on my personal view.
If want to take the trade if any 15-minute candle closes above these levels enter in trade.
these levels act as strong levels of support and resistance.
Follow for more.

#NIFTY TRADE IDEA SETUPGreetings Folks,
today i have prepared a setup on NIFTY
the analysis is simple
- price structure is weakening
- a price pullback is needed for further move
- volume is contradicting the movement
dont play with fire, always use a predefined stoploss

#NIFTY Intraday Support and Resistance Levels - 05/09/2023Nifty will be gap up opening in today's session. After opening nifty sustain above 19560 level and then possible upside rally up to 19680 in today's session. in case nifty trades below 19510 level then the downside target can go up to the 19390 level.
