Nikkei 225. Tokyo Open Delivery cause of Geopolitical DriversSharing my Tokyo Open model for the daily expansion on Nikkei. Along with Intraday market profiles. And Quarterly Theory
NKD1!

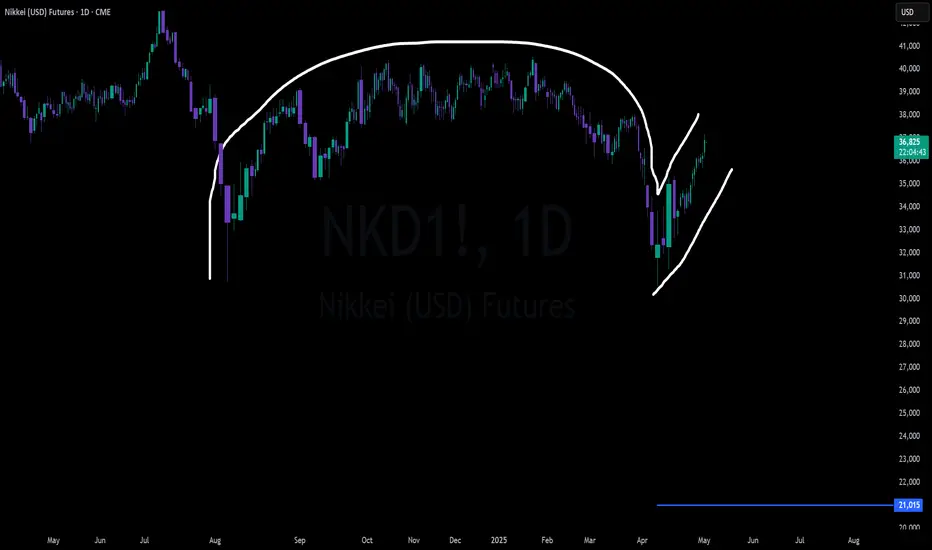
Nikkei Futures (NKD/Nikkei 225) Inverse Cup and HandleNikkei futures have setup an inverse cup and handle on the daily. A somewhat rare pattern as most of them turn into double bottoms or sideways consolidation. Maximum downside target for the pattern is 21,000
- Global macro trends continue to worsen
- BOJ stuck between saving the Yen and helping the dollar
- Japan economic fundamentals may allow BOJ to allow inflation to run hot
- Possible US recession could spread around the world
- Yen carry trade still in play although most likely only blows up in catastrophic situation
- Japan has seen the benefit of US monetary and fiscal policy, Trump admin likely to try to pressure Japan into spending money on US goods such as food and weapons
Overall sentiment on NKD is that it has followed US markets especially the Nasdaq for some time. DXY moving up takes pressure off the Yen carry but could be a sign of now US firms taking profit on a very large run up in the past few weeks. Regardless of outcome, volatility is expected.
NQ-SP500-NKD-BTC, The wave has startedCME_MINI:NQ1! BINANCE:BTCUSD
CME_MINI:ES1! CME:NKD1!
The wave has started. It's slow, and choppy as they move through the time frames, so if you play the longer time frames, be patient. If you play the shorter time frames, ensure you take profit along the way so you're not chopped up
Video covers – NQ – SP500 – NKD – BTC
ES (S&P) – 100 pt price blocks (Bold Yellow Lines)
NQ (Nasdaq) – 500 pt price blocks
NKD (Japanese Market) – 1000 pt price blocks
BTC (Bitcoin) – 5000 pt price blocks
Legend
Bold Yellow Lines: Top and Bottom of Price Blocks
Dotted Blue Lines: 50% of any Price Block
White Solid Line: 20 EMA
Yellow Solid Line (not price block): 50 EMA
Blue Solid Line: 200 EMA
Method: Follow the MACD and the 200 EMA. Generally speaking, if the MACD is negative or heading negative, the price should be below the 200 EMA or heading below it, and visa versa, as it goes up to go positive, so should the price, and you should be targeting a price (at a significant level – price block) above the 200 EMA.

NQ - SP500 - NKD - BTC Coming Week(s) - BearKey Points:
Video covers – CME_MINI:NQ1! - CME_MINI:ES1! - CME:NKD1! - BINANCE:BTCUSD
ES (S&P) – 100 pt price blocks (Bold Yellow Lines)
NQ (Nasdaq) – 500 pt price blocks
NKD (Japanese Market) – 1000 pt price blocks
BTC (Bitcoin) – 5000 pt price blocks
Legend
Bold Yellow Lines: Top and Bottom of Price Blocks
Dotted Blue Lines: 50% of any Price Block
White Solid Line: 20 EMA
Yellow Solid Line (not price block): 50 EMA
Blue Solid Line: 200 EMA
Method: Follow the MACD and the 200 EMA. Generally speaking, if the MACD is negative or heading negative, the price should be below the 200 EMA or heading below it, and visa versa, as it goes up to go positive, so should the price, and you should be targeting a price (at a significant level – price block) above the 200 EMA.

Elliott Wave Intraday Analysis Expecting Nikkei (NKD) to Extend Short Term Elliott Wave in Nikkei (NKD) suggests the Index shows short term incomplete bearish sequence from 7.10.2024 high favoring further downside. Decline from 7.10.2024 is in progress as a double three Elliott Wave structure. Down from 7.10.2024 high, wave (W) ended at 37395. Rally in wave (X) ended at 39318 with internal subdivision as a zigzag structure. Up from wave (W), wave A ended at 38785 and wave B ended at 37395. Wave C higher ended at 39318 which completed wave (X) in higher degree.
The Index has turned lower in wave (Y) with internal subdivision as a zigzag structure. Down from wave (X), wave ((i)) ended at 37405 and wave ((ii)) ended at 38010. Wave ((iii)) lower ended at 36465 and wave ((iv)) ended at 36920. Final leg wave ((v)) ended at 36165 which completed wave A in higher degree. Wave B rally is in progress to correct cycle from 7.31.2024 high before it turns lower. Near term, while below 39318, expect rally to fail in 3, 7, or 11 swing for further downside. Potential target lower is 100% – 161.8% Fibonacci extension of wave (W). This area comes at 30932 – 34135 where buyers can appear for further upside, or 3 waves rally at least.

NIKKEI Gradually turning bearish for the next 3 months.Nikkei (NI225) has given us one of the best long-term trades last year (May 26 2022, see chart below), as we gave a signal for the most optimal buy entry one could expect, on the 10 year (since October 2012) Higher Lows trend-line, and from 26000 it has now surpassed 40000:
The question is obvious: what do we do from here, especially after the remarkable bullish start to 2024? To answer that, we have to to go to the logarithmic scale on the 1W time-frame and observe the Channel Up since the June 2012 bottom.
The biggest fact is that the current bullish leg of the Channel (since the March 2022 Low), has already surpassed the roughly +63% magnitude of the previous two legs by +3%. This suggests that we are forming the current Higher High but the 1W RSI hasn't yet made a Higher High of its own, so the rally may be extended for a few weeks more.
What has been very consistent though during this 12-year Channel Up, is the tops as identified by the Sine Waves. The next Wave Top is on January 2025 and that would be the time to sell towards a 1W MA200 (orange trend-line) test again. Nikkei though has formed the previous Highs on Double Tops, so it is possible to make a 1W MA50 (blue trend-line) correction now and then rebound towards January 2025 for a Double Top peak.
As a result, we now turn bearish on Nikkei for the next 3 months, targeting 36000 and after the 1W MA50 holds, buy again for an end-of-year target at 40000, before the next correction/ Bear Cycle starts.
-------------------------------------------------------------------------------
** Please LIKE 👍, FOLLOW ✅, SHARE 🙌 and COMMENT ✍ if you enjoy this idea! Also share your ideas and charts in the comments section below! This is best way to keep it relevant, support us, keep the content here free and allow the idea to reach as many people as possible. **
-------------------------------------------------------------------------------
💸💸💸💸💸💸
👇 👇 👇 👇 👇 👇

Is the Santa Claus Rally on Its Way Again?The lights, carols and the last FOMC of the year, you know the drill by now, Christmas is here soon!
As we head into the year's end, it's the perfect time to revisit an old idea we had last Christmas. In our piece last December titled “ Is the Santa Claus rally real? ” we explored the concept of the Santa Claus rally, discussing why and how a modified version might work.
To recap, last year we proposed examining the Santa Claus rally through a spread between the S&P500 and the Nikkei, rather than focusing solely on either the S&P or Nikkei alone. This approach was based on several reasons:
1) Holiday Impact: The Christmas holiday holds greater cultural importance in the US, likely resulting in more holiday observance in the US compared to Japan.
2) Diverging Monetary Policies: The Bank of Japan is set to meet next week, and while no change in the policy rate is expected, we're looking for any hints on the timing of an exit from negative interest rates. Conversely, the Federal Reserve has just signalled expectations of up to 75bps rate cuts in 2024, marking a policy shift. These differing policies could influence equities in their respective markets differently.
3) Difference in Accounting/Financial Years: Different accounting practices and book closure dates mean that institutional traders in each market will have varying flows as they prepare to close positions for the financial year.
4) January Effect Front-Running: Investors re-establishing positions after December's tax loss harvesting.
With policy directions now swapping, optimism for this strategy's success is higher this year. The Federal Reserve signalling an end to hikes, has resulted in the S&P500 surging closer to previous all-time highs.
Meanwhile, the USDJPY has collapsed from its high of 152, as views grow that the BOJ might end its negative interest rate policy sooner than expected, as alluded to by BOJ Governor Ueda.
This Christmas, we'll compare what happened last Christmas to see if a similar pattern emerges this year.
A review of last year's Christmas effect shows that the spread rose roughly 12% from mid-December to mid-February.
This result adds to the current streak of a 60%-win rate since 2013, now improving to 63% with a simple average return of about 33%.
Examining each index individually, we find that periods where the S&P 500’s RSI is above 75 and the Nikkei 225’s RSI is around 50 have generally preceded critical junctures where the S&P 500 continues to rise while the Nikkei remains rangebound or falls.
Additionally, observing the S&P500 and Nikkei 225 spread, we notice an ascending triangle pattern, with current price action breaking above. An ascending triangle is typically associated with bullish continuation.
Considering the broad macro factors, such as changing monetary policy stances aligning with the historical behavior of the Santa Claus rally, along with a bullish technical setup, we lean bullish on this spread. To express this bullish view, one could go long on the E-mini S&P 500 Futures and short on the Nikkei/USD Futures. At the current price levels, the notional value of one S&P 500 Futures contract is 4771*50 = 238550 and the notional for the Nikkei futures is 33010*5 = 165050, hence to match the notional we can trade 2 S&P 500 Futures contracts against 3 Nikkei Futures contract with the intent of holding the position from now till the middle of February.
The charts above were generated using CME’s Real-Time data available on TradingView. Inspirante Trading Solutions is subscribed to both TradingView Premium and CME Real-time Market Data which allows us to identify trading set-ups in real-time and express our market opinions. If you have futures in your trading portfolio, you can check out on CME Group data plans available that suit your trading needs www.tradingview.com
Disclaimer:
The contents in this Idea are intended for information purpose only and do not constitute investment recommendation or advice. Nor are they used to promote any specific products or services. They serve as an integral part of a case study to demonstrate fundamental concepts in risk management under given market scenarios. A full version of the disclaimer is available in our profile description.
Reference:
www.cmegroup.com
www.cmegroup.com
www.fool.com
www.jstor.org

NIKKEI: Bull Flag broken upwards. Target 34,000Nikkei crossed over its late three month Channel Down pattern which according to the almost +30% rise that preceded it, may be the Bull Flag that technically follows and transitions into the next rally. The 1D technical outlook already turned bullish (RSI = 58.030, MACD = 173.400, ADX = 33.840) and as the 2021 fractal, targets the R1, or at least a little under it (TP = 34,000).
See how the 1D MA100 supported the downtrend on the August 17th bottom and shortly after a Bullish Cross on the 1D MACD followed.
## If you like our free content follow our profile to get more daily ideas. ##
## Comments and likes are greatly appreciated. ##

Nikkei ETF's looking promising 2023+The Nikkei, also known as the Nikkei Stock Average , is a stock market index for the Tokyo Stock Exchange in Japan. It is often used as a benchmark for the performance of the Japanese stock market.
Traders use the Nikkei to track the overall direction of the Japanese stock market and to gain insights into the performance of specific sectors and companies. They may also use technical analysis and other tools to analyze the movements of the Nikkei and make trading decisions based on its trends and patterns.
In addition, the Nikkei is sometimes used as an underlying asset for financial instruments such as futures contracts, options, and exchange-traded funds (ETFs), which allow traders to speculate on or hedge against changes in the index.

Nikkei Futures ( NKD1!), H4 Potential for Bearish continuationTitle: Nikkei Futures ( NKD1!), H4 Potential for Bearish continuation
Type: Bearish continuation
Resistance: 26555
Pivot: 25960
Support: 25610
Preferred case: Looking at the H4 chart, my overall bias for NKD1! is bearish due to the current price being below the Ichimoku cloud, indicating a bearish market. If this bearish momentum continues, expect price to continue heading towards the support at 25610, where the previous swing low is.
Alternative scenario: Price may head back up to retest the pivot at 25960, where the 61.8% Fibonacci line is.
Fundamentals: There are no major news.

Is the Santa Claus rally real?As we approach Christmas, for yet another year, we wonder if Santa is real, or rather if the Santa Claus Rally is real.
Some hypotheses about the Santa Claus rally include the lowered Institutional liquidity as traders go on holiday (just like us, soon!). That leaves the retail crowd, proven to be bullish on just about anything, pushing markets higher. There have been many studies on this effect on the US markets with results ranging from slightly better than a coinflip chance to none at all.
We thought to experiment with this idea and look at the same effect but on another market instead.
With the massive benefit of hindsight, a simple, buy the Nikkei 225 in the middle of December and sell at the high/low before March comes around strategy, giving a win rate of 70% and an average win return of 10.3%, while the average loss was -11.3%. Interesting, but nothing much better than a coin toss with some variance.
Now as a Trader, we always try to position ourselves in highly expected value situations and find a unique edge where others might not look.
In this instance, how we can re-position ourselves is perhaps by looking at the spread between the US Index against the Japanese Index, before trying to identify the seasonal factor (Santa Claus Rally). But before we go further, it’s often good to think about how or why this trade might just work out:
1) Holiday impact – generally the Christmas holiday holds greater cultural importance in the US, hence it is likely that more will be on holiday in the US during this season.
2) Diverging monetary policies - The Bank of Japan remains one of the last central banks which stick to its negative interest rate policy (NIRP) even as inflation creeps higher. While the US Federal Reserve has led the world with its ultra-hawkish stance, raising its policy rates in a steadfast manner. The differences in monetary policies could nurture different directions for equities in respective markets, namely hawkish or tight conditions for the US vs dovish easing condition for the Japanese market.
3) Difference in accounting/Financial years – Differing accounting practices and book closure dates mean flows will differ for each market as institutional traders prepare to close their positions for their financial year.
4) Investors trying to front-run the January effect, where investors re-establish their positions after tax loss harvesting in December.
These factors combined drive the Japanese and US markets differently, especially over this, year-end, holiday season.
On to specifics, one way to look at the spread between the US and Japanese market could be to use the S&P500 Futures and Nikkei 225 Futures as proxy for the individual markets. Adjusting each Futures contract by the point value, $50 USD x S&P 500 Index point for the S&P500 Futures and $5 USD x Nikkei Stock Average for the Nikkei 225 Futures allows us to compare the two on a contract value/dollar for dollar basis.
Applying the same, buy in the middle of December and sell before March strategy, gives a similar 60% win rate, but the average win now returns 71.4% while the average loss is -18.3%. A very rough back of the napkin expected value calculation gives this strategy a rough 35% expected return while the strategy on the Nikkei 225 alone returns roughly 4%.
While one could try this strategy, we intend to provide a starting point to reflect on how we could creatively pair products to extract more value out of decades-old strategy. For example, on CME the listed Japanese Index Futures suite alone consists of products, such as the Dollar & Yen denominated Nikkei 225 (NIY/NKD) and Topix (TPY/TPD), all of which could be used to form variants of the above strategy. Something to think about as we head into the holiday season and prepare ourselves for an even better trading year ahead.
And just like that, we are on our last piece for the year. We will be taking the rest of the year off and back in January with more! Merry Christmas and Happy Holidays everyone!
The charts above were generated using CME’s Real-Time data available on TradingView. Inspirante Trading Solutions is subscribed to both TradingView Premium and CME Real-time Market Data which allows us to identify trading set-ups in real-time and express our market opinions. If you have futures in your trading portfolio, you can check out on CME Group data plans available that suit your trading needs www.tradingview.com
Disclaimer:
The contents in this Idea are intended for information purpose only and do not constitute investment recommendation or advice. Nor are they used to promote any specific products or services. They serve as an integral part of a case study to demonstrate fundamental concepts in risk management under given market scenarios. A full version of the disclaimer is available in our profile description.
Sources:
www.jstor.org
www.fool.com
www.cmegroup.com
www.cmegroup.com
www.cmegroup.com
www.cmegroup.com

Nikkei225 +415points, What Next?In this update we review the recent price action in the Nikkei225 futures contract and update the trade strategy and price objectives to target

Nikkei Pivotal Trend TestIn this update we review the recent price action in the Japanese Nikkei futures contract and identify the high probability trading opportunity and price objectives to target

Trading Range on Nikkei 225 Dollar FuturesWe are in Trading Range on the Nikkei 225 Dollar Futures .
Like and Comment will be hugely appreciated, thank you so much for your support.
See other ideas below too!
RISK DISCLAIMER:
Trading Futures ,Forex, CFDs and Stocks involves a risk of loss.
Please consider carefully if such trading is appropriate for you.
Past performance is not indicative of future results.
Always limit your leverage and use tight stop loss.

Stocks - Nikkei on Last LegsIdea for Nikkei:
I'm waiting for Asia markets to drag down US markets, but why not just short Asia itself first?
- The sugar rush of QE is over, and Japan is rolling over. Expecting its bear market since Feb to resolve in a capitulation at least down to a monthly support.
- Nikkei under 100D and 9M and at critical support. (50W)
- Expect to quickly capitulate to 24k~ support levels when this floor breaks.
This is not US markets, which rises based solely on gamma, and the slowing global economy is weighing down on it. IMO, any rips here should be sold.
50W:
20M:
GLHF
- DPT


3 Press Low In To Channel Low Bear Failure PotentialSellers have been very strong on the drive down and now breaking lower again with a 3 press low is beginning to show signs of slowing. Each consecutive low is less distance than before and rounding off and it just so happens to be occurring at the channel lows. Buyers are under pressure here and this is a last ditch for them. A break below the low would be a potential reversal signal for 2 legs lower but, assuming bulls hold above the low (or don't allow it to break much), buyers have a great R:R shot at a long that could potentially turn in to a much longer term swing.

Elliott Wave View: Pullback in Nikkei Should ContinueElliott Wave View of Nikkei (NKD_F) suggests the Index ended the cycle from April 2 low as wave ((3)) at 23630 high. Currently, Index is doing a pullback in wave ((4)) to correct against that cycle. The correction is proposed to be unfolding as a double three Elliott Wave Structure. Down from wave ((3)) high, wave A ended at 22960 low. The bounce in wave B ended at 23325 high. Index then resumed lower and ended wave C at 22840 low. This completed wave (W) in higher degree.
Afterwards, Index bounced higher in wave (X) to correct against the cycle from September 3 high. The subdivision of the bounce unfolded as another double three correction. Wave W ended at 23275 high and wave X ended at 23040 low. Wave Y ended at 23310 high, which also completed wave (X) in higher degree. Since then, Index has resumed lower and broke below previous wave (W) low to confirm that next leg lower in (Y) has already started. The 100-161.8% extension of wave (W)-(X) where (Y) can potentially ends is at 22030-22520 area. If reached, that area should see a reaction for 3 waves bounce at least.

Elliott Wave View: Nikkei (NKD_F) Extending HigherElliott Wave View in Nikkei Futures (NKD_F) suggests the Index has just broken above June 5 high, suggesting the cycle from March low remains alive and the Index has resumed higher. The break higher is likely still part of wave ((5)) of the same cycle from March low. Shorter cycle, 1 hour chart below shows pullback to 21705 ended wave (2). Up from there, the Index ended wave 1 at 22655 high. The internal subdivision of wave 1 unfolded as 5 waves impulse Elliott Wave Structure. Wave ((i)) of 1 ended at 22005 high and wave ((ii)) pullback ended at 21800 low. Rally higher in wave ((iii)) then ended at 22405 high, followed by wave ((iv)) pullback which ended at 22340 low. Wave ((v)) then extended higher and ended at 22655 high. Afterwards, the Index did a pullback in wave 2, which ended at 22205 low.
From there, the Index has extended higher in wave 3. Up from wave 2 low, wave ((i)) ended at 22535 high and wave ((ii)) dips ended at 22345 low. Index then extended higher in wave ((iii)) towards 22960 high. The pullback in wave ((iv)) ended at 22670 low. The index can still see another high before ending wave ((v)). This would end wave 3 in the higher degree. Index then could correct within wave 4 before resuming higher again. The latest rally has broken above previous wave 1 high to confirm that the leg higher is already in progress. While pullback stays above 22205 low, expect the dips in 3,7 or 11 swings to find support for more upside.

Elliott Wave View: Further Upside in NikkeiShort term Elliott Wave view of Nikkei (NKD_F) suggests that the rally from 5.14.2020 low is unfolding as a 5 waves impulsive Elliott Wave structure. Up from 5.14.2020 low, wave (1) ended at 20830 and pullback in wave (2) ended at 20247 as chart below shows. Internal of wave (2) unfolded as a double three (double zigzag). Down from wave (1) at 20830, Wave W ended at 20515 as a zigzag, wave X ended at 20685, and wave Y lower ended at 20245 as a zigzag.
Index then resumed higher in wave 3 which ended at 21730. Subdivision of wave 3 unfolded as another 5 waves in lesser degree. Up from wave (2) at 20247, wave 1 ended at 20550 and wave 2 ended at 20465. Wave 3 ended at 21370, wave 4 ended at 21150, and wave 5 of (3) ended at 21730. Pullback in wave (4) is proposed complete at 21410 and Index has resumed higher by breaking above wave (3) again. Near term, while pullback stays above wave (4) low at 21410, but more importantly above wave (2) low at 20247, expect Index to extend higher. As far as pivot at 20247 low stays intact, dips should find buyers in 3, 7, or 11 swing for further upside.

Global Stock MarketLooking at the biggest equity markets in the world - let's remember to keep our eyes on stocks as an asset class, not just US equities!

NIKKEI 225 is going back to near all time highInverse H&S pattern formed awaiting confirmation on breakout, verified by diminishing volume into the breakout and the recent strong price action.
If breakout succeeded will send it to 23,200 -ish. Aligns with my prediction on SPX to 2,900
###This is not an investment advice, trade with care with your own risk!###
