NOK.nyse NOKIA as a long term investment Nokia is coming with new phones and improved ones in 2019 plus new deals around the glob as we can find info around the net on financial news channels.
From a price point of view I think is a good buy for long time holding as investment plus has a good dividend .
The price is under SMA 200 on weekly chart.
Please feel free to comment with new ideas or critics .
Thank you .
NOK
USDNOK - double top short correctionAfter key risk-event (Norges Bank rate decision) technicals can take over the field at USDNOK cross. NOK is among most undervalued ccys based on trade-weighted fair value models + it seems crude oil is stabilising. From the USD side eco data came in weaker, that might push Fed to take a softer stance on future rate hikes.
NOKJPY: Channel Down approaching the 1W support. Cautious sell.The pair is trading within a 1D Channel Down (RSI = 44.336, MACD = -0.054, B/BP = -0.047) and it has recently priced its Lower High (Highs/Lows = 0.0000). The downside potential for a Lower Low is strong but attention is need as it may be limited by the existence of the 1W support at 12.9720. We are therefore selling for limited profit with TP = 13.1060 (previous Lower Low).
** If you like our free content follow our profile (www.tradingview.com) to get more daily ideas. **
Comments and likes are greatly appreciated.
#WTI #USOIL #USDNOK - Are you looking at this? Watching ThisLooking at the charts, I can see an opportunity to go #long #WTI #USOIL and if you wish #short #USDNOK, these markets have a correlation (not tick for tick), but you could do a play on a weakening dollar, NOK is typically oil pegged currency, it's very volatile, but you can reap rewards IF traded correctly. I am looking for a short-term bounce in #Oil and an opportunity to sell on the rally, in the meantime I am waiting for a break of 52.60 to initiate long to target the $60-$62.
USD/NOK 1H Chart: Previous forecast at workThe previous forecast worked, and the USD/NOK currency pair has reached the resistance cluster formed by the monthly R1 and the weekly R2 in the 8.5565/8.5889 range.
Currently, the pair is testing given resistance. Given that the exchange rate is being supported by the 55-, 100– and 200-hour SMAs, it is expected that the rate goes upwards to the upper boundary of a long-term ascending channel located circa the 8.7500 mark. Technical indicators for both short and long runs also support bullish scenario.
It is the unlikely case that some bearish pressure still prevails in the market, the US Dollar should not exceed the 200-hour SMA, which is currently located at 8.5056.
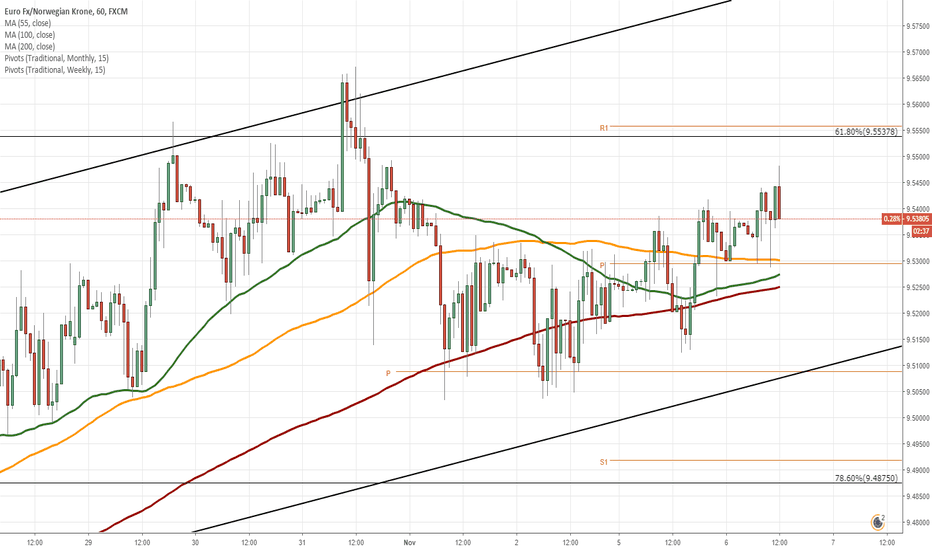
EUR/NOK 1H Chart: Bullish momentum prevailsThe Euro has been appreciating against the Norwegian Krone since the the middle of October. This movement has been bounded in an ascending channel.
Given that the currency pair is supported by the 55-, 100– and 200-hour SMAs, it is likely that the rate continues to go up within the following trading sessions. Technical indicators for the 4H and 1D time frames also support bullish scenario. A potential target is the resistance cluster formed by a combination of the weekly R2, the monthly R1 and the Fibonacci 50.00% retracement located circa 9.6000.
It is the unlikely case that some bearish pressure still prevails in the market, the Euro should not exceed the weekly S2 at 9.4719.
USD/NOK 1H Chart: Upside momentum likelyThe US Dollar has been appreciating against the Norwegian Krone after the currency pair reversed from the lower boundary of a long-term ascending channel located at 8.1500.
Given that the rate is supported by the 55-, 100– and 200-hour SMAs, which currently are located in the 8.2572/8.3650 area, it is likely that an upside momentum prevails during following trading sessions. Technical indicators for the short run also support bullish scenario.
A possible target is the upper channel line at 8.6600 and an important resistance level to look out for is the Fibonacci 61.80% retracement at 8.4861.
Both targets hit. Support test ahead. Short.Both long and short targets hit on NOKSEK as the price made a two-way swing within the Rectangle's 1.09456 Resistance and 1.07445 Support. The 1W Rectangle remains valid (RSI = 56.591, STOCH = 52.647, ADX = 18.466) and we will continue applying a scalping approach, currently on a short aiming at the 1.07445 Support (TP).
USD/NOK 1H Chart: Short-term channel in sightThe US Dollar has been appreciating against the Norwegian Krone since the pair reversed from the lower boundary of a long-term ascending channel located circa 8.1000. This movement is bounded by an ascending channel.
Currently, the pair is trading near the Fibonacci 50.00% retracement at the 8.1825 mark. The exchange rate is supported by the 55-, 100– and 200-hour SMAs. Also, technical indicators flash bullish signals for the 1W time frame. Given these two facts, it is expected that the pair will continue to go upwards to the weekly R2 at 8.2500.
However, this advance might not be immediate and the pair could re-test the lower boundary of the short-term channel.


