NOT coin is at risk of another drop (2H)At the top of the chart, we have a liquidity pool, and behind this pool, there is an interchange zone, which is a supply area. In this zone, we are looking for sell/short positions.
Additionally, below the price, a liquidity pool is currently forming, which is expected to break downward after collecting orders.
Targets are marked on the chart.
The closure of a daily candle above the invalidation level will invalidate this analysis.
For risk management, please don't forget stop loss and capital management
Comment if you have any questions
Thank You
Notusdt

NOT Coin: Poised for a Breakout? Key Resistance Level in FocusGreetings, fellow traders.
While many cryptocurrencies are experiencing upward momentum or consolidating in preparation for potential rallies, Notcoin (NOT) has recently surged 4-5%, reaching a critical daily resistance zone.
Breakout Potential:
This resistance level has proven significant, with NOT having tested and failed to break through it twice this week. A successful breakout above this zone could unlock substantial upside potential.
Long Trade Setup (Conditional):
Entry Trigger: A confirmed close of a 1-hour or 2-hour candle above the current daily resistance is required. Then, initiate a long position when the price of the subsequent candle surpasses the high of the confirming (breakout) candle. This two-step confirmation helps mitigate the risk of a false breakout.
Target 1: $0.003000 - $0.003100
Target 2: $0.003700 - $0.003800
Risk Management:
This is a higher-risk, breakout-based setup. Implement appropriate risk management, including a defined stop-loss strategy, to protect capital in case of a failed breakout.
Disclaimer: This analysis is for informational purposes only and does not constitute financial advice. Conduct thorough due diligence and risk assessment before making any trading decisions.

#NOT/USDT#NOT
The price is moving within a descending channel on the 1-hour frame, adhering well to it, and is on its way to breaking it strongly upwards and retesting it.
We are seeing a bounce from the lower boundary of the descending channel, this support at 0.002280.
We have a downtrend on the RSI indicator that is about to break and retest, supporting the upward trend.
We are looking for stability above the 100 moving average.
Entry price: 0.002390
First target: 0.002556
Second target: 0.002723
Third target: 0.002890

#NOT/USDT#NOT
The price is moving in a descending channel on the 1-hour frame and is adhering to it well and is heading to break it strongly upwards and retest it
We have a bounce from the lower limit of the descending channel, this support is at a price of 0.001811
We have a downtrend on the RSI indicator that is about to break and retest, which supports the rise
We have a trend to stabilize above the moving average 100
Entry price 0.002000
First target 0.002145
Second target 0.002293
Third target 0.002480

Could Notcoin see a 40% drop to $0.0015 soon?Hello and greetings to all the crypto enthusiasts, ✌
All previous targets were nailed ✅! Now, let’s dive into a full analysis of the upcoming price potential for Notcoin 🔍📈.
Notcoin has lost several critical support levels, making it impossible to mark reliable support zones on the chart. As a result, price action is now confined within a range, and the formation of a new parallel channel will create fresh support and resistance areas. I foresee additional downside potential, with a minimum decline of 40%. My main price target for Notcoin is $0.0015, aligning with the next significant support zone.📚🙌
🧨 Our team's main opinion is: 🧨
Notcoin has lost key support levels, and with a new channel forming, I expect at least a 40% drop, targeting $0.0015. 📚🎇
Give me some energy !!
✨We invest hours crafting valuable ideas, and your support means everything—feel free to ask questions in the comments! 😊💬
Cheers, Mad Whale. 🐋

NOT to Buy or NOT to Sell?Well The stances says the latter to be the most prior thing to be done here!

NOTCOINHello friends
As you can see, the price has been very strongly supported by buyers from the support area we have identified, causing a price pump.
Now, in the areas we have identified, you can buy in steps with capital management and move to the specified targets.
*Trade safely with us*

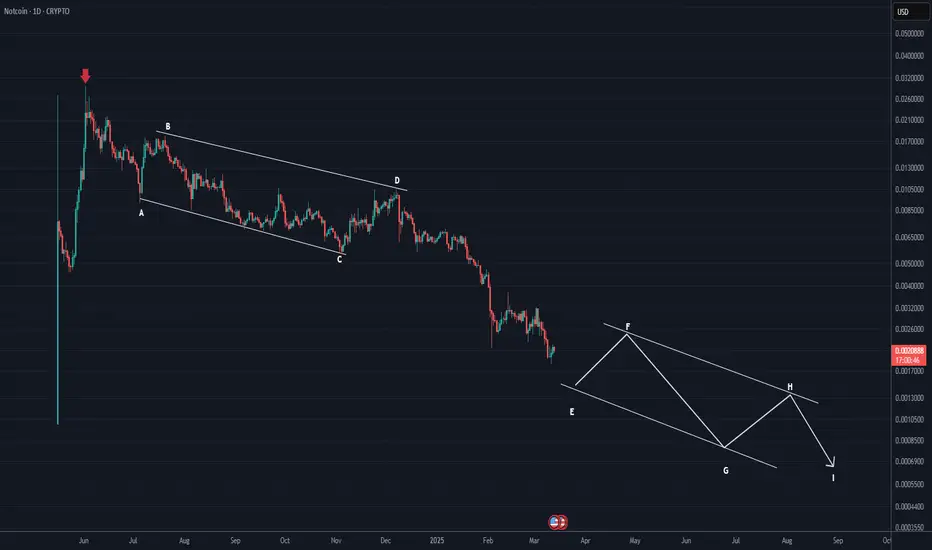
NOTCOIN will remain bearish for a long time (1D)This TON network meme coin seems to have entered a very long correction after its big rally. The correction started from the point where we placed the red arrow on the chart.
The corrective pattern appears to be a large symmetric, and we are currently in its largest wave, which is wave E.
The future path of NOT coin is drawn schematically so you can understand how much time correction and how many waves are left in this pattern.
For risk management, please don't forget stop loss and capital management
Comment if you have any questions
Thank You
TradeCityPro | NOT: Tracing the Decline of a Telegram Titan👋 Welcome to TradeCity Pro!
In this analysis, I will review NOT, one of the Tap-to-Earn projects on Telegram, currently ranked 171 on CoinMarketCap with a market cap of $213 million.
📅 Daily Timeframe
In the daily timeframe, after this coin was listed in May last year, it initially had a strong bullish movement starting from 0.004733, reaching 0.022602, providing significant profits to its early investors.
🎲 However, after this rally, a downtrend started, and in the first bearish leg, the price dropped to 0.010029. In the next leg, the decline continued to 0.005699, where the price consolidated for a long time within a range box between 0.005699 and 0.010029.
✅ With the break of the 0.005699 support, the next bearish leg started. Since there were no further historical supports on the chart, I used the Fibonacci Expansion tool to determine potential support zones. As shown, the key support levels identified were 0.002516 and 0.003382, where the price formed another range box and consolidated for some time.
⚡️ After the break of the 0.002516 low, the price initiated another bearish leg, and the next potential support zones where the price may react are 0.001728 and 0.001071.
🔽 If you already have a short position on this coin, you can wait to see which level the price reacts to before taking profits.
🛒 For those considering buying this coin, I want to make it clear that I personally do not buy this coin in the spot market, and I also do not trade it in futures with my main capital. The reason is that this project lacks strong fundamentals—it was hyped within Telegram, which temporarily attracted liquidity. However, as you can see, this liquidity exited the market, leading to its current decline.
🔼 Nevertheless, if you still want to buy this coin, the first condition is to wait for a trend reversal.For now, the trend reversal confirmation level is the breakout of 0.003382. However, if the price forms higher highs and higher lows and we get Dow Theory confirmation, then a buy entry can be considered.
📝 Final Thoughts
This analysis reflects our opinions and is not financial advice.
Share your thoughts in the comments, and don’t forget to share this analysis with your friends! ❤️

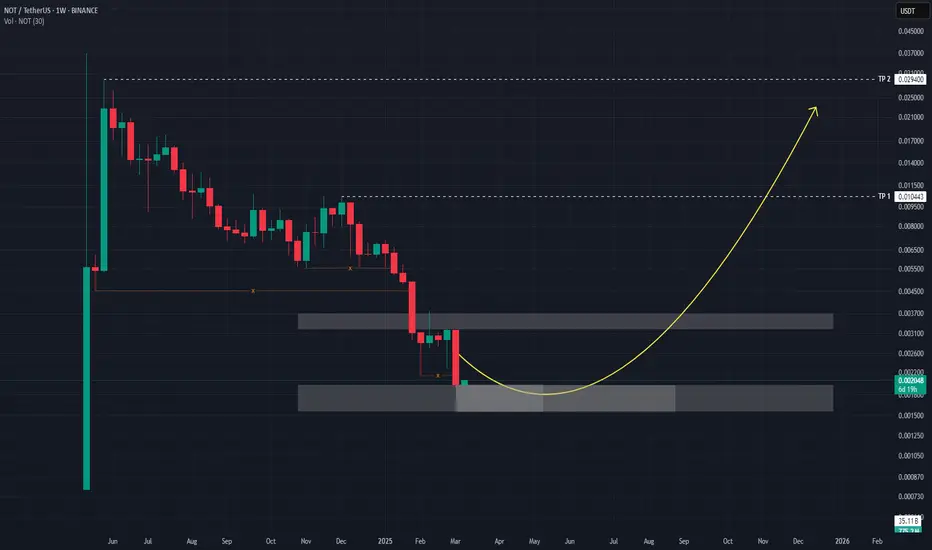
NOTUSDT Weekly Demand Zone: Potential Bullish Reversal at 0.0019This analysis focuses on Notcoin (NOTUSDT) on the Weekly timeframe , identifying a key demand zone that suggests a potential bullish reversal .
Based on chart observation, the price of NOTUSDT is approaching a critical demand zone located between 0.001971 and 0.001561 . This zone is anticipated to act as strong support, potentially marking a significant price low for the asset in the current market cycle.
The expectation is that within this demand zone , buyers will step in with sufficient volume , leading to a change in the current price trend and initiating a bullish reversal . The presence of proper volume upon entering this zone will be crucial to confirm the strength of the demand and the likelihood of a sustainable upward movement.
To illustrate the potential upside, Take Profit (TP) levels have been marked on the chart. These TP levels represent projected targets for the price following a successful bounce from the demand zone. Traders and investors should monitor price action closely as it interacts with this zone, looking for bullish confirmation signals such as:
Increased buying volume: A surge in volume as the price tests the demand zone would indicate strong buyer interest.
Bullish candlestick patterns: Formation of reversal candlestick patterns within the zone (e.g., bullish engulfing, hammer) could further validate the potential for an upward move.
In summary: This analysis suggests that the 0.001971 - 0.001561 zone presents a significant opportunity for a potential bullish reversal in NOTUSDT on the weekly timeframe. Closely monitoring price action and volume within this zone is recommended to identify potential long entry opportunities, targeting the marked Take Profit levels as the asset recovers.
notFriends, if Not wants to break this spell, I think might want to get those waters to go. It's just a guess, we've already said this area is important.


Notcoin Still Trades At Bottom Prices (958% Potential)The Cryptocurrency market is a great market.
The Altcoins are great.
Sometimes we are down and sad, or even mad, because we miss an opportunity that looks great. Here we have Notcoin (NOTUSDT) still trading at bottom prices. How good can it get?
The good news is that the breakout here was really small. We have rising volume. Daily buy volume continues to rise but NOTUSDT is still trading below resistance. The last barrier before a major rise and bullish-run.
When the opportunity is lost, we are sure to rush and even buy after prices are up. When prices are good and down, we tend to be disinterested —this time it can be different.
The way to profit the most from Crypto is not by buying those that already moved up, the best decision is to buy those trading low/near support, before the breakout. We buy and we hold.
A chart like this one looks great if we can have patience and focus on the long-term. Yes, it takes time but the only way to secure a low, bottom, price is by entering when there is no excitement, no hype, and right now this is the best time.
This is a friendly reminder. I don't know how much longer an opportunity like this will be available but it won't be for too long. A few months from now, several years from now, we will look back and see how prices were at this point and notice that it only lasted a few months.
Think of Bitcoin, how long did it trade at $3,500 in March 2020?
For how long did it trade at $17,500 in late 2022?
The time to enter the Cryptocurrency market is now. You will be happy with the results.
Thank you for reading. Notcoin will soon breakout and start to grow.
You can be certain. First Bitcoin and the big projects, and then the rest of the Altcoins.
Bitcoin, Solana, Cardano, XRP and many others moved today. The rest of the market is sure to follow. We are bullish in March 2025 and beyond.
This is the start of the 2025 bull-market.
Namaste.

Notcoin New All-Time Low With Rising Volume (1,095% Growth Pot.)Notcoin (NOTUSDT) is now in a great situation for those looking for Altcoins to load up on in anticipation of the 2025 bull-market. Let me explain.
Notcoin just hit a new All-Time Low on the 3rd of February, 23 days ago. Now, yesterday it hit a higher low. This higher low is the most positive, bullish and revealing signal of all.
The fact that the low yesterday is higher, with rising volume, means that the bearish wave is over.
Let's go over the volume first. NOTUSDT daily trading volume has been increasing, moving higher and higher, which means that more people are participating in the market and buying as prices move lower. More buyers means stronger support and more support means a strong bullish growing phase in the coming months.
Notice the candle 13-Feb. What do you see?
It has really, really high bearish volume and this happened after the ATL. Why is this important? The fact that there was massive selling yet prices remained within a higher low on the succeeding drop means that buyers are too alert; the bulls are ready to play. Even though the bears showed their maximum force they failed to produced a lower low or new All-Time Low. The 3-Feb. low remains the market low.
As the bearish wave ends we get this bullish signal, "rising volume." This is it. We are going up.
It might take a few days, ok, I can give you that, but we all know and have always known that patience is key. Give or take a few days, a few months or a few weeks, nothing can stop what is happening next.
The few months or weeks is just a joke, Notcoin will start to grow within days.
We are bullish in March 2025, massive bullish action, more and beyond.
Feel free to buy and get ready to buy. Accumulate and hold.
Cryptocurrency is going up.
Patience is key. We are set for the biggest bull-market in the history of Cryptocurrency. Just check the good news now, lately. This will soon be reflected on the price and this will mean the best ever.
The fact that the market is flushing now, it means that it is removing all the weak hands. With no weak hands left, there will be such long-term growth next that it is hard to explain.
Get ready for action. We are only a few days away.
Thanks a lot for your continued support. It is truly appreciated.
Namaste.

Notcoin in Descending Channel: 50% Downside Risk to $0.0015Hello and greetings to all the crypto enthusiasts, ✌
In several of my previous analyses, I have accurately identified and hit all of the gain targets. In this analysis, I aim to provide you with a comprehensive overview of the future price potential for Notcoin , 📚💡
The price is currently moving within a descending channel, with the possibility of this channel evolving into a parallel one. There are no notable support levels visible on the chart for Notcoin at this point. Key technical indicators suggest that the downward movement has largely played out, and several support levels above the current price have been broken. We may see a period of consolidation at this price level, but there remains a risk of an additional 50% decline towards 0.0015, with volume patterns in bearish candles potentially signaling further downside.📚🎇
🧨 Our team's main opinion is: 🧨
The price is in a descending channel with no clear support, and while indicators show the downtrend might be over, there’s a risk of a 50% drop to 0.0015, with bearish volume suggesting further decline.
Give me some energy !!
✨We invest countless hours researching opportunities and crafting valuable ideas. Your support means the world to us! If you have any questions, feel free to drop them in the comment box.
Cheers, Mad Whale. 🐋

Prepare for 65% Drop: Notcoin Set to Hit 0.000100Hello and greetings to all the crypto enthusiasts, ✌
In several of my previous analyses, I have accurately identified and hit all of the gain targets. In this analysis, I aim to provide you with a comprehensive overview of the future price potential for Notcoin , 📚💡
There is a strong possibility of a significant price decline from this point within the current robust descending channel, with a potential minimum drop of 65%. This could bring the price back to the level where the initial movement began. To complete the downward phase, we may witness some temporary upward price action towards the trendline. I've outlined this scenario clearly on the chart for your reference. The primary target I foresee is 0.000100, and it is crucial to set an appropriate stop-loss to manage risk effectively.📚🎇
🧨 Our team's main opinion is: 🧨
There's a strong chance of a 65% drop in price within the current downward channel, potentially reaching 0.000100, but be ready for some temporary upward movement near the trendline—make sure to set a stop-loss to protect your investment.
Give me some energy !!
✨We invest countless hours researching opportunities and crafting valuable ideas. Your support means the world to us! If you have any questions, feel free to drop them in the comment box.
Cheers, Mad Whale. 🐋

Notcoin Further Decline Likely, Targeting Price of 0.0024Hello and greetings to all the crypto enthusiasts, ✌
In several of my previous analyses, I have accurately identified and hit all of the gain targets. In this analysis, I aim to provide you with a comprehensive overview of the future price potential for Notcoin , 📚💡
The price is presently trading within a clearly defined descending channel and has broken through nearly all key support levels that were previously in place. This suggests a weakening of the bullish momentum and an increasing likelihood of further downward pressure. Based on the current candlestick patterns and the overall market structure, a continued decline of at least 45% is a realistic possibility. The technical indicators, coupled with the prevailing market sentiment, point toward additional bearish movement. Should these conditions persist, further downside risk remains a significant factor to consider. Given these factors, caution is warranted for any near-term price movements.📚🎇
🧨 Our team's main opinion is: 🧨
The price is in a downward channel and has broken through key support levels, indicating further bearish momentum. With current candlestick patterns and market conditions, a decline of at least 45% seems likely.
Give me some energy !!
✨We invest countless hours researching opportunities and crafting valuable ideas. Your support means the world to us! If you have any questions, feel free to drop them in the comment box.
Cheers, Mad Whale. 🐋

Notcoin analysis: the best support area...hello friends
According to the correction of the price, the price is now in an important support range, which by taking into account the stabilization and not breaking of this support, the price can move up to the specified goals, of course, with capital management...
*Trade safely with us*

NOT daily updatein the chart of #NOT we can see a spike rising first then a down trend to the demand levels i think this coin is only based on technical analysis as there is no fundamental for it so based on that the market should make a good rise !

NOT daily update#NOT daily update :
not made a long term correction after its pumping after its airdrop and this correction is based on the elliot waves so i think the correction is over and the rising as wave 1 after that can confirm that after that made a sharp down spike as wave 2 now we are in the 3rd wave

Not coin is fire !!Not coin currency chart in Time Daily is the best place to enter, be sure to enter because the bull market is very close.

$NOT - Long Trade IdeaGETTEX:NOT | 1D
Notcoin price is currently at a key support level within its most significant demand zone
Buying zone: .0048-.00497
Find acceptance at the previous range .0056, we can see it retesting .0070-.0076
Stop below .0044 (swing low)
Potential targets:
.0070-.0076
.0104-.0123
.0142-.0184

NOT going to EXPLODE !#NOT i was tracking this coin for a long time and i think there should be another down wave for this coin this can happen for 2 reasons 👇👇👇
1) once is that this coin is making the 5th wave of bearish which has and ABC pattern the B wave is made and now we are waiting for the C wave
2) #NOT has a huge mount of liq at the bottom of its chart (as you can see in the chart of coinglass)
for these 2 reasons i think that there should be another wave down and after that the market will explode !
also check out this analysis on not 👇👇👇
