Does History Repeat Itself? How Far Can the Nasdaq Fall?Let's examine the current 2025 correction on a logarithmic chart: the price movements show significant similarities to the February 2020 decline. At that time, the global crisis—then driven by COVID-19 panic—fundamentally influenced market movements, while now, trade uncertainties are generated by President Trump's aggressive tariff announcements.
The chart reveals that the Nasdaq is declining steeply, and technical levels play a decisive role: yesterday, the price bounced back from the 61.8% Fibonacci retracement level. However, it is clear that supporting technical indicators—such as the break of the RSI convergence trend on the days triggering the decline—confirm the downward movement.
In the earlier 2020 decline, massive volume accompanied the initial weeks' movements, while this year's movement is characterized by steadily increasing volume. Nevertheless, the current volume peak falls short of the peak measured in the 2020 week (4.45 million vs. 6.8 million), indicating that the trend may continue with further declines.
Overall, technical analysis—the examination of logarithmic charts, the break of the RSI trend, and volume movements—suggests that the current correction may deepen further, and the Nasdaq's target price can be estimated between 14,500 and 15,000 points.
Observing a similar scenario in history, when global events triggered high volatility, it appears that market reactions now do not differ from past patterns. If the current negative trend continues, a further deepening of the correction is plausible, as the lag in market volume (4.45M vs. 6.8M) indicates that investors have not yet been able to offset the negative sentiment prevailing in the sector.
NASDAQ 100 E-MINI FUTURES
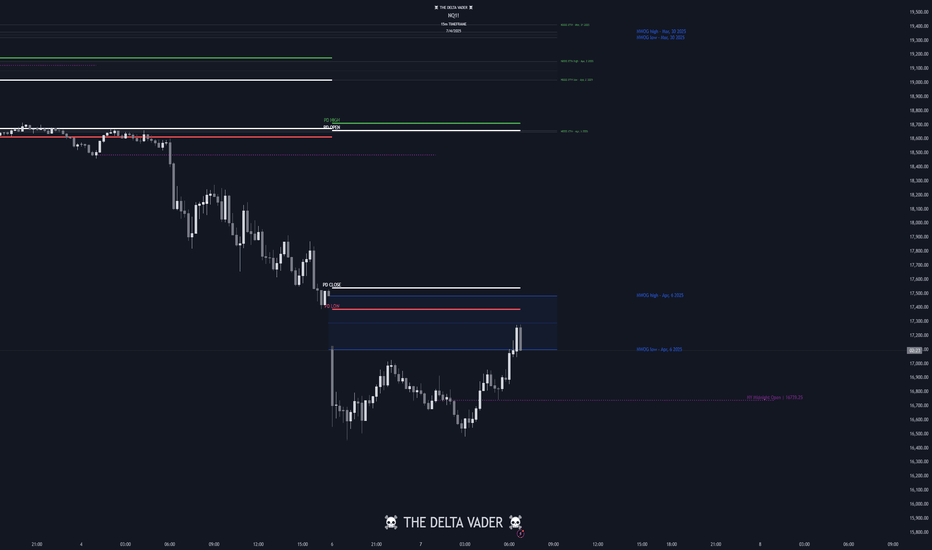
MNQ!/NQ1! Day Trade Plan for 04/10/2025MNQ!/NQ1! Day Trade Plan for 04/10/2025
📈19130
📉18530
Thanks to all my followers! Truly appreciate the support!
Please like and share for more NQ levels Tues & Thurs 🤓📈📉🎯💰
*These levels are derived from comprehensive backtesting and research and a quantitative system demonstrating high accuracy. This statistical foundation suggests that price movements are likely to exceed initial estimates.*
Trade the range until it breaks Nvidia updateThis video is a quick recap on the previous video after the levels I gave produced 30% move to the upside after patiently waiting for the move down to 90$.
So what now is the big question after the unprecedented move we had yesterday .
I outline the next best Short/Long setup and define why I think we stay inside of the range until Earnings Data .
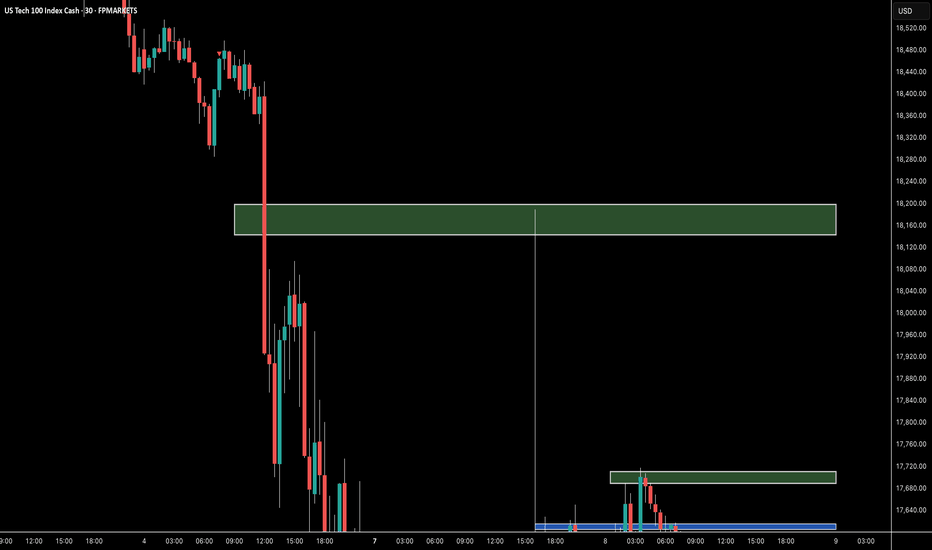
MNQ!/NQ1! Day Trade Plan for 04/08/2025MNQ!/NQ1! Day Trade Plan for 04/08/2025
📈18365
📉17755
Thanks to all my followers! Truly appreciate the support!
Please like and share for more NQ levels Tues & Thurs 🤓📈📉🎯💰
*These levels are derived from comprehensive backtesting and research and a quantitative system demonstrating high accuracy. This statistical foundation suggests that price movements are likely to exceed initial estimates.*
NASDAQ: Cyclical correction most likely completed. ATH by June?Nasdaq remains oversold both on its 1D (RSI = 25.630) and 1W (RSI = 28.851, MACD = -442.980, ADX = 36.399) technical outlook as yesterday's rally is being corrected today on strong technical selling. Long term it looks like this was a cyclical correction, reached -25%, hit the 3W MA50/1W MA200 zone (which has been the best buy entry in the past 10 years) that has most likely been completed. In addition, the 1W RSI is on the same oversold levels as May 16th 2022, the lowest it has been since 2008. According to the Fibonacci Channel Up, the market can hit 22,300 as early as June.
## If you like our free content follow our profile to get more daily ideas. ##
## Comments and likes are greatly appreciated. ##
Nasdaq Enters Correction Territory Do we go Deeper
Monthly analysis done on the NQ with the ambition to connect with current price activity and gauge a deeper technical understanding on if this is just the start of a bigger correction for the year ahead . Tools used in this video Standard Fib , TR Pocket , CVWAP/ PVWAP Incorporating PVWAP and CVWAP into trading strategies allows for a more nuanced understanding of market dynamics used to assess trading performance and market trends.
Date and price range and trend line .
Some research below regarding the previous correction that I reference the technicals to in the video .
In November 2021, the Nasdaq reached record highs
However, concerns over rising inflation, potential interest rate hikes by the Federal Reserve, and supply chain disruptions led to increased market volatility. These factors contributed to a correction in the Nasdaq, with the index experiencing notable declines as investors reassessed valuations, particularly in high-growth technology stocks.
VS Today
March 2025 Correction:
As of March 2025, the Nasdaq Composite has faced another significant correction. On March 10, 2025, the index plummeted by 4%, shedding 728 points, marking its third-worst point loss ever, with only earlier losses during the COVID-19 pandemic surpassing this.
This downturn has been attributed to several factors:
Economic Policies: President Trump's announcement of increased tariffs on Canada, Mexico, and China has unsettled markets, raising fears of a potential recession
Inflation Concerns: Investors are closely monitoring upcoming consumer-price index (CPI) reports to gauge inflation trends, as higher-than-expected inflation could hinder the Federal Reserve's ability to lower interest rates, exacerbating stock market declines
Sector-Specific Declines: Major technology companies, including Tesla, have experienced significant stock price declines, contributing to the overall downturn in the Nasdaq
Comparison of the Two Corrections:
Catalysts: The November 2021 correction was primarily driven by concerns over rising inflation and potential interest rate hikes. In contrast, the March 2025 correction has been influenced by geopolitical factors, including new tariff announcements, and ongoing inflation concerns.
Magnitude: While both corrections were significant, the March 2025 correction has been more severe in terms of single-day point losses. The 4% drop on March 10, 2025, resulted in a loss of 728 points, marking it as one of the most substantial declines in the index's history.
Investor Sentiment: Both periods saw increased market volatility and a shift towards risk aversion. However, the recent correction has been accompanied by heightened fears of a potential recession, partly due to inconsistent government messaging regarding economic prospects.
In summary, while both corrections were driven by concerns over inflation and economic policies, the March 2025 correction has been more pronounced, with additional factors such as new tariffs and recession fears playing a significant role.
NASDAQ Black Monday or a Massive Rally??Nasdaq (NDX) opened on early Monday futures trade below both its August 05 2024 and April 19 2024 Lows. All technical Supports have been broken and the market made new 12-month Lows. The market sentiment is extremely bearish, technically oversold, even the 1W RSI is below the 30.00 oversold barrier and the prevailing fundamentals regarding the back-and-forth Tariffs between nations don't leave much room for encouragement.
The index is more than -25% off the February 17 2025 All Time High (ATH), technically Bear Market territory, and the last time it dropped more this fast is during the lockdowns of the COVID crash (February 20 - March 23 2020). The market dropped by -32%, below also all known technical Supports (including its August low) before finding support and forming a bottom just above the 1W MA200 (red trend-line).
The two time events are virtually identical with the only notable difference is that Nasdaq is about to form the 1D Death Cross now while in 2020 it did about 1 month after the low.
The only technical development that leaves room for encouragement is that the 1W RSI during COVID got oversold just a day before the eventual market bottom.
Does today's 1W RSI drop into oversold territory mean that we are about to form a bottom? Unknown. But what we do know is that on March 03 and 16 2020 on two urgent, out-of-schedule meetings, the Fed stepped in to save the market from the free-fall (and save they did) by cutting the Interest Rates to near zero (first to 1.25% and then to 0.25% subsequently from 1.75% previously).
Perhaps that is the only thing that can restore investor confidence (certainly the only action that the Fed can do) and avoid a Black Monday below the 1W MA200, which would be catastrophic. On the other hand, if the U.S. government reach indeed trade deals with the rest of nations and the Fed do what they can from their end, we may even hit new ATH by August!
So what do you think it's going to be? Black Monday or Massive Rally?
-------------------------------------------------------------------------------
** Please LIKE 👍, FOLLOW ✅, SHARE 🙌 and COMMENT ✍ if you enjoy this idea! Also share your ideas and charts in the comments section below! This is best way to keep it relevant, support us, keep the content here free and allow the idea to reach as many people as possible. **
-------------------------------------------------------------------------------
💸💸💸💸💸💸
👇 👇 👇 👇 👇 👇
NQ! Short Idea (MXMM, Quarterly Theory)Hello, after 2 successful weeks I'm planning to continue this streak. Current WR is 75%.
After taking a quick Short on NQ, I'll be waiting for the NY Session for my next setup. I'm expecting a BSL Sweep at around 9:30 UTC-4, after that I will wait for the Macros 9:50 to enter Short.
Praise be to God
-T-
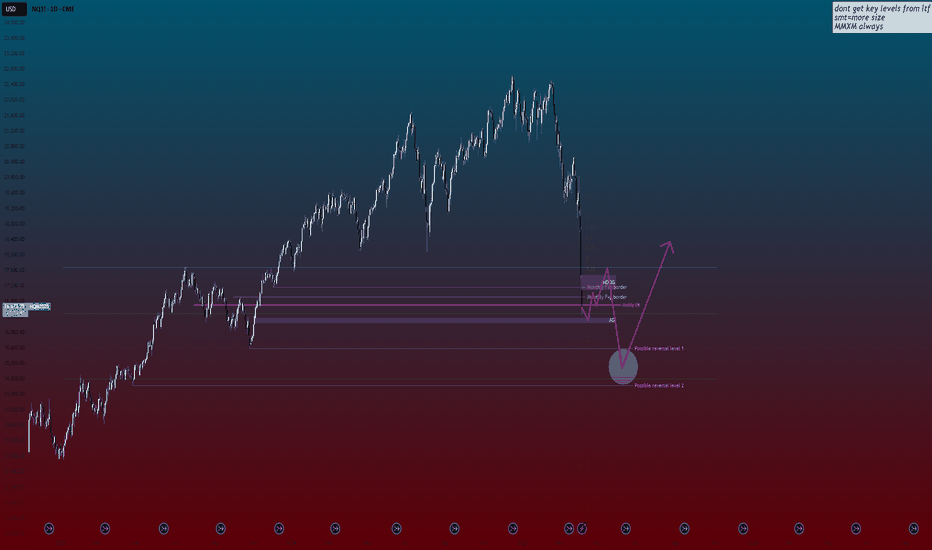
When will NASDAQ stop melting? You can't say I didn't warn you!I hate to say I told you but I warned about this crash at my analysis back at September 2024 for NQ1! (you can see it at related ideas below), anticipating market moves based on structure well before the narrative around election and tariffs even began circulating.
We often see markets engineer these kinds of dramatic dives below obvious lows. This projection towards the 4.0-5.0 zone looks characteristic of such a liquidity hunt, designed to clear out sell-side stops and shake out traders before a potential major move higher – a dynamic not unlike what we anticipated previously.
While the projected sharp drop on NQ1! below key levels like the Monthly Order Block near 3.0 and the AG (actual gap) level near 3.5 might look aggressively bearish, I'm viewing this as a potential setup for a significant buy opportunity.
My attention is focused on that "Possible reversal level 1" between 4.0 and 5.0. If price stabilizes and shows rejection signs within this zone, it could signal the start of a powerful rally, potentially targeting levels back up towards the 1.75 area or even revisiting prior highs.
Remember, these market structure plays can take time to fully develop, just as previous setups did. We could see NQ consolidate or even briefly dip lower within that 4.0-5.0 zone before the anticipated upward reversal truly gains traction.
Thanks for reading, boost and follow to stay liquid and not become liquidity.
Wish you safe and informed trading decisions.
___________
CME_MINI:NQ1! TVC:VIX
Weekly Market Forecast: Short Term Buys, Then Sells! In this video, we will analyze the S&P 500, NASDAQ, AND DOW JONES Futures for the week of April 7 - 11th.
The Stock Market Indices may find support at current levels for a Bear Market Rally. Wait for the market structure shift to the upside before taking any buys. Let the market confirm it's intended direction first, then look for valid buy setups for a short term countertrend play.
Enjoy!
May profits be upon you.
Leave any questions or comments in the comment section.
I appreciate any feedback from my viewers!
Like and/or subscribe if you want more accurate analysis.
Thank you so much!
Disclaimer:
I do not provide personal investment advice and I am not a qualified licensed investment advisor.
All information found here, including any ideas, opinions, views, predictions, forecasts, commentaries, suggestions, expressed or implied herein, are for informational, entertainment or educational purposes only and should not be construed as personal investment advice. While the information provided is believed to be accurate, it may include errors or inaccuracies.
I will not and cannot be held liable for any actions you take as a result of anything you read here.
Conduct your own due diligence, or consult a licensed financial advisor or broker before making any and all investment decisions. Any investments, trades, speculations, or decisions made on the basis of any information found on this channel, expressed or implied herein, are committed at your own risk, financial or otherwise.
2022 NQ Bear Market Fractal scenarios Index has declined more than 20% and we've failed RSI 40 on weekly, indicating a bear market has started. Best case scenario, I could see it bottoming around 16,666/15000 and recovering very quickly with a blow-off top +100% in less than a year, similar to 2000, topping around 30k-33k.
Bear markets typically last 3M-3Y, with most ending in a year or less. This one topped mid Q1, so mid Q2, Mid-May, might be a great time to buy, if only for a few weeks. Bottoming there after 3M would fit close to orange pattern, or stretch it 3M to bottom mid Q3, October.
Green pattern is the only 1:1 with 2022 top to present, with a bottom around 1Yr and then blue and green are steeper variation bottoming a little later, mid 3Y.
Pink is more of a 2000 top with 3Y bear market, but would just be a recession.
Red is worst case scenario; great depression followed by rapid hyperinflation that sends markets screaming with exponential gains just to outrun inflation.
You can stretch the scales on idea to zoom in and out and see the patterns better, or try drawing your own.
Linked are my ideas from 2022 top. There is more confirming TA, but removed for clarity on an already busy chart.
QQQ: Tariff ReactionNASDAQ:QQQ As China strikes back with a 34% tariff on U.S. goods starting April 10, the global trade landscape could see some serious turbulence. This follows Trump's tariff moves, and the market's already feeling it: QQQ’s daily chart shows capitulation volume on the table, suggesting a potential bounce— IF tariffs ease.
But until these trade tensions subside, it's likely to be a rocky ride. Tariffs push prices up, inflation lingers, and the Fed finds itself boxed in. The outcome? A market crash, recession, and stagflation—yet, there's still hope for a bounce, depending on how these factors play out.
Manage the levels with us at ChartsCoach.
NASDAQ tanking! Do the right thing and CUT RATES NOW Jerome!The market is collapsing, China is retaliating with 34% tariffs and Powell is making jokes!
Well that pretty much sums up the market news since yesterday, with Nasdaq / US100 having the worst day since the COVID crash 5 years ago while President Trump shouting 'the market is going to boom'.
Today China imposed 34% reciprocal tariffs on imports of U.S. goods and the worst of all.. Jerome Powell on his speech a little earlier was making jokes about his purple tie, avoiding to address the elephant in the room and take action!
Nasdaq is testing the August 5th 2024 Low, having crossed even under the 1week MA100 for the first time since May 15th 2023! At the same time the 1week RSI just got oversold at 30.00.
Reminds you of something? Yes that's right the last time Nasdaq broke under its 1week MA100 that fast and got oversold on its 1week RSI was on the week of March 16th 2020: YES the COVID crash.
What happened then? Well dear old Fed stepped up, did what they HAD to and cut rates to near zero (0.25%).
Even President Trump tweeted just a few hours ago that Powell should cut rates now and stop playing politics!
Tariffs are in place and they will pay off very well in the long term. On the shorter term, it is in Powell's hands save the economy.
-- Do the right thing and finally CUT THE RATES Jerome! --
Follow us, like the idea and leave a comment below!!
NQ! Short Idea (MXMM, Quarterly Theory)Dear Traders,
today I present you once again my current idea on the Nasdaq. We have swept a High Liquidity Area marked as my lower HTF PDA. Because of that we might see a stronger Pullback as shown on my Chart.
However, I will still keep my eyes open and wait for the 9:30 (UTC-4) Manipulation to look for a Market Maker Sell Model which I will only consider a after a Pullback into my Key Areas and Price Action showing interests of a bearish continuation.
(09:30 Manipulation, Liquidity Sweep + SMT Divergence, Break Of Structure, Any PD-Array)
Praise be to God
-T-
Double Bullish Divergence Flashing on $SPY and $QQQWe’re spotting a double bullish divergence across two major indices: the S&P 500 ( AMEX:SPY ) and the NASDAQ 100 ( NASDAQ:QQQ ).
On both daily charts:
Price is making lower lows, signaling continued downward pressure.
Meanwhile, the RSI is forming higher lows, revealing a potential loss of bearish momentum.
This kind of setup often precedes a trend reversal or strong relief bounce, especially when observed across multiple indices at once. The fact that both AMEX:SPY and NASDAQ:QQQ are flashing the same signal gives added confluence and strength to this potential move.
Divergence = a potential bullish signal
Watch for confirmation: break of previous highs or strong bullish candles.
Caution: divergences don’t always play out — wait for confirmation before going long.
Are we looking at the bottom forming? 👀
Stay alert. A shift in sentiment could be underway.


