"NASDAQ 100: THE TECH ROBBERY! – Quick Profits Before Reversal?"🔥 "The NDX NASDAQ 100 INDEX Heist: Bullish Loot & Escape Before the Trap!" 🔥
🌟 Hi! Hola! Ola! Bonjour! Hallo! Marhaba! 🌟
Dear Money Makers & Market Robbers, 🤑💰💸✈️
Based on the 🔥Thief Trading Style🔥 (technical + fundamental analysis), here’s our master plan to heist the NDX - NASDAQ 100 INDEX. Follow the strategy on the chart—long entry is the play! Aim to escape near the high-risk RED Zone (overbought, consolidation, potential reversal). The bears are lurking, so take profits and treat yourself—you’ve earned it! 💪🏆🎉
🚀Entry (The Vault is Open!)
"Swipe the bullish loot at any price!"
For precision, place buy limit orders within 15-30min timeframe (recent swing lows/highs).
Set alerts! Don’t miss the heist.
🛑 Stop Loss (Safety Net)
Thief-style SL at nearest swing low (4H timeframe) → 21,000.00 (adjust based on risk/lot size).
🏴☠️ Target 🎯: 22,800.00
Bullish momentum is fueling this heist—ride the wave but exit before the trap!
📰 Fundamental Backing (Why This Heist Works)
Macroeconomic trends, COT data, geopolitics, and sentiment align for bullish moves.
Full analysis? Check our bio0 linkk! 👉🔗🌎
⚠️ Trading Alerts (News & Risk Mgmt)
Avoid new trades during high-impact news (volatility = danger).
Use trailing stops to lock profits and dodge sudden reversals.
💥 Boost This Heist!
Hit 👍 (Boost Button) to strengthen our robbery squad!
More heists = More profits—stay tuned for the next steal! 🚀🤑
See you soon, fellow thieves! 🤝🎉
NASDAQ 100 E-MINI FUTURES

NASDAQ 100 TECH HEIST: Bullish Loot Before the Bear Trap!🚨 E-MINI NASDAQ 100 HEIST: Tech Rally or Bear Trap? (Thief Trading Blueprint) 🚨
🌟 Hola! Oi! Bonjour! Hallo! Salam! 🌟
Attention all Market Bandits & Tech Raiders! 🏴☠️💻💰
🔥 Thief Trading Intel: We're targeting the E-MINI NASDAQ 100 for a bullish loot grab! Long entry only—high-risk Red Zone ahead: overbought, consolidating, and primed for a reversal. Don’t let the bears ambush your profits!
"Claim your tech treasure and run—you’ve earned this steal!" 💰🚀
🚪 ENTRY: The Tech Vault is Open!
📈 "Swipe bullish loot at any price—the heist is LIVE!"
Buy Limit orders at recent swing lows/highs (15-30 min TF).
📌 Pro Thief Move: SET ALERTS! Don’t miss the breakout.
🛑 STOP LOSS: Escape Plan
📍 Thief SL (Smart Crew): Recent swing low (20,700.00, 4H TF).
📍 Adjust based on your risk, lot size, and orders.
🎯 TARGET: Loot & Exit!
🎯 22,600.00 (or bail early if the market flips!)
⚡ SCALPERS’ QUICK HIT
👀 Long scalps ONLY!
Deep pockets? Raid now.
Light wallet? Join swing traders.
Trailing SL = Your Profit Shield! 🛡️
📢 WHY THIS HEIST? (NASDAQ Bullish Momentum)
Tech rally brewing! Key drivers:
Fundamentals (COT, Macro, Geopolitics)
Sentiment & Intermarket Trends
Index-Specific Analysis & Positioning
🔗 Full intel? Bio linkss checkk! 👉🏻👉🏻👉🏻
⚠️ WARNING: News = Danger Zone! 📡🚨
Tech news moves FAST! Protect your loot:
❌ Avoid new trades during news.
🔒 Trailing SL = Lock profits.
💖 SUPPORT THE TECH HEIST CREW!
💥 SMASH THAT BOOST BUTTON! 💥
More boosts = bigger future heists!
Stronger crew = more $$$ for all!
Profit daily with Thief Trading Style! 📈🏆
Next tech raid coming soon—stay tuned! 🖥️🤑

US100 (NASDAQ) BREAKOUT BLUEPRINT: LOOT LIKE A SMART TRADER!🔥 NASDAQ 100 HEIST: STEAL THE TREND LIKE A MARKET BANDIT! 🚨💰
Locked & loaded for the US100 (NASDAQ 100) heist? This slick blueprint cracks the code to loot profits—blending killer technicals with macro intel. Ride the bullish wave, but dodge traps near the Overbought Zone. Bears lurk, so secure your bag before the reversal hits! 🐻💨
🎯 ENTRY: STRIKE LIKE A PRO THIEF
Long the breakout near 21,500.0 (or ambush pullbacks at 20,400.0 & 19600.0).
Set stealth alerts to catch moves in real-time. 🕶️🔔
🛡️ STOP LOSS: ESCAPE ALIVE
Hide stops under the last 4H swing low/wick—no reckless bets!
Adjust for your risk—survivors play smart. ⚡
💸 TAKE PROFIT: VANISH WITH THE LOOT
Main Target: 22,250.0 (or bail early if momentum fades).
Scalpers: Trail stops & ghost out with quick wins. 🏃♂️💨
📡 WHY THIS HEIST WORKS
NASDAQ 100’s on fire: Fundamentals + COT data + macro tides align.
Sentiment’s bullish, but stay sharp—links below for the full intel. 🔍🌐
⚠️ WARNING: NEWS = POLICE SIRENS
Avoid new trades during high-impact news. 📢
Lock profits with trailing stops if you’re already in. 🔐
🤝 JOIN THE TRADING MAFIA
Smash LIKE, drop a comment, & let’s dominate the US100! �
Ready for the next big move? Stay tuned. 👀
Happy hunting, chart pirates! 🏴☠️📉

Nasdaq: At the Upper EdgeYesterday, the Nasdaq climbed above resistance at 22,475 points. Currently, the index is positioned outside our turquoise Target Zone (coordinates: 21,751 – 22,425 points), which remains active. Stops for short positions 1% above the zone have not yet been triggered. Our primary scenario remains intact for now: technically, there is room for wave B to reach the next resistance at 23,229 points. Following the B-wave peak, a downtrend is expected with the corrective wave C. With a 42% probability, we anticipate that wave alt.(4) is already complete, and the index may break directly higher within the magenta-colored wave alt.(5), surpassing the 23,229-point mark.
📈 Over 190 precise analyses, clear entry points, and defined Target Zones - that's what we do.

Automating Your Trading Pipeline: Series Overview
Hello fellow traders!
Over the next week I’ll be rolling out a short series on how to take your TradingView alerts all the way through to live orders—fully automated—using AWS and the Tradovate API.
Today’s post is just the big-picture overview. In the days ahead we’ll peel back the layers and show you exactly how each piece fits together:
TradingView PineScript Alerts: how to craft alert payloads in Pine.
AWS API Gateway web-hook: receiving and validating your alerts.
AWS Lambda Python – processing payloads & calculating SL and TP.
Tradovate REST API – placing bracket (OCO) orders.
Telegram Notifications – real-time trade confirmations to your phone.
At the end of this series you’ll have a fully-automated end-to-end pipeline, no more manual order entry!
Stay tuned for Part 2 , when we’ll dive into crafting precise JSON alerts in PineScript.

NASDAQ: Short-lived pullback ahead of major breakout.Nasdaq has entered strong bullish territory on its 1D technical outlook (RSI = 66.290, MACD = 331.080, ADX = 18.600). Despite that, it remains inside a slow moving Channel Up for the past month in contrast to the more aggressive bullish waves of the Channel Up in April and May. The 4H RSI peak may be similar to May 12th and April 24th. We believe that at least a +9.69% rally will emerge to approach the top of this 3 month Channel Up. Stay bullish, TP = 23,400.
## If you like our free content follow our profile to get more daily ideas. ##
## Comments and likes are greatly appreciated. ##


NASDAQ Will the 4H MA200 support the Channel Up?Nasdaq (NDX) has been trading within a Channel Up since mid-May and today almost touched the pattern's bottom, making a Higher Low. At the same time, the 4H MA200 (orange trend-line) is right below it, the medium-term's natural Support.
Since the 4H RSI also bounced on the 32.20 Support, which is where the pattern bottomed on May 23, we expect the new Bullish Leg to start, as long as of course the 4H MA200 holds. The Target is the 1.382 Fibonacci extension at 22300.
-------------------------------------------------------------------------------
** Please LIKE 👍, FOLLOW ✅, SHARE 🙌 and COMMENT ✍ if you enjoy this idea! Also share your ideas and charts in the comments section below! This is best way to keep it relevant, support us, keep the content here free and allow the idea to reach as many people as possible. **
-------------------------------------------------------------------------------
Disclosure: I am part of Trade Nation's Influencer program and receive a monthly fee for using their TradingView charts in my analysis.
💸💸💸💸💸💸
👇 👇 👇 👇 👇 👇

Weekly Market Forecast: Wait To Buy S&P, NAS, & OIL!In this Weekly Market Forecast, we will analyze the S&P 500, NASDAQ, DOW JONES, Gold and Silver futures, for the week of June 22-28th.
The tensions in the Middle East take center stage, as Iran has signaled they are willing to discuss limitations on there Uranium enrichment program. This could allow outflows from safe havens and inflows to risk assets.
Keep and eye on Silver for shorts, in the near term, though.
Let's see if the market tilts its hand early next week. Monday should bring clarity.
Wait for confirmations before entering trades. A break of structure would be ideal! Enter on the pullback to that structure point.
Enjoy!
May profits be upon you.
Leave any questions or comments in the comment section.
I appreciate any feedback from my viewers!
Like and/or subscribe if you want more accurate analysis.
Thank you so much!
Disclaimer:
I do not provide personal investment advice and I am not a qualified licensed investment advisor.
All information found here, including any ideas, opinions, views, predictions, forecasts, commentaries, suggestions, expressed or implied herein, are for informational, entertainment or educational purposes only and should not be construed as personal investment advice. While the information provided is believed to be accurate, it may include errors or inaccuracies.
I will not and cannot be held liable for any actions you take as a result of anything you read here.
Conduct your own due diligence, or consult a licensed financial advisor or broker before making any and all investment decisions. Any investments, trades, speculations, or decisions made on the basis of any information found on this channel, expressed or implied herein, are committed at your own risk, financial or otherwise.

Missiles Flying! Buy OIL, GOLD! Sell the Stock Indices!In this Weekly Market Forecast, we will analyze the S&P 500, NASDAQ, DOW JONES, Gold and Silver futures, for the week of June 22-28th.
This is a revision of the Weekly Forecast I posted yesterday! With the latest US strikes into Iran nuke sites, the fundamentals go from zero to a hundred! Risk on turns immediately to risk off, and gap opens are likely to present themselves.
Look to long the safe havens and short the equities until tensions ease.
Enjoy!
May profits be upon you.
Leave any questions or comments in the comment section.
I appreciate any feedback from my viewers!
Like and/or subscribe if you want more accurate analysis.
Thank you so much!
Disclaimer:
I do not provide personal investment advice and I am not a qualified licensed investment advisor.
All information found here, including any ideas, opinions, views, predictions, forecasts, commentaries, suggestions, expressed or implied herein, are for informational, entertainment or educational purposes only and should not be construed as personal investment advice. While the information provided is believed to be accurate, it may include errors or inaccuracies.
I will not and cannot be held liable for any actions you take as a result of anything you read here.
Conduct your own due diligence, or consult a licensed financial advisor or broker before making any and all investment decisions. Any investments, trades, speculations, or decisions made on the basis of any information found on this channel, expressed or implied herein, are committed at your own risk, financial or otherwise.

NASDAQ Long-term looks brighter than ever!Nasdaq (NDX) has been trading within a massive Channel Up since the bottom of the 2008 U.S. Housing Crisis and during the April 07 2025 bottom, a very distinct bullish signal emerged.
The index hit its 3W MA50 (blue trend-line) for the first time since May 2023. As you can see, since the 2008 Crisis, every time the market rebounded after hitting the 3W MA50, it posted a rise of at least +62.06% before the next time it touched it (and that was on the highly irregular COVID crash).
As a result, we expect to see NDX hit at least 26500 (+62.06%) before a new 3W MA50 test. Chances are we see the market move much higher though.
Note also the incredible bounce it made on the 3W RSI 14-year Support Zone.
-------------------------------------------------------------------------------
** Please LIKE 👍, FOLLOW ✅, SHARE 🙌 and COMMENT ✍ if you enjoy this idea! Also share your ideas and charts in the comments section below! This is best way to keep it relevant, support us, keep the content here free and allow the idea to reach as many people as possible. **
-------------------------------------------------------------------------------
💸💸💸💸💸💸
👇 👇 👇 👇 👇 👇

E mini Nasdaq 100. 20.06.2025, Thursday [Day after FOMC]Clean delivery after FOMC. Massive meltdown on NQ.

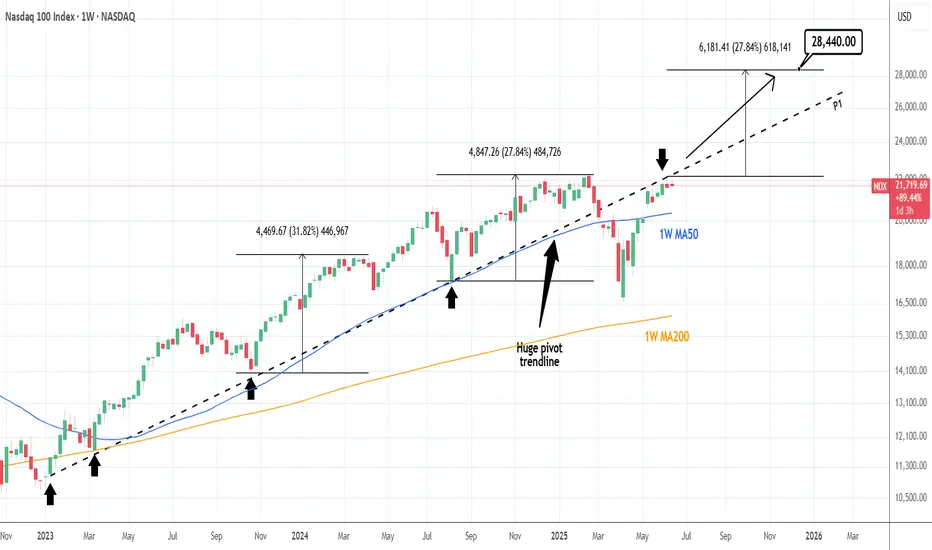
NASDAQ: Huge pivot can catapult it if broken.Nasdaq has turned neutral again on its 1D technical outlook (RSI = 54.712, MACD = 377..560, ADX = 20.644) as it has been struggling to cross above a hidden trendline, the Pivot P1 that was at the start of this Bull Cycle a support and after the trade war acts now as a resistance. If broken, we anticipate a +27.84% rise at least (TP = 28,440), which may very well be an end of year target.
## If you like our free content follow our profile to get more daily ideas. ##
## Comments and likes are greatly appreciated. ##

FED Day: NQ Futures planCME_MINI:NQ1!
Today is FOMC day; however, there is a larger geopolitical risk looming, along with the trade war and tariffs situation unfolding.
Recently, we have noted inflation moving lower, although it is not yet at the FED’s 2% target. Retail sales fell sharply last month. Tariffs have not yet resulted in inflation so far, partly due to the 90-day pause, and with possible extensions, some deals agreed upon, and a framework for others in place, tariff uncertainty has considerably reduced.
On the contrary, lower energy prices that supported lower inflation have risen due to ongoing geopolitical issues. Risks remain high for elevated energy prices even if supply and sea routes remain unharmed. In our view, this is due to the fragility of the situation and what it would take to turn the ongoing war into the worst possible outcome.
The FED releases their Summary of Economic Projections. Key data points will be inflation and growth projections, along with interest rate projections and any talks about neutral rates and expected cuts, given the bleak global outlook and growth. The FED is otherwise expected to hold rates steady in this meeting.
Given this, and what Chair Powell says in the FOMC press conference, their commitment towards driving inflation lower versus maximum employment, risks on the growth and employment side have started to worsen. If rate cut bets are moved forward or if markets price in more rate cuts than currently priced in, we may see equity index futures make further gains.
NQ futures are coiling; the yearly VPOC has shifted higher, as we explained in our previous analysis.
Today’s meeting may be key for further fuel higher or lower, depending on how it pans out. Market participants are in a wait and see mode. Markets are accepting higher prices and break of balance is key to determine the direction price may be headed in. Until otherwise proven, markets are range bound and mean reverting from June Composite Volume Profile towards monthly VWAP and VPOC.

NASDAQ Close to the 1st 1D Golden Cross in 2 years!Nasdaq (NDX) has been trading within a Channel Up since the December 2022 Low and is currently extending the gains of the latest Bullish Leg.
At the same time it is about to form the first 1D Golden Cross in more than 2 years (since March 08 2023). The last two major Bullish Legs of this pattern, before the previous one was interrupted by the Trade War, were pretty symmetrical, peaking at +49.21% and +47.47% respectively.
If the current one follows the +47.47% 'minimum', we should be expecting Nasdaq to hit 24000 by late Q3.
-------------------------------------------------------------------------------
** Please LIKE 👍, FOLLOW ✅, SHARE 🙌 and COMMENT ✍ if you enjoy this idea! Also share your ideas and charts in the comments section below! This is best way to keep it relevant, support us, keep the content here free and allow the idea to reach as many people as possible. **
-------------------------------------------------------------------------------
Disclosure: I am part of Trade Nation's Influencer program and receive a monthly fee for using their TradingView charts in my analysis.
💸💸💸💸💸💸
👇 👇 👇 👇 👇 👇

Weekly Market Outlook: FOMC, Trade Deals and GeopoliticsIt is a holiday-shortened week, with the majority of markets halting early on Thursday, June 19, 2025, in observance of Juneteenth. See here for holiday trading schedule
Key Themes to Monitor This Week
Geopolitical Risks
Any outside intervention in the ongoing Israel-Iran conflict will likely be seen as a risk-off event by market participants. Despite Friday’s sell-off, markets shrugged off during the Sunday open and overnight sessions.
There are potential risks to trade routes and energy infrastructure, although disruptions seem unlikely at the moment. Amena Bakr at Kpler noted that, so far, there are no signs of disruptions in oil loadings from Iran. Without a supply outage, there is no pressing need for additional barrels to be brought onto the market.
Trade War and Trade Deals
There have been recent developments with the U.S. reaching key trade deal milestones with several countries. The baseline scenario remains optimistic, with expectations for an extension in negotiations and potential reciprocal tariffs for countries failing to reach agreements.
FED Week
This is a key week for U.S. monetary policy, with the FOMC decision, Summary of Economic Projections (SEP), and Chair Powell’s press conference scheduled.
Traders will be closely watching how the Fed’s inflation and growth expectations have evolved, as reflected in the SEP. All eyes will be on the dot plot to note how interest rate expectations have evolved since last quarter. Of note: Will President Trump’s continued calls for rate cuts influence Chair Powell’s tone or guidance?
Expectations for the Week Ahead
NQ futures have continued one-time framing higher, consistently creating higher lows since the week of April 21, 2025. A strong support zone exists below, anchored at the yearly Volume Point of Control (VPOC) and the Anchored VWAP from May 11, 2025, when markets gapped higher.
Key Levels to Watch
• yVAH: 22,690.50
• R2: 22,510
• R1 / Previous Week High: 22,322.50
• May 11 AVWAP: 21,672.25
• yVPOC: 21,660
Scenario 1: Market Grinds Higher but Stays Cautious
Despite several looming risk factors, the market could continue to grind higher. In this scenario, we anticipate a test above the prior week's high, followed by a potential pullback into last week’s range.
Example Trade Idea 1
• Entry: 22,000
• Stop: 21,930
• Target: 22,322
• Risk: 70 pts
• Reward: 322 pts
• Risk-Reward Ratio: 4.6R
Scenario 2: Pullback to Support, Range-Bound Consolidation
If the market pulls back, we expect the yearly VPOC and AVWAP from May 11 to act as key support levels. In this case, price action may remain range-bound within the previous week’s range, forming an inside week.
Example Trade Idea 2
• Entry: 21,672
• Stop: 21,600
• Target: 22,000
• Risk: 72 pts
• Reward: 328 pts
• Risk-Reward Ratio: 4.6R
________________________________________
Glossary
• VPOC: Volume Point of Control
• VA: Value Area
• VAL: Value Area Low
• VAH: Value Area High
• VP: Volume Profile
• AVP: Anchored Volume Profile
• Y: Yearly
• pWk: Previous Week

push up nasdaqwe can see that the market has properly push to the upside, looking for a break of range.
entry is in blue, and correspoinds to daily levels that has shown rejection to the upside.
possible drop in the first minutes, and then a move to the upside.
entry in blue. stop in red and target in green.
HAVE FUN
TSP

BTC update!!Good day traders, here is another update on BTC and I have adjusted my narrative but my overall bias is still remaining bearish…

Buy OIL & GOLD, Sell Stocks Indices When Missiles Are Flying!In this Weekly Market Forecast, we will analyze the S&P 500, NASDAQ, DOW JONES, Gold and Silver futures, for the week of June 16-20th.
When missiles start flying in the Middle East, investors become reactively risk averse. Money goes from stocks to safe havens and oil. That's it. Expect oil prices to rise, Gold to reach new highs, and the equity markets to see more sellers than buyers.
This environment may last a few days or a few weeks. Keep an ear to the news.
Enjoy!
May profits be upon you.
Leave any questions or comments in the comment section.
I appreciate any feedback from my viewers!
Like and/or subscribe if you want more accurate analysis.
Thank you so much!
Disclaimer:
I do not provide personal investment advice and I am not a qualified licensed investment advisor.
All information found here, including any ideas, opinions, views, predictions, forecasts, commentaries, suggestions, expressed or implied herein, are for informational, entertainment or educational purposes only and should not be construed as personal investment advice. While the information provided is believed to be accurate, it may include errors or inaccuracies.
I will not and cannot be held liable for any actions you take as a result of anything you read here.
Conduct your own due diligence, or consult a licensed financial advisor or broker before making any and all investment decisions. Any investments, trades, speculations, or decisions made on the basis of any information found on this channel, expressed or implied herein, are committed at your own risk, financial or otherwise.

Nikkei 225. Tokyo Open Delivery cause of Geopolitical DriversSharing my Tokyo Open model for the daily expansion on Nikkei. Along with Intraday market profiles. And Quarterly Theory

Geopolitical Scenario. Market Outlook during London OpenCovering Gold Dax NQ and other assets with proper reasoning.

Emini Nasdaq 100. CPI. 11.06.2025, WednesdayExpecting major meltdown on the daily. The triad should melt from here on
