Weakness in Bullish momentum. Did we see the top for Nasdaq?Lets look at CAPITALCOM:DXY
Currently with a Bullish structure and slow build up Long.
Seems it is attempting to reach that Monthly Area low.
Bullish Dollar=Bearish Equities....Right?
Well this has not been the case these particular past couple of weeks.
We have not seen with clarity the inverse correlation between DXY and Equities. In fact everything has been manipulated up.
Yes! I wrote manipulated do not get hung up on the word.
Back to Indices.
CME_MINI:NQ1!
CME_MINI:ES1!
CBOT_MINI:YM1!
These have a strong Bullish structure. NQ is showing signs of repricing with this pullback.
-Is it sufficient to slow down current Bullish momentum?
-Is NQ leading the indices in a reversal?
These are all valid questions, yet we do not have enough data to validate either or.
Bearish Equities seasonality could have kicked in.
This is the week of confirmation or at the very least for price to provide some sort of hint.
My targets for NQ providing price action confirms it are either a repricing to 17107.25 or a break of Highs.
-If we take out lows first then I would expect price to rally once again and make another attempt at Highs.
-An attempt at highs at the beginning of the week will look favorable for the Bears salivating over the Volume Void right at 17107.25
Here is a view of Weekly Charts for:
ES
YM
NQ
NASDAQ 100 E-MINI FUTURES

NASDAQ: Channel Up peaked. Correction needed.Nasdaq is forming a new HH at the top of the 1 year Channel Up with the 1W timeframe overbought technically (RSI = 70.596, MACD = 766.660, ADX = 46.154) and the RSI in particular under LH and inside the red Resistance Zone. This is a bearish signal, validation would come upon a 1D MA50 bearish crossing. Our target is the 1D MA100 (TP = 16,850).
## If you like our free content follow our profile to get more daily ideas. ##
## Comments and likes are greatly appreciated. ##


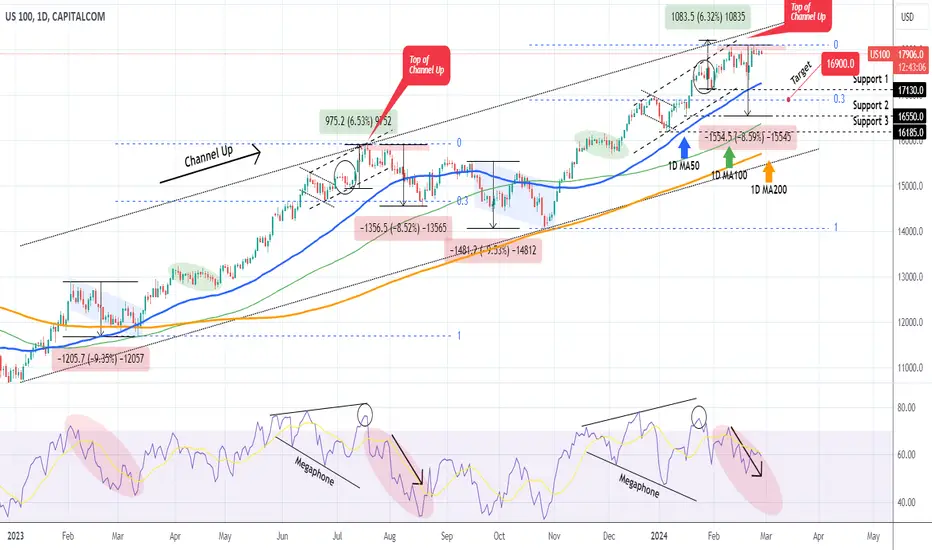
NASDAQ Is this a Double Top? Potential decline to 16900.Nasdaq (NDX) tested and was rejected last Friday on the 18100 Resistance, which was formed by the February 12 High. This is a technical Double Top formation and as long as it holds, there is high probability for the index to start the new Bearish Leg of the 1-year Channel Up pattern.
In fact the recent February 12 High is technically as close of a Higher High for this Channel Up as possible and was formed while the 1D RSI was on Lower Highs since December 19 2023 (Bearish Divergence), similar to the July 18 2023 High. The similarities of the Bullish Leg that started on the October 26 2023 bottom with the previous that formed the July 18 2023 High, are in fact very strong.
As a result, it is very probable to see a symmetrical -8.50% decline towards the 1D MA100 (green trend-line) and the Support 2 level but we keep a shorter-term perspective due to the overall bullish dynamics this year and our short is 'only' targeting the 0.3 Fibonacci retracement level (as with the August 18 2023 Low) at 16900.
-------------------------------------------------------------------------------
** Please LIKE 👍, FOLLOW ✅, SHARE 🙌 and COMMENT ✍ if you enjoy this idea! Also share your ideas and charts in the comments section below! This is best way to keep it relevant, support us, keep the content here free and allow the idea to reach as many people as possible. **
-------------------------------------------------------------------------------
💸💸💸💸💸💸
👇 👇 👇 👇 👇 👇

CAN US100 MAKE A NEW ALL TIME HIGH ?Hello traders .
i think for nasdaq the market is still bullish ,
if the price manages to give a bullish reaction on the area it is likely that it going to give a trend continuation
for bears out there if you wanna sell look for shorts on round numbers / Psycological levels but don't hold for long its agaisnt the trend i think its going to keep going and maybe start possibly reversing on 20.000.
just a personal prediction of mine . according to the relative strenght index the market is making higher high but they are getting weaker and weaker i am thinking at the price 20000 by then the buyers will be tired and we might see a possible correction.

Hyped about the possibilities of NQWhy I'm so hyped?...
We just had a perfect start of a Bullish weekly model. Bearish Mon-Tues. stablishing weekly lows on Tuesday. Next will be the setting of the Weekly highs on Wed-Thursday with the following distribution on Friday if any.
If you look at the NQ chart we went from internal to internal with big boy rejection of that 4H level. Normally under these circumstances price goes from internal to external. Our next external is 18026 about 200 points away from current price.
Now, I do not expect for us to go straight there everyone here knows price does not move like that but the case is being made by several factors
A Weakening Dollar after the Monthly area rejection
A strengthening Bond market - so-so
Strength in the small caps which is usually a good indication of risk on scenarios
Election year (Never discount the power of Big Brother)
Lets see what happens.

NQ1! Supply Demand Zones 2/21/24 - Levels on BOTH sidesChart link: www.tradingview.com
Love the strong push into overnight session, as we are now sitting in a 1HR Supply.
I am keen to see this break to either pivot point R2 (bullish) or R1 (bearish). If we can keep struggling in this zone, I want to see a pull down to retrace the huge drop we faced prior to earnings. There is a long wick off support so the pressure to grab liquidity below is possible.
For Bulls, we need to see continuation through this zone we are in to gather the orders and use as momentum up. I want to see the trend line on the 3HR break and push to the upside. Time of post we are sitting at the 4HR pivot point P, which is like the middle ground. It can literally go either way depending on momentum and news, and where the buyers and sellers want to push.
We are extremely extended off the trend line from the 1HR timeframe and lower, but on the higher timeframes we are close to reaching the upper line for possible break.

NQ! weekly/monthly outlooknow thats the body close candle im anticipating.
external liquidity taken. we can still go up but i will be watching for reversal from here

HL in for NQ?#NQ_F two-legged pullback (an abc correction leg) has been completed. Bouncing off of the 70% retracement + 4H FVG from the beginning of this month. If a HL were to be formed, I believe 17450 is it. Larger time frame second entry long at play.

Market Forecast: The Week Ahead in ES, NQ, RTY, and 10 YRIn this video, I provide an in-depth market forecast for the week ahead in the ES (S&P 500 E-mini), NQ (Nasdaq E-mini), RTY (Russell 2000 Index), and 10 YR (10-Year Treasury Note) markets. I am using a few key technical indicators and market trends to give you valuable insights into potential price movements and trading opportunities.
Indicators used in this video are Bollinger Bands (20,3), Beacon Indicator, Anchored VWAP's, and the 5 day Simple Moving Average.


NQ1! BEARISH BIAS RIGHT NOW| SHORT
Hello,Friends!
NQ1! is making a bullish rebound on the 2H TF and is nearing the resistance line above while we are generally bearish biased on the pair due to our previous 1W candle analysis, thus making a trend-following short a good option for us with the target being the 17861.25 level.
✅LIKE AND COMMENT MY IDEAS✅

NASDAQ: Short term sell initiatedNasdaq is approaching technical neutrality on the 1D timeframe (RSI = 57.511, MACD = 191.510, ADX = 25.356) as it got rejected near the top of a Double Channel Up pattern. The 1D RSI is printing a technical sequence resembling the July 31st 2023 LH, which was the start of a short term correction. Along those lines, we are opening a short, aimed at the 1D MA100 (TP = 16,850).
## If you like our free content follow our profile to get more daily ideas. ##
## Comments and likes are greatly appreciated. ##

FRED has lost control of the train. They are completely stuck.This is why the next 6-12 months in the markets are going to make zero sense.
2020 the FRED not only created money they injected so much unnecessary money that have they not enforced global lockdowns the "2022 mini bubble" would have looked like 2000.
Markets will follow and always adjust to debasement meaning your earnings / your P/E ratios are useless in this environment.
The FRED tried raising rates the fastest in history to front run the M2 Velocity (money changing hands / transacting) but there's still simply too much money created, markets are finding support and have not "corrected" enough to off set lowering rates.
If the FRED does not lower rates look at the red line on chart 2 the Federal government will blow up due to to debt.
There's only one solid choice here, Option 1 "Global bust" meaning governments will default inflation will go negative no GDP growth safety nets will fail.
Option 2 "Global debasement" The FRED starts lowering rates cheap credit will flow into stock markets / gold / bitcoin Money Market Funds will pour back into the markets M2V will go parabolic reigniting a dangerous inflation cycle.
Once that blue box on chart two is broken this means its over. Considering how much of the market is pricing / preparing for a "collapse" yes a collapse will happen but what happens if its the currency debasement and not markets that fall? Correct, you need to re enter all markets.
Lets see how this plays out towards year end.

NASDAQ Can this selling be sustainable?Last week (February 08, see chart below), we gave a sell signal on Nasdaq (NDX) as the the price wasn't just at the top of the short-term (dashed) Channel Up, but was also approaching the top (Higher Highs trend-line) of the 1-year Channel Up:
As the index suffered strong intra-day selling yesterday, following the higher than expected U.S. CPI report (investors initially view this as an excuse for the Fed not to cut rates quickly), it is a good time to update our outlook. In this effort, we will look at it through the shorter term 4H time-frame this time.
As you can see, the price breached yesterday not only the 4H MA50 (blue trend-line) but also the 4H MA100 (green trend-line), which was the first time (for the latter) since January 17, so almost 1 month. This is the first significant bearish signal for the medium-term but the confirmation will come only if a 1D candle closes below it. In that case, we expect the decline to reach first the 4H MA200 (orange trend-line) - 1D MA50 (red trend-line) Support cluster and then after a rebound gets confirmation with a rejection on the 4H MA50 (blue trend-line), target 16550, which is Support 2 and a potential 1D MA100 (yellow trend-line) contact. In that scenario, look also for the 1D RSI breaking below its Support Zone.
On the other hand, since the index is rebounding today and is already on the 4H MA50, we will wait for the daily candle closing. If it is above it (as in the cases of the February 01 and January 09 break-outs), it will most likely suggest that the bullish trend is intact. In that case, we will buy the break-out and target 18400, just below the 1.786 Fibonacci extension, which was the Target of both previous Higher Highs.
-------------------------------------------------------------------------------
** Please LIKE 👍, FOLLOW ✅, SHARE 🙌 and COMMENT ✍ if you enjoy this idea! Also share your ideas and charts in the comments section below! This is best way to keep it relevant, support us, keep the content here free and allow the idea to reach as many people as possible. **
-------------------------------------------------------------------------------
💸💸💸💸💸💸
👇 👇 👇 👇 👇 👇

Nasdaq-100 Index Futures. Bearish Channel In DevelopmentAI-related companies lost $190 billion in stock market value late on Tuesday after Microsoft NASDAQ:MSFT , Alphabet NASDAQ:GOOG and Advanced Micro Devices NASDAQ:AMD delivered quarterly results that failed to impress investors who had sent their stocks soaring.
The selloff following the tech giants' reports after the bell underscored investors' elevated expectations following an AI-fueled stock market rally in recent months that propelled their shares to record highs with the promise of incorporating the technology across the corporate landscape.
Alphabet dropped 5.6% after the Google-parent's December-quarter ad revenue missed expectations.
Alphabet also said its spending on data centers to support its AI plans would jump this year, highlighting the costs of its fierce competition against AI rival Microsoft.
While Google Cloud revenue growth slightly topped Wall Street targets, boosted by interest in AI, Microsoft's Azure grew faster.
Microsoft beat analyst estimates for quarterly revenue as new AI features helped attract customers to its cloud and Windows services. However, its stock fell 0.7% in extended trade after briefly hitting an intra-day record high earlier on Tuesday.
Optimism about AI pushed Microsoft's stock market value above $3 trillion this month, eclipsing Apple NASDAQ:AAPL .
Chipmaker Advanced Micro tumbled 6% after its forecast for first-quarter revenue missed estimates, even as it projected strong sales for its AI processors.
Shares of Nvidia NASDAQ:NVDA , which have surged 27% in January after more than tripling last year on AI optimism, also gave back some of those gain in extended trade, last down over 2%.
Server maker Super Micro Computer NASDAQ:SMCI , another company that has benefited from AI-related demand, dropped over 3%. Earlier on Tuesday, it had climbed to a record high after delivering amazing quarterly results the day before.
The main technical graph for Nasdaq-100 Micro E-Mini Futures CME_MINI:MNQ1! illustrates that bearish channel is in development in this time, where 17800 points is the upper (resistance) side and 17000 points level becomes attractive to watch.
3-months mid-term VIX Futures spread (the difference between front, February, 2024 VIX Futures contract CBOE:VXG2024 and May, 2024 VIX Futures contract CBOE:VXK2024 that is 3 months ahead) still is in Bearish mode, saying there's no panic yet on the streets.
50/200-hours MACD says btw, bearish sentiment becomes more active.

NQ1! Supply Demand Levels 2/8/24Hitting uncharted territory is scary as we don't know the ceiling of this train.
Idea: push into ATHs (pink line) for a stretch into R1 920s area.
If flow and momentum is bulls strong, pullback into 890s and then continue higher. If bears strong, push into 890s for consolidation, before move into lower demand 30m/1hr zone 812s.
First day back into charting after neglecting it! Anything is possible with NQ now with no roof over our heads...


NASDAQ is very close to the top of the 1-year Channel Up! Sell?Nasdaq (NDX) is extending its aggressive rise of the Bullish Leg that started on the October 26 2023 Higher Low of the 1-year Channel Up and by the strength of it, it appears it will extend it to the max. That potential max extension is in the range of 18100 - 18300, which is the top of the dashed Channel Up and the top of the dotted 1-year Channel Up, which was initiated on the market Low of January 06 2023.
A news/ fundamentals based approach could time the bearish reversal after next Tuesday's U.S. CPI report. Technically though, the 1D RSI being on Lower Highs ever since December 19 2023, shows that technically we are already on a strong Bearish Divergence that can reverse any moment. The similarities with the previous Channel Up Higher High on July 18 2023 are striking, with the only exception that the current dashed Channel Up is overextending the 2nd peak.
Regardless of that, the 1D RSI is coming out a similar Megaphone and appears to be on a similar Lower High as July 31 2023. A similar RSI pull-back can be seen from February 02 to March 10 2023, which resulted into a -9.35% decline for Nasdaq. The August 18 2023 decline was translated into a -8.55% decline. As a result, assuming that 18100 is a potential peak for the index, we are targeting a minimum -8.55% decline, which falls directly on Support 2 at 16550. That would break the 1D MA50 (blue trend-line) and make contact with the 1D MA100 (green trend-line).
-------------------------------------------------------------------------------
** Please LIKE 👍, FOLLOW ✅, SHARE 🙌 and COMMENT ✍ if you enjoy this idea! Also share your ideas and charts in the comments section below! This is best way to keep it relevant, support us, keep the content here free and allow the idea to reach as many people as possible. **
-------------------------------------------------------------------------------
💸💸💸💸💸💸
👇 👇 👇 👇 👇 👇

NQ weekly/monthly outlookim anticipating higher prices for a sweep and then a retracement to internal range

NAS100 - EMBARKING ON THE BIGGEST BULLRUN IN HISTORY? Hello Traders, what a week it has been! So I think it is justified to provide you with everything I know and show you how I see things. On the chart you’ll notice an image. The image shows theoretical price action with a parabolic curve step-like formation, representing an idealised pattern in price action trading. The formation begins with Base 1, where the stock starts to show an uptrend, followed by Base 2, indicating continued growth and increased investor interest. Base 3, marked by an "X", signals a critical entry point for traders, as it suggests potential for the stock to double in value rapidly. We are depicted to be at this third phase, which is considered the most opportune moment for entry before the final ascent. Base 4 represents the peak of the trend, culminating in a Sell Point where the stock reaches its maximum and sharply declines, thus completing the pattern.
However, as we gear up for the CPI data release on the 13th of February, be aware that it might steer us into a broad consolidation phase. The market's parabolic trend may not be sustainable given the upcoming figures. Prudence is key here—anticipate potential stabilisation or sideways price action as the market digests the CPI results.
Additionally, watch out for how price reacts to the BOS level. No structure is definite and it's important to adapt to what price is showing us and not to cling to an idea that no longer is valid.
NAS100 Weekly
NAS100 Daily
To add to this NAS100 analysis, I think it’s important to discuss its main components. The "Magnificent Seven" Big Tech stocks, including Nvidia, Apple, and Amazon, have seen varied performance since the pandemic, challenging the notion of them as a homogenous group. The dispersion in their returns and diverse business models highlight the differences within the sector. While Nvidia thrives as an AI specialist and Apple boasts defensive qualities, Amazon combines retail with cloud computing. The sector's valuation spectrum reflects a mix of growth prospects and market expectations, suggesting a nuanced investment landscape rather than a uniform "bubble." This diversity raises questions about the future performance of growth versus value stocks within these leading tech companies.
Apple's revenue grew during the holiday quarter, driven by iPhone sales and a record in services, despite a drop in China sales due to competition and geopolitical issues. The company faces regulatory scrutiny and a patent dispute, but remains optimistic about its product ecosystem and upcoming launches like the Vision Pro headset.
Amazon's stock surged 7.9% following a report of strong holiday sales, boosting its market value by approximately $135bn. CEO Andy Jassy highlighted the company's future focus on AI, projecting AI revenues to reach "tens of billions," further driving optimism for its growth potential.
Alphabet's shares dropped after advertising revenues missed expectations, despite integrating its Gemini AI into various services. The company plans significant investments in AI infrastructure, raising investor concerns about the balance between growth and expenditure in the generative AI race.
Meta's shares soared over 20% after announcing a first-ever dividend and a $50bn increase in share buybacks, signalling recovery from a recent advertising slump. The company plans more investment in AI and the metaverse, despite expecting short-term AI products not to significantly drive 2024 revenue. Full-year expenses are projected to rise notably.
Nvidia's dominance in the AI chip market, essential for technologies like OpenAi's ChatGPT, has driven its significant growth, with the stock more than doubling in value over the past year. This surge contrasts with the broader semiconductor industry's struggles with excess inventory and reduced demand in other sectors. Nvidia's success is partly due to partnerships with major tech firms like Microsoft and Meta, with the latter planning to acquire almost 600,000 high-end Nvidia GPUs for AI research. This focused investment in AI has positioned Nvidia at the forefront of the data centre market, overshadowing traditional leaders like Intel.
Microsoft's shares fluctuate after announcing strong cloud sales integrated with OpenAI's tech, but ended lower due to concerns over high investments in AI infrastructure. Despite a 20% increase in cloud revenues, investors remain cautious about the costs associated with expanding AI capabilities.
Tesla's shares dropped 12% amid warnings of lower sales growth due to reduced demand and increased competition. CEO Elon Musk announced a new lower-cost car for 2025, aiming to regain momentum. Tesla faces challenges from price cuts, higher costs, and a shift in the EV market, impacting its financial performance.
Here’s some economic theory for you, to add some more depth to the analysis. The Federal Reserve's monetary policy, particularly changes in the federal funds rate, has a significant impact on bond yields and, subsequently, stock prices. When the Fed raises interest rates to combat inflation or cool down an overheating economy, bond yields tend to rise as well. Higher bond yields make bonds more attractive relative to stocks, which can lead to a decline in stock prices as investors may shift away from equities. Conversely, when the Fed lowers interest rates to stimulate economic growth, bond yields often decrease, making stocks more appealing, which can boost stock prices. So, Fed rate decisions play a crucial role in influencing the relationship between bond yields and stock prices. In economic theory, bond yields and stock prices exhibit a negative correlation. This is why yield charts matter. Have a look:
The general outlook is that the US Federal Reserve is cautious about cutting rates despite inflation slowing, due to concerns about potential economic growth and inflation resurgence. Market expectations of rate cuts exceed the Fed's projections, but with inflation drivers easing, the case for reducing rates is growing stronger. However, the US job market added 353,000 jobs in January, surpassing the expected 180,000, leading to reduced expectations for a Federal Reserve interest rate cut in March. The strong job growth supports the Fed's cautious stance on rate cuts, despite political pressures. In my opinion, if the US economy continues to show such resilience and the next CPI release is lower than consensus, we might be witnessing the beginning of the largest bull run in history.
In summary, the NAS100's trajectory is at a crossroads with the upcoming CPI data potentially triggering market consolidation, despite the recent parabolic pattern. The diverse performance among Big Tech stocks underscores the need for nuanced analysis. While Federal Reserve policies continue to sway bond yields and stock prices, the strong job market suggests caution in anticipating rate cuts. Keep a close eye on how the NAS100 responds to the interplay of inflation data and tech sector dynamics. Overall, maintain a strategic approach and be ready to adjust to new information as we navigate these complex market conditions. Stay informed, stay agile.
As always, I hope you enjoyed this one and have a great weekend!! ;)

NQ1! BEARS ARE STRONG HERE|SHORT
Hello,Friends!
We are going short on the NQ1! with the target of 17229.00 level, because the pair is overbought and will soon hit the resistance line above. We deduced the overbought condition from the price being near to the upper BB band.However, we should use low risk here because the 1W TF is green and gives us a counter-signal.
✅LIKE AND COMMENT MY IDEAS✅
