NASDAQ About to test the MA50 (1d). Break out and rejection planNasdaq is posting the 3rd bullish leg inside the Channel Down pattern on the 1D time frame.
It is about to hit the MA50 (1d), above which all prior Lower Highs have been priced near the 0.786 Fibonacci level.
The medium term trend remains bearish until this level gets broken.
Trading Plan:
1. Sell on the current market price.
2. Buy if the price crosses over the 0.786 Fibonacci level.
Targets:
1. 14650 (near the 0.382 Fibonacci level, where both Channel top rejections made the first drop).
2. 15330 (Resistance 1 and previous Lower High)
Tips:
1. The MACD (1d) just formed a Bullish Cross. The previous two were formed half way through the rises, so it is possible this one is stronger, hence our bullish break out option.
Please like, follow and comment!!
Notes:
Past trading plan:
NASDAQ 100 E-MINI FUTURES

NQ1! Supply and Demand Levels 11/2Link to chart: www.tradingview.com
Lots of HTF (higher time frame) zones to look out for. Strong bullish move from 14000s to 15000 in a few days.
News events this week are potentially moving the market AND hitting a key support zone within the last week.
If we can push in the upper 4hr supply above 15040 or so, it would be nice to break out of the 4HR downtrend (blue bolded trendline) for a break/retest to go higher. Otherwise, we can potentially break/fail or reject off the 4HR trend.
I forget to post my charts sometimes, since I get too caught in the moment of my trading but I need to make a better effort! The goal is weekly charts, but I prefer to have daily.


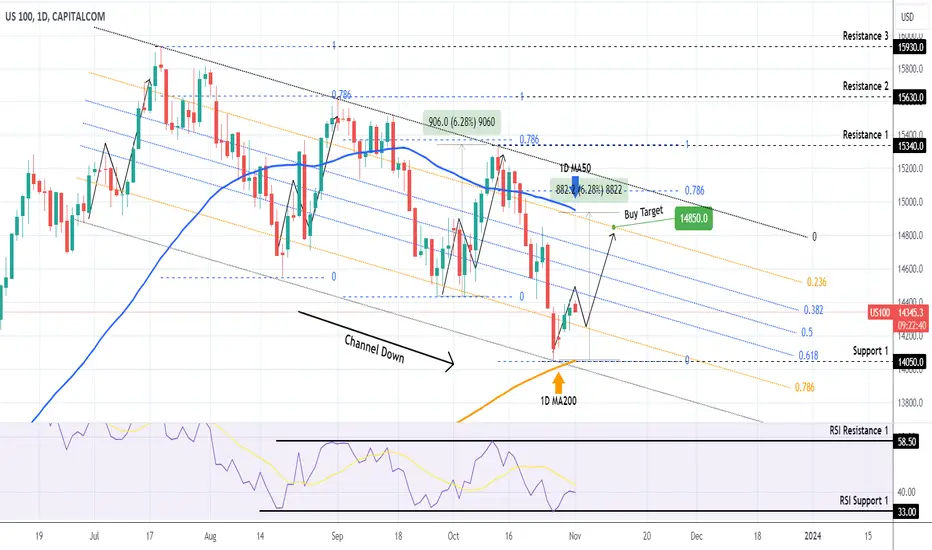
NASDAQ Can it hold the 1D MA200 ahead of the Fed and NFP?Nasdaq (NDX) has a strong rebound near the 1D MA200 (orange trend-line) last week, which formed the latest Lower Low at the bottom of the 3.5 month Channel Down. Ahead of today's Fed Rate Decision and Friday's Nonfarm Payrolls, it is important for investors to see the index holding the 1D MA200 as Support, as it will provide the technical backing for at least a short-term rise.
As long as it does, our target is 14850, which is a level that meets all 4 bullish criteria:
1) Is on the 0.236 Fibonacci Channel level (all previous 3 Channel Down bullish legs hit at least this level).
2) Is on/ below the 1D MA50 (blue trend-line).
3) Is less than +6.28% (which has been the lowest % rise of a bullish leg withi this Channel).
4) Is (quite) below the 0.786 horizontal Fibonacci level (all previous bullish legs almost hit it).
If however the 1D RSI hits the 58.50 level (Resistance 1) before the index hits the 14850 target, we will book the profit earlier, as that RSI Resistance has formed the last 2 Lower Highs of the Channel Down.
-------------------------------------------------------------------------------
** Please LIKE 👍, FOLLOW ✅, SHARE 🙌 and COMMENT ✍ if you enjoy this idea! Also share your ideas and charts in the comments section below! This is best way to keep it relevant, support us, keep the content here free and allow the idea to reach as many people as possible. **
-------------------------------------------------------------------------------
💸💸💸💸💸💸
👇 👇 👇 👇 👇 👇
DCFC f-ing meWelp my average buy in is $0.43, CEO hugged biden or something thought it was a safe punt at $0.70 after 99% draw down lol. Down more then I would like to admit on this one, but still only 5% of trading account....not ideal of course. Lets see what happens. Will sell before year for tax loss. Not Advise, good luck.

NASDAQ Rebounding on the 1D MA200 and targeting 15,000Nasdaq is trading inside a Channel Down since the July High and is naturally on bearish 1D technicals (RSI = 39.169, MACD = -233.06, ADX = 37.454). This is a buy opportunity though as the price is rebounding today after making a LL bottom almost on the 1D MA200. That is a long term Support level, being unbroken since March 13th. The second bottom indication is given by the 1D RSI which hit and bounced from inside the S1 Zone, as both previous bottoms have.
Every rebound rose almost as high as the 0.786 Fibonacci level to make a LH top. Consequently we turn bullish and target that Fib level (TP = 15,000) which is slightly over the 1D MA50.
## If you like our free content follow our profile to get more daily ideas. ##
## Comments and likes are greatly appreciated. ##

Psychology of the market cyclePsychology of the market cycle
And what do you think we're going to do now???


NASDAQ 1day MA200 test after more than 7 months. Huge BUY!!Nasdaq / US100 is trading inside a Channel Down since the July 19th high.
Today the price not only touched the bottom of that Channel but is about to test the 1day MA200 for the first time in more than 7 months.
As the 1day RSI is on the same level as the Channel's previous two Lows, this is technically the best buy opportunity on a quarterly basis.
Buy and target 15000 (top of Channel Down and 0.786 Fibonacci which was where the previous Lower Highs were formed)
Previous chart:
Follow us, like the idea and leave a comment below!!

Nasdaq Bank Index: Putting A Bad Hair Day Into PerspectiveElon Musk still sees danger ahead for the US economy if the Fed does not contain the regional banking crisis.
Financial blog Zero Hedge previously tweeted about the critical role of small and medium-sized banks in the US financial system — a hot topic following the sharp collapse this month of Silicon Valley Bank, a technology startup lender and the first bank to be taken over by regulators since the 2008 financial crisis.
Small and medium banks account for 50% of commercial and industrial lending and 60% of residential real estate lending, among other loans, notes Zero Hedge with accompanying charts.
“If the Fed does not contain the collapse of regional banks, there will be another Great Depression,” it wrote, referring to the economic crisis that lasted from 1929 to 1939.
"This is a serious risk," Musk replied to Zero Hedge.
According to the US Department of Labor, in 1933, at the height of the Great Depression, approximately 25% of the 12.8 million people in the US labor force were unemployed.
This wasn't the first time Musk had intervened on his social media about the collapse of the SVB. Last week, he compared the bank failure to the Wall Street crash of the 1920s that preceded the Great Depression.
"There are a lot of similarities this year with 1929," Tesla CEO said in response to a post from Ark Invest' Cathy Wood.
Nasdaq Bank Index BSE:BANK includes securities of companies listed on the NASDAQ that are classified under the industry classification benchmark as banks.
These include banks that provide a wide range of financial services, including retail banking, loans and money transfers.
On February 5, 1971, the underlying NASDAQ Bank Index was 100 points.

NQ Bull Flag into Demand NQ - Daily - 14350
This is supply and demand to the tee on the NQ daily. You can see 4 days of resistance before price gapped up 580 points before pulling back. We are now retesting this area. After a demand that large, we are bound to see some sort of interest in buying within this area (theoretically).
If we are to bounce on NQ, this is likely the area we'd bounce. Either for a small relief bounce, or a large one. Keep an eye out here tomorrow.

Tech stock Vs Energy stocks. The Competition for Decades This is an education-style publication where the main graph is a comparison (ratio) between two ETFs (funds) managed by State Street Global Advisors Corporation, the creator of the world’s first ETF (well-known in nowadays as AMEX:SPY ) and an indexing pioneer.
The first one ETF is The Technology Select Sector SPDR Fund, AMEX:XLK .
👉 AMEX:XLK seeks to provide investment results that provide an effective representation of the Technology sector of the S&P 500 Index SP:SPX .
👉 AMEX:XLK seeks to provide precise exposure to companies from Technology hardware, storage, and peripherals; software; communications equipment; semiconductors and semiconductor equipment; IT services; and electronic equipment, instruments and components.
👉 AMEX:XLK is a place where securities of American World-known Technology companies like Apple Inc. NASDAQ:AAPL and Microsoft Corp. NASDAQ:MSFT , like Nvidia Corp. NASDAQ:NVDA and American Micro Devices NASDAQ:AMD , like Cisco Systems Inc. NASDAQ:CSCO and Adobe Inc. NASDAQ:ADBE meet together.
👉 In contrast with other Technology-related ETFs like NASDAQ:QQQ (Invesco Nasdaq 100 Index ETF) or NASDAQ:ONEQ (Fidelity Nasdaq Composite Index ETF), stocks allocation in AMEX:XLK depends not only on their market capitalization, but also hugely on Technology industry allocation (like software, technology hardware, storage & peripherals, semiconductors & semiconductor equipment, IT services, communications equipment, electronic equipment instruments & components).
That is why allocation of Top 3 holdings in AMEX:XLK ( Microsoft Corp. NASDAQ:MSFT , Apple Inc. NASDAQ:AAPL and Broadcom Inc. NASDAQ:AVGO ) prevails 50 percent of Funds assets under management.
👉 Typically AMEX:XLK holdings are Growth investing stocks.
The second one ETF is The Energy Select Sector SPDR Fund, AMEX:XLE .
👉 AMEX:XLE seeks to provide investment results that provide an effective representation of the energy sector of the S&P 500 Index SP:SPX .
👉 AMEX:XLE seeks to provide precise exposure to companies in the oil, gas and consumable fuel, energy equipment and services industries.
👉 AMEX:XLE allows investors to take strategic or tactical positions at a more targeted level than traditional style based investing.
👉 AMEX:XLE is a place where stocks of American World-known Oil companies like Exxon Mobil Corp. NYSE:XOM and Chevron Corp. NYSE:CVX , like EOG Resources Corp. NYSE:EOG and ConocoPhillips NYSE:COP , like Valero Energy Corp. NYSE:VLO and Phillips 66 NYSE:PSX meet each other.
👉 Weight of Top 3 holdings in AMEX:XLE (Exxon Mobil Corp. NYSE:XOM , Chevron Corp. NYSE:CVX and EOG Resources Corp. NYSE:EOG ) prevails 45 percent of Funds assets under management.
👉 Typically AMEX:XLE holdings are Value investing stocks.
The main graph represents different stock market stages of work
🔁 Early 2000s, or post Dot-com Bubble stage, that can be characterized as Energy Superiority Era. There were no solid Quantitative Easing and Money printing. U.S. Treasury Bond Interest rates TVC:TNX , TVC:TYX as well as U.S. Federal Funds Rate ECONOMICS:USINTR were huge like nowadays. Crude oil prices TVC:UKOIL , TVC:USOIL jumped as much as $150 per barrel.
The ratio between AMEX:XLK and AMEX:XLE funds collapsed more than in 10 times over this stage.
🔁 Late 2000s to early 2010s, or post Housing Bubble stage, that can be characterized as a Beginning of Quantitative Easing and Money printing. U.S. Treasury Bond Interest rates TVC:TNX , TVC:TYX as well as U.S. Federal Funds Rate ECONOMICS:USINTR turned lower. Bitcoin born.
The ratio between AMEX:XLK and AMEX:XLE funds hit the bottom.
🔁 Late 2010s to early 2020s, or post Brexit stage, that can be characterized as a Continuation of Quantitative Easing and Money printing. U.S. Treasury Bond Interest rates TVC:TNX , TVC:TYX as well as U.S. Federal Funds Rate ECONOMICS:USINTR turned to Zero or so. Crude oil turned to Negative prices in April 2020 while Bitcoin hit almost $70,000 per coin in 2021.
Ben Bernanke (14th Chairman of the Federal Reserve In office since Feb 1, 2006 until Jan 31, 2014) was awarded the 2022 Nobel Memorial Prize in Economic Sciences, jointly with Douglas Diamond and Philip H. Dybvig, "for research on banks and financial crises", "for bank failure research" and more specifically for his analysis of the Great Depression.
The ratio between AMEX:XLK and AMEX:XLE funds becomes great and respectively with monetary stimulus hit the all time high.
🔁 Early 2020s, or post Covid-19 Bubble stage, that specifically repeats early 2000s Energy Superiority Era. There is no again Quantitative Easing and Money printing. U.S. Treasury Bond Interest rates TVC:TNX , TVC:TYX as well as U.S. Federal Funds Rate ECONOMICS:USINTR are huge nowadays like many years ago. Commodities prices like Wheat CBOT:ZW1! , Cocoa ICEUS:CC1! , Coffee ICEUS:KC1! , Crude oil prices TVC:UKOIL , TVC:USOIL jump again to historical highs.
The ratio between AMEX:XLK and AMEX:XLE funds is fading to moderate levels that can be seen as 200-Month simple moving average.
💡 In a conclusion.. I wonder, how the history repeats itself.
This is all because markets are cyclical, and lessons of history always still remain unlearned.
💡 Author thanks PineCoders TradingView Community, especially to @disster PineCoder for its excellent and simple script Quantitative Easing Dates .
Based on this script, Easing Dates are highlighted at the graph.

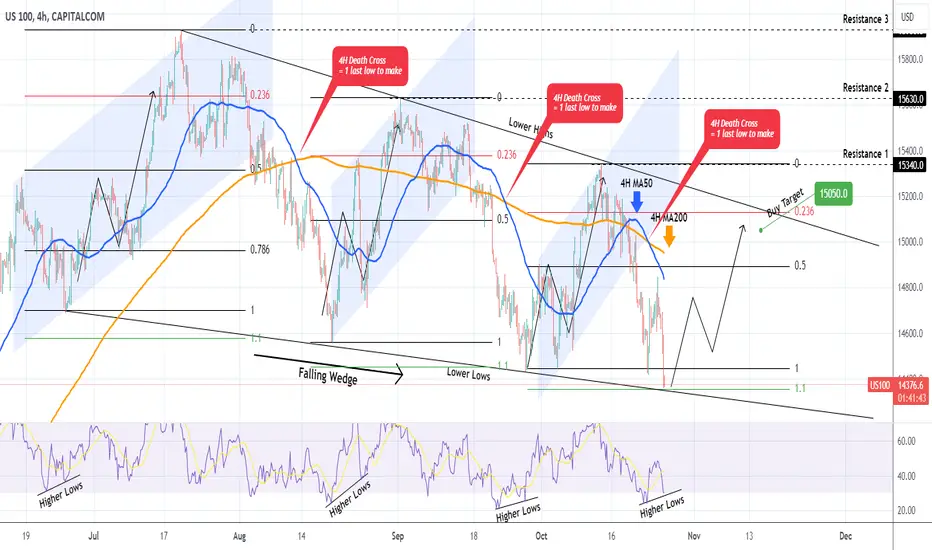
NASDAQ Numerous technical indicators call for a Buy.Nasdaq (NDX) gave us a low risk sell trade last week (see chart below), where after taking the loss on the Channel Up bottom buy, we reversed to selling on the break-out and hit 14530:
Standard 'buy low, sell the breakout if invalidated' approach that aims at assuming low risk near supports/ resistances and high return when those break.
This sell-off brought the price on the Lower Lows (bottom) trend-line of the Falling Wedge for the 4th time. Coming of a 4H Death Cross, this is the 2nd Low after its formation, which has previously been a bottom pricing and buy signal. Additionally, the 4H RSI has been on Higher Lows on every bottom. The last indication that this is a solid buy entry, is that the price hit the 1.1 Fibonacci extension (from previous Low to High), which was where the previous two bottoms where formed.
As a result of all the above parameters, we issue a buy signal on Nasdaq and since the previous Lower Highs almost hit the 0.236 Fibonacci level, we set the Target at 15050.
-------------------------------------------------------------------------------
** Please LIKE 👍, FOLLOW ✅, SHARE 🙌 and COMMENT ✍ if you enjoy this idea! Also share your ideas and charts in the comments section below! This is best way to keep it relevant, support us, keep the content here free and allow the idea to reach as many people as possible. **
-------------------------------------------------------------------------------
💸💸💸💸💸💸
👇 👇 👇 👇 👇 👇
$QQQ, $NQ, NASDAQ, QQQ short positionsNASDAQ:QQQ continues to weaken; I am short with various entries in the yellow box. Now that NASDAQ:QQQ has established a newer "lower-low" it may rally a little; but it is overall short.
As such I'll be considering $374 as the top of my new box with $368 as the likely resistance zone to press these shorts.
I think we'll see a run on that resistance zone by late November that; given the weakness proven by the lower-low, will likely fail.
Liquidity is much lower; somewhere like $320. So the current liquidity pool will likely be broken sometime soon, next 2 months.

US 100 INDEX. THREE WORDS THAT YOU SHOULD KNOW - LET'S GO DIVINGThere are looming risks that could "break" the US economy and end its current growth cycle.
Third-quarter GDP estimates are tracking above 5% and the US economy has added more than 2 million jobs year-to-date.
But there are three looming risks that could "break" the stock market and economy and end its current growth cycle, according to a Tuesday note from Ned Davis Research. These are the three risks to consider.
1. A resurgence in inflation
Inflation has made progress in trending towards the Federal Reserve's long-term 2% target after CPI peaked at about 9% last June, but any resurgence in rising prices would threaten the trajectory of the Fed's current tightening cycle.
2. The 10-year Treasury yield is around 5.00%
The 10-year US Treasury yield has surged so far this year, hitting a 16-year high of 5.02% on Monday. A further increase in this key benchmark rate would spell trouble for the broader economy, specifically if the yield breaks above the 5.25% level.
The 5.00 - 5.50% yield range TVC:TNX was an important double-top in 2006/2007, and also represented the peak policy rate of that tightening cycle.
So perhaps we wouldn't take a break of that level lightly.
Higher interest rates increase borrowing rates for consumers and businesses and often curtail demand, leading to slower economic growth, if not a contraction in growth. The 10-year US Treasury yield was at 4.86% on Tuesday.
3. Credit conditions deteriorating
So far this year, the bond market has been more concerned about interest rate risks than credit risks.
Technical graph below for US 100 Index NASDAQ:NDX says that main 125-Day SMA support has been broken as well as major upside trend, and technical figure known as "Head and Shoulders" is in progress right now.

NQ100NQ is approaching the resistance area and may rebound from there. I think it is an opportunity to sell

NASDAQ flashed a 13 years old BUY SIGNAL!Nasdaq (NDX) has completed a Bullish Cross between its 1W MA50 (blue trend-line) and 1W MA100 (green trend-line). Even though it's not a Golden Cross, on the 1W time-frame it attracts particular importance as the last time we saw this bullish signal was more than 13 years ago (February 08 2010) in the (sharp) recovery process after the 2008 Housing Crisis.
The fractals of that Crisis and the (current) 2022 Inflation Crisis are similar. Both hit the 0.9 Fibonacci retracement level and got the first major rejection since the Bear Market. The current wave is ongoing but in 2010 it approached the 0.618 Fib and rebounded strongly for nearly 1 year. On the current pull-back wave the 0.618 Fib is at 14000 and thi index already hit 14420.
Is it good enough to start the new recovery wave? It certainly is low enough to give us acceptable risk for the long-term, especially after the formation of a 13 year old bullish pattern. Based on the 2010 fractal, we may see new All Time Highs on Nasdaq in less than 6 months.
Are you buying on this signal?
-------------------------------------------------------------------------------
** Please LIKE 👍, FOLLOW ✅, SHARE 🙌 and COMMENT ✍ if you enjoy this idea! Also share your ideas and charts in the comments section below! This is best way to keep it relevant, support us, keep the content here free and allow the idea to reach as many people as possible. **
-------------------------------------------------------------------------------
💸💸💸💸💸💸
👇 👇 👇 👇 👇 👇


NASDAQ MACD deciding the rebound.Nasdaq is having the strongest two day stretch since October 6th, turning around the 4H timeframe from vastly oversold to nearly neutral (RSI = 41.141, MACD = -139.060, ADX = 43.205). If the 4H MACD completes the Bullish Cross, it will be on the same low level as September 24th and August 21st, which where both Lows of the Falling Wedge pattern. If it fails to be formed, we will hold huying until the price reaches the LL trendline at the bottom of the Falling Wedge. In either scenario our target is the LH trendline of the Falling Wedge (TP = 15,150).
## If you like our free content follow our profile to get more daily ideas. ##
## Comments and likes are greatly appreciated. ##

$NQ! Close to support. Now what ?I closed my short position on Friday.
There is a little more room for downside, but we are basically on support.
I will follow a wait and see apporach today and tomorrow.
Top of the wedge will be the target if some market strength returns.
If we break support to the downside, a failed retest of the breakout line will be a good place to short. I am cautious in the medium term and will remain nimble.
Geo political instability and rising US treasury yields not doing markets any favours.
We also need to keep an eye on oil prices.

Nasdaq triple top sees 1000$ drop in short termHigh probability of a 1000$ drop or even more, with a clear triple top formation.
We are topping here... after Dow Jones and S&P500 it's time for a weak tech sector.
I see an acceleration of the bear trend in the next few hours.

NASDAQ Approaching the bottom of the Falling Wedge.Nasdaq is extending the decline it suffered at the top of the Falling Wedge pattern.
The Falling Support is the level to watch for buying and the price is within days from hitting it.
Trading Plan:
1. Buy when the price hits the Falling Support and the MACD (4h) makes a Bullish Cross.
Targets:
1. 15000 (slightly over the 0.618 Fibonacci).
Tips:
1. The MACD (4h) gave confirmed buy signals / Wedge bottoms after it formed a Bullish Cross. This is why we consider it a parameter for a buy.
Please like, follow and comment!!
Notes:
Past trading plan:

mini NasDaq Trend Change this week (This not financial Advice)Hi Everyone, I saw this structure break just now and love to share that with you, Nasdaq 100 from 15 sep 2023 changed the trend from Up to Down trend and the structure was moving smoothly to down, if you notice the trend made 3 times retesting on 18 aug 2023 and on 27 Sep 2023 and this week starting from 23 Oct 2023 which almost each month have the same retesting , All Three times look strong testing than the other but we will see that also it look will fail the test and went back up, in 29 sep 2023 the price went bullish and shoot up the trend but resistant was strong on the range of 14950 and 14850 , Then, On 6th oct 2023 Breakout with strong candlestick to made MBS one 15020 , the price went back gradually which is health to the same point where the candle shoot 14700 , NOW this week could broke down to close gaps made long back or went back to 15422 .
Again this is not financial advice you will be responsible on your action.
this is sharing knowledge and looking for discussion.
