$NQ MMBMAs mentioned at the beginning of the week, our DOL targets are being hit one by one. Now, we believe the price will begin the day’s opening with a bearish correction, aiming to capture internal liquidity in the discounted region, before resuming the bullish movement in search of the next targets.
NQ1

Tuesday: Make Your Day a Payday with NASDAQ 25.01.07Hello, this is Greedy All-Day.
Today’s analysis focuses on the NASDAQ.
Monday Trading Results
Buy Signals: The green boxes marked the buy entry zones for Monday’s session.
Sell Signals: No sell entries were triggered, so there is no commentary for sell trades.
Outcome: Both the first and second buy entries were activated, and all targets were achieved.
Profit: The price moved a total of 321 points, resulting in approximately $6,400 in profit per contract.
How Should We Approach Today’s Market?
Looking at the daily chart, the price appears to have entered the supply zone within the green box range, which spans 21619 to 21896.
While Monday’s bullish candle demonstrated strength, the upper wick formed during the U.S. session's close indicates that bullish momentum was met with selling pressure. This leaves a less-than-ideal setup for the bulls.
The trend is likely to continue in the direction of the breakout from this supply zone.
Today’s Trading Strategy
Buy Perspective:
Entry Trigger: A breakout above both the resistance trendline and Monday’s high at 21897 is recommended for a conservative buy entry.
Target Levels:
First resistance: The yellow box, which contains the purple resistance trendline.
Beyond this, the maximum target lies at 22111.
Scenario Analysis for Bulls:
Should the price rally, the green box zones (previous lows) will form a double bottom structure, providing a strong foundation for continued upside.
A breakout above 22111 would confirm a larger double bottom pattern, potentially paving the way for a rally toward previous highs or even new all-time highs.
Sell Perspective:
Entry Trigger: A break below the ascending trendline and Monday’s corrective low at 21619 serves as the sell signal.
Target Levels:
Maximum target: 21520
Beyond this, further downside is possible; however, key support zones are unclear due to differing stair-step patterns during recent rallies and corrections.
Conclusion
The NASDAQ is at a critical juncture, balancing between bullish potential and bearish risks:
For Buyers: Watch for a breakout above 21897 for potential upside to 22111 and beyond.
For Sellers: Monitor a breakdown below 21619, with 21520 as the initial target.
Be prepared for both scenarios, as the market continues to provide dynamic opportunities. Let’s stay sharp and trade wisely. 🚀

NASDAQ Nas100 Outlook I already anticipated the bullish movement to my zone since last week. Now I'm going to sell from 21610.60 down to last week low 20813.38 join me.
Watch out for more of my insights. And comments if you have different insights.
Ciao!

NASDAQ rebounding strongly on its 1D MA50. 1 month rally ahead.Nasdaq (NDX) has been trading within a 4-month Channel Up and hit last Tuesday its 1D MA50 (blue trend-line) exactly on the Channel's bottom. Even though it marginally broke it, the 1D candle closed exactly on the 1D MA50, causing a strong bullish Friday reaction.
As today opened equally green, we technically view this sequence as the start of the new Bullish Leg of the pattern, which may be confirmed today if the 1D RSI breaks above its MA (yellow trend-line), as both previous Bullish Legs did.
Our Target is 22600, which represents a +9.00% rise, the minimum a Bullish Leg had within this Channel Up.
-------------------------------------------------------------------------------
** Please LIKE 👍, FOLLOW ✅, SHARE 🙌 and COMMENT ✍ if you enjoy this idea! Also share your ideas and charts in the comments section below! This is best way to keep it relevant, support us, keep the content here free and allow the idea to reach as many people as possible. **
-------------------------------------------------------------------------------
💸💸💸💸💸💸
👇 👇 👇 👇 👇 👇

$NQ MMBM "As planned, targets 1 and 2 were nearly reached, reinforcing the accuracy of the analysis based on MMBM. It is important to note that, at the open, we might see a correction seeking liquidity in a discounted region, which could create an opportunity to reach the next targets."

The Market Matrix - Gold, Crude, Nasdaq & DXY for January 5 2025This weeks edition of The Market Matrix.
Actionable insights for the Gold, Crude Oil, Nasdaq & DXY Markets.

NQ may have found a little Support to continue its climb.After a healthy, needed pull back, the NASDAQ may have found the support it needed to finish its climb with the inauguration soon to come at the end of the month. Price has not been comfortable below the middle Keltner channel band during this push-up over the last few weeks. The MACD and and RSI look prime for a turnover, and Fridays push-up off of Thursdays Liquidity sweep, sets us up nicely for a move up. At the very least, there's a good chance we test some of these levels for the upcoming week.

New Monday For Nasadaq Trading Strategy 25.01.04Hello, this is Greedy All-Day.
Today, we’ll be analyzing the NASDAQ, focusing on recent results and strategies for Monday's market.
Friday’s Briefing Results
Buy Signal:
Trigger: Breakout above the resistance trendline and the 21360.
Outcome: The NASDAQ experienced significant upside, though it did not reach the maximum target of 21575.
Profit: The price movement offered approximately $5,000 per contract for a range of 250 points.
Sell Signal:
Trigger: A break below 21120 was required for sell entry.
Outcome: The level was not breached, so no sell trades were triggered.
Monday’s Market Strategy
Let’s first analyze the daily chart:
Following Thursday’s decline, the price tested the Ichimoku Cloud's support.
Although the 20 EMA wasn’t touched, the daily candle closed as a bullish candle.
Notably, the Lagging Span found support at the candles, which can be seen in the green box.
Key Resistance: If the price breaks above the 20 EMA, the next major resistance is 21812, supported by the blue box candlesticks as evidence.
Buy Entry Points
Recommended Buy Zones:
First Entry: Above 21575
Reasoning: This level represents the resistance encountered during the December 30 session and Friday’s high.
Caution: A breakout above the Daily 20 EMA is essential; otherwise, resistance is likely.
Targets:
TP1: 21645
TP2: 21670
TP3: 21740
Second Entry: Above 21746 + Resistance Trendline Breakout
Reasoning: Breaking the black box supply zone opens the door for a one-way rally, as there are no significant overhead resistances.
This scenario also implies a clear breakout above the daily 20 EMA, signaling strong bullish momentum barring any unexpected news.
Targets:
TP1: 21812
TP2: 21895
TP3: 21935
Sell Entry Points
Recommended Sell Zone:
Trigger: Break below the ascending trendline + 21345
Reasoning:
Historical support at 21345 has been confirmed multiple times (black box zone).
A break below this level, coupled with a trendline breakdown, would suggest a shift to a corrective trend.
Additionally, this level acted as a pullback zone during Friday’s rally, suggesting significant supply if revisited.
Targets:
TP1: 21265
TP2: 21206
TP3: 21120
Extended Scenario:
If 21120 (marked in the blue box) is breached, additional downside is likely.
While new entries are not recommended, breaking this level increases the probability of testing Thursday’s low.
Conclusion
The market showed downward momentum from Monday to Thursday last week, followed by a recovery on Friday.
As a futures trader, I always consider both bullish and bearish scenarios, emphasizing the importance of flexibility and preparation. This approach ensures we can adapt to any market conditions effectively.
Take some time to rest over the weekend, and let’s aim for another successful trading week ahead. 🚀

NASDAQ Double Bottom starting the new bullish waveNasdaq / US100 is trading inside a 5 month Channel Up.
The price made a Double Bottom on January 2nd and rebounded today back to hit the 4hour MA50.
If it crosses above the Falling Resistance, we will have a technical confirmation of the new bullish wave, similar to September 12th 2024.
That bullish wave hit the 1.236 Fibonacci extension.
Buy and target 22400 (Fib 1.236).
Previous chart:
Follow us, like the idea and leave a comment below!!


SELL NASDAQAs you can see on the chart, we have our MS stll going bearish and the market gave us a confirmation of the reversal after the correction.
You can sell and take the same level I set on the chart.
Follow for more!

NASDAQ Analysis: Key Levels and Trading Opportunities 25.01.03Hello, this is Greedy All-Day.
Today, we’ll dive into a detailed analysis of the NASDAQ, starting with a review of the recent trading signals and results.
Briefing Results
1. Sell Signal: Red Box Entry
Entry Trigger: During the Asian session, prior to the Hang Seng market opening, the NASDAQ broke below Tuesday’s low of 21177.
Result: Price quickly reached the target of 21128, delivering a clean, decisive trade.
Profit: $1,000 per contract for a 48-point range.
2. Buy Signal: Green Box Entry
Entry Trigger: During the transition between the Asian close and the European open, the price rebounded strongly, presenting a buy opportunity.
Result: The maximum profit for this trade was 133 points, or approximately $2,660 per contract.
3. Sell Signal: Light Blue Box Entry
Entry Trigger: During the U.S. session, the NASDAQ broke below the previous low of 21006. Although there was a notable rebound afterward, the price met its target.
Observation: The candlesticks showed significant lower wicks, indicating strong attempts to hold support.
Profit: $2,600 per contract for a 130-point range.
Total Briefing Results:
The maximum combined profit from these trades was $6,260 per contract, demonstrating the effectiveness of the strategy.
Daily Chart Analysis
The price tested but failed to sustain inside the Ichimoku Cloud, confirming a rebound at the lower boundary.
The Lagging Span (Chikou Span) has now intersected with the candles, signaling a pivotal moment.
Key Watch Point: Whether the Lagging Span finds support at the candles or falls below them will be critical for determining the next directional move.
Trend and Market Structure
The NASDAQ remains firmly within a descending channel.
A repeated pattern has emerged: modest gains during the Asian and European sessions, followed by a bearish reversal during the U.S. session.
Breakout Requirement: A breakout above the blue box at 21575 is essential for confirming a shift out of the current downtrend. Until this occurs, the channel’s movement will likely persist as the prevailing trend.
Buy Opportunities
Recommended Entry:
A breakout above the black box zone and the horizontal resistance at 21360 is required for a valid buy signal.
Why This Zone Matters:
On the 4-hour chart, this level aligns with the 20 EMA, which has acted as a resistance during U.S. session pullbacks.
Breaking above this level would signal renewed bullish momentum.
TP: 21421 / 21456 / 21492 / 21523 / 21575
A move beyond 21575 would strongly indicate a potential trend reversal, providing room for further upside.
Sell Opportunities
Recommended Entry:
A conservative sell entry would occur if the price breaks below 21120, a key support zone.
Reasoning:
The lack of clear support below this level increases the risk of rapid, one-way moves.
Observing how the price reacts to this zone will be critical for managing risk.
Targets:
Initial target: 20984 (yesterday’s low).
Below 20984: If this level fails, the downside potential becomes unpredictable and will depend on market momentum.
Conclusion
The NASDAQ is currently at a critical juncture, with clear opportunities for both bulls and bears:
For Buyers: Focus on breakouts above 21360 and 21575, as these levels are pivotal for a potential trend reversal.
For Sellers: Watch for breakdowns below 21120, with the potential for significant downside if 20984 is breached.
While the market remains volatile, patience and precision in executing trades at key levels will be essential for success. Let’s stay disciplined and take advantage of the opportunities the market provides. 🚀

NASDAQ 2025: The First Direction? 25.01.01Hello, this is Greedy All-Day.
Today’s analysis focuses on the NASDAQ.
Tuesday Briefing Results
Let’s start with the results of Tuesday’s briefing.
Both buy and sell signals played out as expected.
Buy Signal:
The breakout above the resistance trendline and 21476 level was the trigger for a buy entry.
The target was the yellow box supply zone, and the price moved as predicted.
The breakout occurred after the NASDAQ had already corrected significantly, making it a reasonable entry.
Maximum profit for this position was 120 points, equating to approximately $2,400 per contract.
Sell Signal:
For short positions, I recommended waiting for a breakdown of Monday’s low at 21253 in addition to the trendline break.
The price broke 21253 and exceeded the target of 21204, providing a solid short trade.
From the entry point, the NASDAQ dropped 70 points, yielding a profit of approximately $1,400 per contract.
Total Potential Profit:
Combined, the maximum profit for both trades was approximately $3,800 per contract on Tuesday.
Daily Chart Analysis
To prepare for Thursday, let’s examine the daily chart.
As mentioned on Tuesday, the price touched the 60 EMA and briefly broke below it but ultimately closed at the EMA level.
The remaining support is the December 20 low at 21006, which is the key level to watch.
A breakdown below 21006 would confirm entry into the yellow box supply zone or potentially the red box demand zone.
Key Observations:
The red box zone aligns with the lower boundary of the Ichimoku Cloud, which makes it a significant support level unlikely to break easily.
However, the yellow box zone has no clear support levels, as it previously acted as a supply zone that pushed the price upward.
If the price enters the yellow box, expect either volatile swings or a one-directional move, depending on market sentiment.
Descending Broadening Pattern
The NASDAQ is forming a descending broadening pattern after the sharp drop on December 27, 2024.
Key Insights:
Support levels appear weak, and the trend has shifted bearish since December 27.
A complete trend reversal requires a breakout above 21734, the starting point of the pattern.
Trading Strategy:
For short positions: Focus on larger moves, as the downtrend dominates.
For long positions: Keep trades short-term and within the range until a clear breakout invalidates the pattern.
Buy Perspective
Buy Entry Levels:
First Entry: Breakout above the red box resistance trendline and 21360.
If this level breaks, the price may briefly rise to the top of the yellow box at 21442.
However, this is not a full trend reversal, so a conservative approach is recommended.
Second Entry: Breakout above the blue resistance trendline.
If this occurs, the yellow box top will likely already be broken, opening up a potential move to 21571.
Even then, the trend reversal would still be incomplete, so caution is advised.
Third Entry: Breakout above 21571.
This level opens the path to the next significant resistance at 21746, providing a stronger buy signal with momentum.
Sell Perspective
Sell Entry Levels:
First Entry: Breakdown below Tuesday’s low at 21177.
Target: 21128, which corresponds to a past demand zone with historical support from prior wicks.
Second Entry: Breakdown below 21128.
Target: 21006, the December 20 low, which is a critical support level.
Extended Target:
If 21006 breaks, the daily chart opens up for a potential move into the 20000 range, as previously analyzed.
Conclusion
The NASDAQ is currently in a volatile and pivotal zone:
For buyers: Focus on breakouts above key levels (21360, 21571) with conservative targets until a full trend reversal occurs.
For sellers: Use breakdowns of key supports (21177, 21128, 21006) for entries, with room for larger moves in case of further downside.
Patience and precision will be key to navigating this market. Let’s trade smart and make the most of these opportunities. 🚀

Nasdaq Analysis: Wrapping Up 2024 with Precision 24.12.31Hello, this is Greedy All-Day.
Today's analysis focuses on the Nasdaq.
Results from Monday's Briefing
Let’s start by reviewing the results of Monday's briefing.
Buy Scenario: Breakout above the resistance trendline.
Sell Scenario: Breakdown below the upward trendline.
The buy scenario did not activate as the entry level was not reached.
In the sell scenario, the price broke below the upward trendline and dropped to approximately 343 points lower.
For a single contract, this move offered a profit of about $6,800, providing a solid opportunity for gains.
Today's Analysis
Daily Chart Overview
If a rebound occurs, the price might bounce up to the 20-day moving average on the daily chart.
However, instead of focusing on the rebound potential, it’s more important to analyze how much further the downside could extend.
As of now:
The 60-day moving average on the daily chart aligns near yesterday’s support zone at 21,253.
This moving average could serve as short-term support.
If this support fails:
The price could drop to the recent low of 21,006, recorded on December 20, 2024.
The red box marks a key level. If this zone breaks, the price could enter the cloud zone, fully entering the green box supply zone on the left. This could further open the possibility of a decline to the lower boundary of the green box.
Buy Scenario
Today's buy scenario presents two potential entry points:
Entry 1: Breakout above the high supply zone from the Asian session + Breakout above 21,476.75.
Target: Maximum 21,571.
Entry 2: Breakout above 21,571 + Breakout above the yellow resistance trendline, located in the green box.
Target 1: 21,666.
Target 2: 21,739.
Target 3: Maximum to the orange box.
Targets 1 and 2 are based on the premise that the price has entered the white supply zone on the left.
Sell Scenario
For the sell scenario, the entry will not rely on the trendline break due to its shallow slope. Even if the trendline breaks, a retest bounce from yesterday's low of 21,253 is likely.
Thus, the sell entry point will be upon a breakdown below the green box, which marks yesterday’s low of 21,253.
Target 1: 21,204 (red box).
The first target is relatively small because the past data shows a bounce from the orange box supply zone on the left.
Target 2: 21,006, the low recorded on December 20, 2024.
Conclusion
Let’s finish 2024 strong! Since January 1 is a holiday, I’ll return with the next briefing on January 2.
Happy New Year in advance, and see you soon!

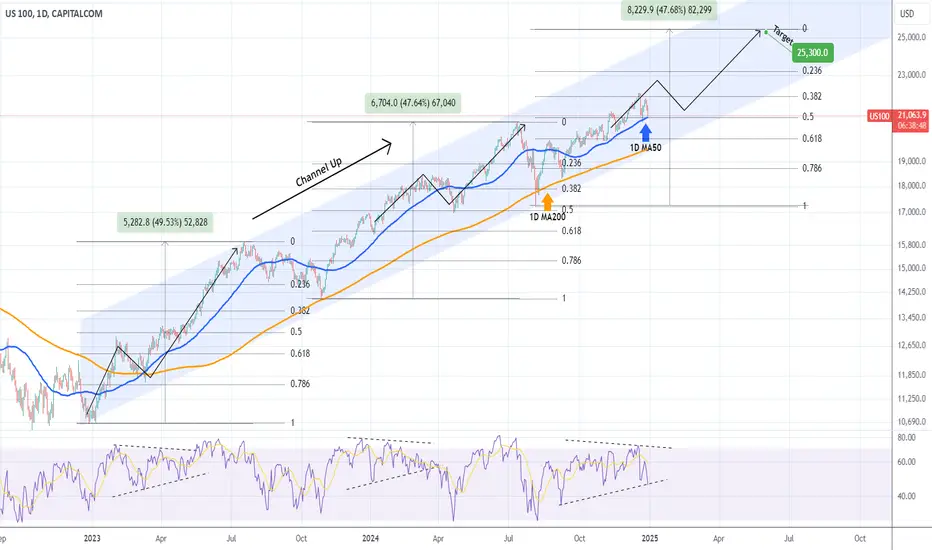
NASDAQ headed into a volatile January but uptrend remains intactNasdaq (NDX) is yet again testing the 1D MA50 (blue trend-line) following the direct hit of December 20. Despite the pull-back, it is technically respecting the 2-year Channel Up that it's been trading in since the December 26 2022 market bottom. Its most recent Higher Low was on the August 05 2024 1W candle, which initiated the Bullish Leg we're currently in.
Until we get a 1W candle closing below the 1D MA200 (orange trend-line), the pattern remains intact and the strategy is to continue buying into the current Bullish Leg. The previous two Bullish Legs had one main pull-back/ correction sequence each and apart from that, the majority of the Leg was technically a straight uptrend. Given that the current Bullish Leg has been trading above its 1D MA50 since September 12, it is not unlikely to see a correction below it.
Technically, it could be similar to the previous Bullish Leg (March 04 - April 15 2024), as we are trading within the 0.382 - 0.5 Fibonacci range. This means that one more rise above the 0.382 Fib is to be expected in the first week of January but it is likely to then see a correction for the rest of the month below the 1D MA50 into the first 2 weeks of February.
If after that, the 0.5 Fib and 1D MA200 levels hold, we expect the Bullish Leg to resume the uptrend and target 25300. That would be a rise of around +48%, which is the % rise of both previous Bullish Legs.
-------------------------------------------------------------------------------
** Please LIKE 👍, FOLLOW ✅, SHARE 🙌 and COMMENT ✍ if you enjoy this idea! Also share your ideas and charts in the comments section below! This is best way to keep it relevant, support us, keep the content here free and allow the idea to reach as many people as possible. **
-------------------------------------------------------------------------------
💸💸💸💸💸💸
👇 👇 👇 👇 👇 👇
NASDAQ Analysis: Preparing for Monday’s Trading 2024.12.28Hello, this is Greedy All-Day.
Today’s analysis focuses on the NASDAQ in preparation for Monday’s trading.
Friday's Trading Strategy Recap
Let’s first review the results of Friday’s trading strategy.
For buy positions, the breakout of the resistance trendline did not occur during the session, so the suggested entry above the red box did not materialize. As a result, no buy positions were taken.
For sell positions, the breakdown of the ascending trendline occurred after the European market opened. However, entry was only recommended upon breaking the green box to the downside, which occurred during the U.S. session.
As you can see, this resulted in a one-way downward trend, surpassing the target of 21558 and offering a high-probability trade for easy profits.
Maximum Profit:
1253 ticks per contract.
$6,260 per contract.
Weekly Chart Analysis
The weekly candle analysis shows the following:
After the doji bearish candle from December 16, 2024, the direction of the following week was crucial.
This week’s candle closed as a bullish candle with a long upper wick. While it filled last week’s body with an upward move, it eventually declined and closed with a long wick and a small body.
The NASDAQ is still holding support at the 20 EMA on the weekly chart, making next week’s direction critically important.
Daily Chart Analysis
On the daily chart, the NASDAQ closed below the 20 EMA.
During the session, there was steep selling pressure followed by a slight rebound near the close.
However, closing below the daily 20 EMA makes it difficult to view the session positively.
The price is likely to oscillate between the 20 EMA and 60 EMA, as highlighted in the red box, and there’s a high probability of testing the 21300 level next week.
15-Minute Chart: Buy Setup
For short-term buy opportunities, let’s look at the 15-minute chart.
The red box shows a long bullish candle closing at 21746.5. However, the price failed to surpass this level by the close of the U.S. session.
If no significant news occurs over the weekend, the price may break above this level and resolve the bearish candle within the green box, leading to a potential rebound.
If the rebound is strong, the light blue box breakout will serve as the first buy entry point, targeting 21935.
The second buy entry would occur upon breaking the upper resistance at 21989, with the next target being the resistance trendline.
15-Minute Chart: Sell Setup
For short-term sell opportunities:
The short-term ascending trendline is highlighted in red. A breakdown could trigger a short-term correction, with the red box lower boundary serving as the maximum target at 21630–21613.
For conservative entries, wait for a break below the blue box at 21476.75.
If the green box breaks to the downside, it may trigger additional selling opportunities. However, given Friday’s rebound at 21476.75, there’s a possibility of the price finding support and bouncing back.
The maximum downside target for a sell-off is the orange box lower boundary at 21008.
Conclusion
It’s been a long year, and I hope you finish it strong. Let’s work together in 2025 to achieve significant profits through disciplined trading.
Your engagement and support motivate me to provide these detailed analyses, so please don’t forget to like, subscribe, and recommend my content. Let’s make the upcoming year a success! 🚀

es1! retests 5kes1! appears poised for a larger move down, based on the smaller timeframe count .
this leads me to believe that es1! has entered a larger fourth wave. historically, these waves take an average of 2 months to play out and typically result in a 12% decrease from the high before completing.
wave 4's often retrace back into the territory of the prior degree's wave 4, and i expect this one to follow suit.
pay attention to the green trendline i've drawn on the chart,,, it serves as a solid guide for where i anticipate es1! to find a bottom. dipping below the trendline is acceptable, provided we don't see any weekly candle closes beneath it. even if a weekly candle does close below, a strong recovery the following week, such as a gap-up scenario , could invalidate the breakdown.
there’s not much else to add here, as the chart is fairly straightforward. keep an eye on the trendline and monitor weekly closes for confirmation.
💸

NASDAQ: Technical pullback presenting a buy opportunityNasdaq got oversold on 1H due to the strong selling on opening but remains neutral on its 1D technical outlook (RSI = 51.372, MACD = 205.380, ADX = 49.545) as it is still over the 1D MA50. More specifically, it was the rebound on the latter last Friday (Dec 20th) that has initiated the current bullish wave. This is the 5th bullish wave inside the 5 month Channel Up and as long as the 1D MA50 continues to support, we are expecting a new High. As with the prior Highs, we are targeting the 2.382 Fibonacci extension (TP = 22,550).
See how our prior idea has worked out:
## If you like our free content follow our profile to get more daily ideas. ##
## Comments and likes are greatly appreciated. ##

Nasdaq Analysis - Dec 27, 2024Hello, this is Greedy All-Day.
Today's analysis focuses on Nasdaq.
Before starting today's briefing, let me share the results from the previous analysis.
For the buy perspective, the entry price was not reached, so there were no positions to report.
On the other hand, for the sell perspective, the break of the upward trendline occurred at the start of the European session. After the breakout, the market transitioned into a downward momentum, resulting in a decline of approximately $140.
For a single contract, this equated to a profit of $2,800.
Now, let's start with the sell perspective.
Currently, we are observing a break below the extended upward trendline.
While a short-term correction could occur, I do not strongly recommend entering at this time.
For today's sell recommendation, I suggest entering below the green box at 21,816.
This corresponds to the left-side supply zone, with a maximum target of the red box at 21,543.
Next, let's look at the buy perspective.
The first entry point would be a breakout above the resistance trendline, which is currently around 22,060.
For the second entry, it would be at the top of the frame around 22,111.
Regarding targets:
For Target 1, the entry of the first position will aim for the second entry level as the goal.
Beyond that, the next resistance levels are 22,210 and 22,296.
Conclusion
Thank you for your hard work this week. Wrap things up well, and let’s prepare for next week!

nasdaq analysis 2024-12-26"NASDAQ Analysis: Key Levels and Strategies"
Hello, this is Greedy All-Day.
Let’s dive into the NASDAQ analysis.
Let’s start with the 30-minute chart.
On December 24, Christmas Eve, the NASDAQ began to rally right after the U.S. market opened. As shown in the chart, the index broke through the red box, which previously acted as resistance during Monday’s session rebound. Once it surpassed this resistance, a one-way upward movement followed.
30-Minute Chart Trading Strategy
From a buying perspective, now does not seem like an ideal entry point.
While the NASDAQ is showing an uptrend that offsets the strong decline from the orange box on the left, entering at this point would mean buying near the upper boundary of the orange box, rather than the middle or lower levels.
Although the supply zone opens up to the red box above, this depends on sufficient buying momentum to sustain the rally. A conservative buying strategy would be to wait for a breakout above the upper boundary of the red box. A breakout would also mean overcoming the resistance trendline, potentially paving the way toward new highs.
Selling Perspective
For a selling strategy, the first signal would be the breakdown of the ascending trendline. If the NASDAQ breaks below the blue box’s lower boundary, this could be an entry point for short positions.
However, note that the NASDAQ has been consistently following the 20 EMA on the 30-minute chart. Therefore, the first sell signal would likely come from a break below both the 20 EMA and the ascending trendline.
Target Levels
In the short term, the green box serves as the target for any bearish moves. If the NASDAQ breaks below the green box, it would indicate entry into the next price frame. In this case, a decline to as low as 21558 could be possible. However, given the current bullish trend, a conservative approach is recommended.
Conclusion
For buyers: Wait for a breakout above the red box’s upper boundary for confirmation before entering.
For sellers: Watch for the breakdown of the 20 EMA and the ascending trendline as your initial signal. A break below the blue box’s lower boundary could solidify your entry point.
Trend caution: While short-term corrections are possible, the overall trend still leans bullish, so trade cautiously.
Let’s trade smart and aim for success. Best of luck in the markets! 🚀

NASDAQ Technical buy on this 1D MA50 bounce.Nasdaq (NDX) has been trading within a Channel Up pattern since the September 06 Low and potentially has started the new Bullish Leg as on Friday it hit the 1D MA50 (red trend-line) and rebounded. The 1D MA50 has been holding since the September 12 bullish break-out.
Still, there is no confirmation yet, as the price remains below the 4H MA50 (blue trend-line). As you can see on this chart, every time the index broke above its 4H MA50, it never broke again until the next Higher High of the Channel Up, technically confirming the new Bullish Leg.
With the 4H RSI rebounding also from oversold (<30.00) territory, there are higher probabilities of this being the new Bullish Leg. If the confirmation comes, we expect at least another +9.08% rise from Friday's Low (which was the % rise of the previous Bullish Leg) to target 22500.
-------------------------------------------------------------------------------
** Please LIKE 👍, FOLLOW ✅, SHARE 🙌 and COMMENT ✍ if you enjoy this idea! Also share your ideas and charts in the comments section below! This is best way to keep it relevant, support us, keep the content here free and allow the idea to reach as many people as possible. **
-------------------------------------------------------------------------------
💸💸💸💸💸💸
👇 👇 👇 👇 👇 👇

Daily Nasdaq Insights – December 22, 2024Hello, this is Greedy All-Day.
Before the Nasdaq's movements beginning on December 23rd, let’s dive into a weekend analysis to prepare for the upcoming market conditions.
Weekly Chart Analysis
The weekly Nasdaq chart presents a rare occurrence—a bearish candlestick after a significant upward trend. Interestingly, the length of both the upper and lower wicks is quite balanced, resulting in a large Doji-like candlestick. However, a Doji candlestick doesn’t necessarily signal a trend reversal to the downside.
Why?
The Ichimoku Cloud's Lagging Span remains above the candlesticks. Unless we see significant bearish momentum, the Lagging Span is likely to find support from the candlesticks below.
The price is still holding above the 20-week moving average, which currently sits at 20,503.
A bearish move into the Ichimoku Cloud would require the price to drop further to 19,383 to fully enter the cloud zone.
In conclusion, the weekly chart suggests that the uptrend is still intact. Despite closing the week with a bearish candle, it followed a recent all-time high. This could indicate a temporary pause rather than a definitive reversal, keeping the potential for further upward movement on the table.
Daily Chart Analysis
Examining the daily chart, the Lagging Span still remains above the candlesticks, reinforcing that a trend reversal is not yet confirmed.
Additionally, the long-term upward trendline remains intact. For a decisive breakdown to occur:
The price would need to break below the thick Ichimoku Cloud (zone between 20,775 and 19,880).
A definitive trendline breach would likely occur if the price falls below 19,560, which would signal a clear shift in momentum.
At this stage, the daily chart reflects resilience within the broader uptrend despite recent pullbacks.
1-Hour Chart Analysis
The 1-hour chart reveals why Nasdaq's current direction is ambiguous.
Resistance Zone (Orange Box): This is the final key resistance trendline. A breakout above this level would provide a clear buy signal, as the price would enter the red box supply zone.
If this resistance is overcome, Nasdaq has a high probability of testing the red box’s upper boundary near 22,432, potentially forming a double top or even reaching a new all-time high.
Friday's session did see a rebound, but:
While the yellow box resistance was broken, the price failed to hold support near the session close, which casts doubt on the strength of the rebound.
To confirm further upside momentum, the price needs to break above the blue box resistance near 21,935.
Without reclaiming this level, the strong bearish candlestick from Friday’s session raises skepticism about whether this was a genuine reversal or merely a temporary relief rally.
Final Thoughts
Historically, markets have often rallied during the holiday season, but this year appears to present more complex conditions. Instead of trying to predict the market, focus on reacting to key levels and signals.
I will continue to provide detailed and actionable analysis to assist you in navigating these challenging markets. Stay prepared and trade wisely!

NQ Weekly and Longer term Bias (We were fire last week, check)hey guys just my weekly chart and levels going into the week. everyone expecting a santa rally, not so positive... i could see it mooning from here, don't get me wrong. im much more bullish this week than last now that we got some sort of correction (check last weeks analysis for real, read the chart and play the thing for the week, we cooked, hope you all did too, all 3).
anyway a lot on there, i think it's downward, people buying the wrong dip in my opinion, much more liquidation to come.
good luck
