RUT up to 1550, 1570 next days AND than another bottom 1480
next days UP to 1550 and 1570
Oct 7th local BOTTOM 1480
long term UP /ZIG ZAG sideways/ to 1600 election day 6th November
SPX, NQ tracking a same pattern
Nq100

Nasdaq could see some buying BEFORE BEAR MARKET! Nasdaq was the leading index this year and we found out why pretty recently. The FAANG index was being propped up by nonother than SoftBank with a $5Bn options positions on big tech.
SoftBank got their hands on OTM calls for big Tech which did a few things:
1) Forced the options market makers to hedge the position against them meaning they had to buy the stocks. Tying up about $50 Bn in shares on the big Tech companies. This alone pushed US Tech stock prices higher.
2) Created interest in order flow for large traders that saw the options interest and the transaction quantity somewhere OTM on big Tech which caused buying to take advantage of the potential move higher from the big fish.
3) Caused a rally in tech and piqued the interest of a lot of traders that saw tech stocks rallying, jumping in blindly, or calculated entries for the continued push higher.
Which means the recent sell off was profit-taking from Tech and understanding what had happened and selling. To return major stocks to "value"
That caused the Nasdaq to drop nearly 15% from its highs and it seems that there is more downside to come out even though it seems that the support is being held up for now. Support is now at $260 and the 100-day moving average is very nearby.
If this level breaks we're going to see a temporary bear market in the Nasdaq, as we saw the year prior. We could see a pop into $280 on QQQ before we get the downside though! There is a key resistance there. under $260 and the 100-day MA we will see a big sell stop run into the prior broken top and volume profile block.
The volume is worth noting as well, it's decreasing on every rally. Most recent rally at least, with big sell volume. this is a bear sign.
This is an idea, for educational purposes, that doesn't constitute investment or trading advice.


ridethepig | Nasdaq📍 This is another known position. Breakdown in 5 waves by testing 10,236; 9,548 and 8,859 .
Double zig zag is purely a tactical weapon. It is terribly compelling; even the most sluggish of buyers will be trapped here - driven to cover after the latest breakdown.
We shall open the next chapter in US Equities with four simple charts:
Dow:
S&P500:
Russell:
📌 In the coming sessions we can open up the short-term charts and start adding some interesting positions to the portfolio.
Sellers last move has been interesting of course, not because of the breakdown but because of the blow off top and profit taking that has taken place since. The somewhat theatrical looking pullback is no less imaginative than the move we played together in German Equities (DAX) earlier in the year:
If 8,859 is reached then we have the potential for another waterfall. The final combination will depend on whether we get market closures. As usual thanks for keeping the feedback coming 👍 or 👎.


short the S+P at new all time highDivergence here on the S+P at all time highs, right at the top of the rising wedge.
We also have an bearish engulfing candle on the hourly
Looks good to short down to the break of the rising wedge, stop at ATH

What is the Next Move for NASDAQ 100 Futures?Quite frankly, we don't know the answer. The index continues its uptrend and therefore, hit the all-time high on 18 August 2020.
.
From our technical standpoint, assuming the bull-run continues, we are looking at an initial resistance between 11700 and 11841.50. That's a short technical analysis and we shall see what the index is going to do in the next few trading sessions.
Good trading!
From the Desk of NinjaSingapore
19 August 2020

CRYPTO Is The New NASDAQ -MAKE LIFE CHANGING MONEY *WATCH THIS*MartyBoots here. I have been trading for 13-14 years and I am here to share my ideas with you to help the crypto space.
I think it would be a bad idea to sleep on the Crypto market right now .
If you want help trading it hit me up

nq100Hello traders, here is the analysis from our team :
We: Buy: 11030
Target: 11043
Stop loss: 11017
Let us know in the comment section below if you have any questions.😉

nq100Hello traders, here is the analysis from our team :
Here is a long term projection.
Sell :10870
Target :10670
Stop: 11070
To balance off short term, We bring you long term .
Valid till: 08/14/2020
Let us know in the comment section below if you have any questions.😉


NQ 100Hello traders, here is the analysis from our team :
We sell: 10814
Target 10801
Stop loss: 10827
Let us know in the comment section below if you have any questions.😉

nq100Hello traders, here is the analysis from our team :
We sell: 1814
Target 1801
Stop loss: 1827
Let us know in the comment section below if you have any questions.😉

nq100Hello traders, here is the analysis from our team :
we sell: 10858
stop: 10884
target: 10826
take profit at any point
Let us know in the comment section below if you have any questions.😉

Nasdaq 100 Bearish directionAll elliott waves for the uptrend is complete so we are heading lower from now. You should cash out a little sum every time TP hits.

nqCorrection we buy 10588
Hello traders, here is the analysis from our team :
Yesterday, We told everyone to sell heavy @ 10747. we don't like to sell.
So today, We will buy @10588
Let us know in the comment section below if you have any questions.😉

NQHello traders, here is the analysis from our team :
Yesterday, We told everyone to sell heavy @ 10747. we don't like to sell.
So today, We will buy @10388
Let us know in the comment section below if you have any questions.😉

QQQ -Two Diamond are better than one.This Double Diamond at the top of the QQQ trend provided support/res lines for the 30 Minute QQQ H&S that confirmed with follow through on Tuesday July 28th.

nq100Hello traders, here is the analysis from our team :
Let us know in the comment section below if you have any questions.😉
Hello traders, here is the analysis from our team :
We feel; These area's. Will give best results for scalp buys, Or Sells.
#1 Sell @ 10747
#2 Buy@ 00000
* Futures sometimes run in one direction during Day. *
So. If no Momentum, Or pullback in these area's for 7/27/2020.
Void trade. We like 130 pip Sl/Target. Take profit 5 to 130 pips, Move
STOP LOSS UP WHEN YOU CAN.
Let us know in the comment section below if you have any questions.😉

nq100Hello traders, here is the analysis from our team :
We feel; These area's. Will give best results for scalp buys, Or Sells.
#1 Sell @ 10550
* Futures sometimes run in one direction during Day. *
So. If no Momentum, Or pullback in these area's for 7/27/2020.
Void trade. We like 130 pip Sl/Target. Take profit 5 to 130 pips, Move
STOP LOSS UP WHEN YOU CAN.
Let us know in the comment section below if you have any questions.😉
Let us know in the comment section below if you have any questions.😉

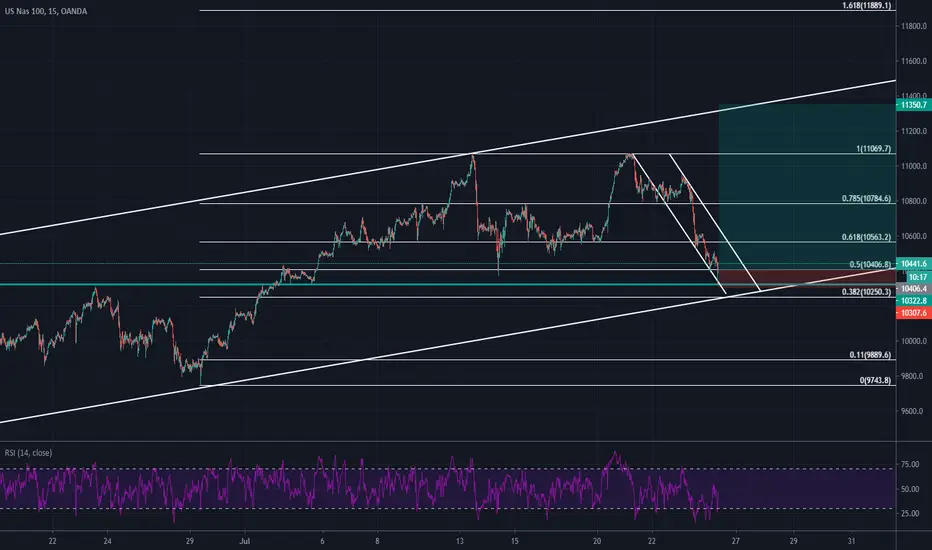
US100 / Nasdaq 100 Overview/ AnalysisHi Guys!
As we can see some time ago, I set a certain trend channel conjugated with three EMA 200/50/20 levels and Fibonacci levels, and recently the chart has been respecting this channel.
Further development of price changes directly depends on the DXY. In my understanding, if the dollar index breaks through the resistance level (which it did on Thursday) (but it is too early to judge since bears can push to stop losses and then start buying the dollar index)
We all perfectly understand that the market is simply pumped up by the FED and we must understand one thing, that someday this will all stop and after that, there will be an immediate correction.
Of the three indices (DOW / SPY / NQ), only NASDAQ showed a historical maximum, so we can assume that it is the most volatile of its counterparts.
On July 29, the FOMC press conference will set the trend for the further development of the cycle of the dollar index.
As a trader, I will wait for a strong impulse from the big players. But as a person, I still believe that the dollar index will go up to a strong correction to the level of 95.50 or even 97.75, in which case the NASDAQ will fall to 9000 and SPX to 3000.
In any case, we only need to observe. And as my Jewish friend told me " I cant promise you the future but I can show you past" )))))
PS. here are the thoughts of the author and in no way force you to trade. Stay Safe.
Support channel by pushing like button and comment down below.

NAS Breakout of the down Channel in the up Channel - Next Week?Nas is hitting a major resistance area on it's rare down tend. I expect it to break out of this down trending channel and retest the same area (about where it is now) to go long. I would look for this On Monday next week. I don't think it will be happening today.
NQHello traders, here is the analysis from our team :
10647 BUY, HOLD
Let us know in the comment section below if you have any questions.😉
