✅NASDAQ WILL KEEP GROWING|LONG🚀
✅NASDAQ broke the key structure level
While trading in an uptrend
Which makes me bullish
And as the retest of the level is complete
Bullish continuation will follow
LONG🚀
✅Like and subscribe to never miss a new idea!✅
Nq100

NQ1! Nasdaq Ustec 100 ndx buy stop !According to my chart analysis , NQ1! Nasdaq Ustec 100 ndx buy stop ! Show strong signal to buy , buy max as you can .

NQ1! NAS100 NASDAQ 2023 FEB 13 WEEK
NQ1! NAS100 NASDAQ 2023 FEB 13 WEEK
Result for week of 06 Feb yielded 350pts in total from 2 trades.
Market testing breakout area 12140-12271.
Possible scenarios:
1) Long on test and accept of breakout area 12140-12271
2) Short on test and reject of 12140-12271
Volume Analysis:
Weekly = Ave vol down bar close toward low = minor weakness
Daily: Ave vol down bar close in middle = minor weakness
with demand
H4 = UHV down bar close off low = demand coming in
Price reaction levels:
Short on Test and Reject | Long on Test and Accept
13587 12987-12927
12811 12572-12465 Rotation
12140-12271 11603
Remember to Like and Follow if you find this useful.
Have a profitable trading week ahead.

NASDAQ 100 E-MINI FUTURES
NASDAQ 100 E-MINI FUTURES
Change in direction strongly with the formation of a strong and effective Double toop pattern and is proof of strong bear motion

NASDAQ 100 Futures short term goal
Trend: Up trend. Although the market failed going up to the next channel, it's still in the up trend channel. Better not to do a counter trade.
Symmetry: I use 12119 as a centerline for the symmetry. Let's look at a larger picture on the daily chart. 12119 is the key R/S line and also the 0.5 retracement line of prior swing from A to B, which I found meaningful most of the time. Below the centerline, the market is seen weaker; above the centerline, the market is seen stronger. Therefore, I will set my short-term price goal at 13485.
What if the up trend channel broke?
There are two situations.
1. The price is below the up trend channel but still above the centerline. → Uncertainties become more. Better wait for the price to be back to the channel or more clear signals to enter a trade.
2. The price drops even more below the centerline. → If the price drops below the center line, I see the symmetry broke. By then I will pay more attention to possible triangle forming.
**Not Financial Advice**
The information contained in this article is not intended as, and should not be understood as financial advice. You should take independent financial advice from a professional who is aware of the facts and circumstances of your individual situation.

NQ looking for a temp low on TuesdayWorking on my main SPX/ES update, so this will be quick.
Tomorrow am should produce a buyable low IMO followed by a good bounce.
From where I expect a first temp low by Tuesday, another bounce and down into the next week.
There is also a possibility of another move to above 13000 to even 13500+ in Mar time, but that was mentioned in my tonight's NQ/NDX update.
Have a good night

nasdaq 4 hour : if you have old sell you must you must hedge your old sell in 12300 area ,,,nasdaq after touch fibo61% can flyup to 13300 (see green fibo 161% on chart) 13300 is my upper target
scenario 2 = if big bad news come and nasdaq break big trendline and EMA200 daily (orange line) , it can go downer to 11600 , we must buy nasdaq above green arrow and hold them 10 day to new high =13300
prediction by me = in next 3 year we have bull market so i advice 90% looking for buy in deep and hold it to high
good luck

BABABABA appears to be in an expanding diagonal on the HTF.
Would expect the 5th to start after 1 more dip to bring the bears back only to slaughter them later.

NQ hit its C&H target last week and rratraced.We have successfully shorted on Fri and covered on Monday pre-market.
This is the chart I updated last night, the AH's session support was held to the penny, and now it's in the resistance zone.
It can extend to 12200, when SPX has a strong resistance at 4065-70.
It's a month-end close today, so it is very important to watch if it closes above or below Nov close.
We have a good R/R setup coming, not posting it on tradingview!

NDQIf S/R flip 12,170-12,200 then we should head turbo back to ATH 16,800. Could be in the most hated melt up the stock market ever seen.

Seek for Liquidity of Upper Levels?after late massive run past friday, nasdaq 100 is seeking for liquidity of upper levels.
i think 11817 make calm this indice in lower timeframe. then the gray box will be the first target of daily timeframe.
the bearish weekly orderblock has got a strong resistance which is after 3 hit we saw deep retracment.
ultimately, if price unable to pass the bearish weekly orderblock. we will see new lower low for seeking liquidity...

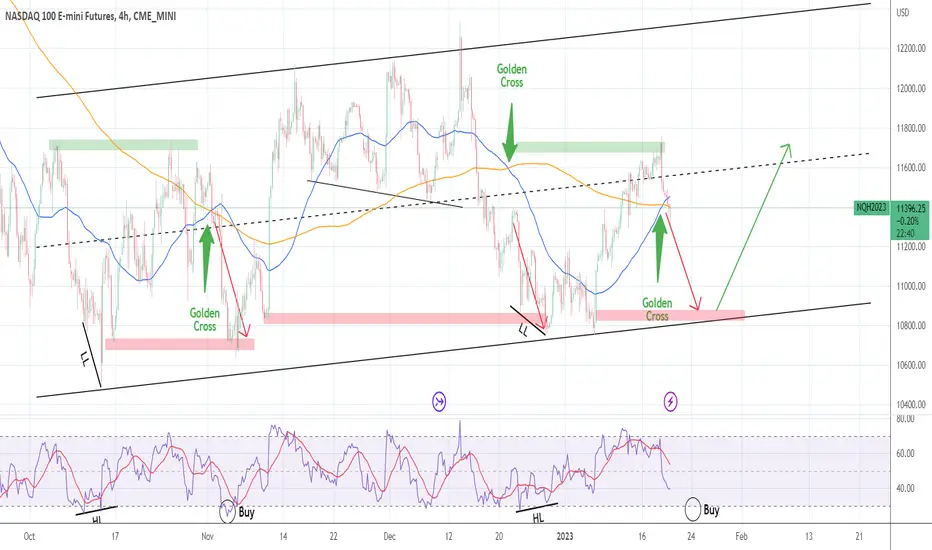
NASDAQ: Going lower, no confirmed buy yet.Nasdaq may have formed a 4H Golden Cross yesterday but contrary to its practical use, this bullish formation hasn't been a buy signal for the index as long as its has been trading inside the Channel Up of October. With 1D technicals neutral (RSI = 50.571, MACD = 37.810, ADX = 32.497), the price isn't restricted from trading lower despite the medium term bullish trend.
We see that the previous two Golden Crosses stopped near the bottom of the Channel Up, in particular a little under the level of the first HL of the bullish wave prior (see red zone). We can expect currently a Low around 10,900. Additionally, we can buy when the 4H RSI breaches 30.000 and becomes oversold.
## If you like our free content follow our profile to get more daily ideas. ##
## Comments and likes are greatly appreciated. ##
## Also DONATIONS through TradingView coins help our cause of increasing the daily ideas put here for free and reach out more traders like you. ##
Crypto as a MarketHello Birdies,
After a long time I did some fractal analysis and this time its between dotCom bubble and Crypto Market.
The fractals are pretty clear and yesterday we post Crypto MCap idea which also pointing towards 957B-997B area. Which is exactly where we are standing in fractals right now.
I am just waiting for the drawdown to buy BTC and enjoy the last bull ride before SUPER CRASH


NQ going into the CPI releaseHere is a quick update for those who follow my work and are not on our new site yet.
It's a critical turning point here, going into the CPI report, so I want to share my thinking, and hopefully, you won't get trapped regardless of tomorrow's am outcome.
I'm doing a more detailed analysis, but I will post a short version here.
First of all, I pointed out last week that the 11th should mark the important high.
Well, we got it!
Now, it doesn't have to be a daily high, but the daily closing high! So tomorrow can be an intra-day high with am spike.
I still think we could get a sort of OCT 13th CPI release action, but in another way - Gap and Dump!
If CPI will come in-line or a bit higher, let's say 6.6-6.7%, it can produce a knee-jerk reaction and sell from there.
There is a good fib confluence at 11600NQ for that move.
Our main target got hit today, and I warned yesterday, that it should see a higher number; it did!
The price has closed right at the resistance, so it satisfied the whole move up right there, in case it is just going to dump from the open
Support and resistances are on the chart.
I will also be doing SPX update and will post it at the end of the week here.
This chart should be enough for those looking for a good analysis out there without any commitment.
So don't be surprised if you see a big spike up, DO NOT chase it!
If it happens, I will use that opportunity to add to my short position

NDX Weekly Volatility Analysis 9-13 Jan 2023 NDX Weekly Volatility Analysis 9-13 Jan 2023
We can see that currently the implied volatility for this week is 3.83%
With this in mind, currently from ATR point of view we are located in the 81th percentile.
Based on this, we can expect that the current weekly candles ( from open to close ) are going to between:
*For calculations, I am using the data since 2022*
Bullish: 3.24% movement
Bearish: 3.3% movement
At the same time, with this data, we can make a top/bot channel which is going to contain inside the movement of this asset,
meaning that there is a 23.6% that our close of the weekly candle of this asset is going to be either above/below the next channel:
TOP: 11574
BOT: 10680
Taking into consideration the previous weekly high/low, currently for this candle there is :
36.46% probability we are going to touch previous weekly high
66.3% probability we are going to touch previous weekly low
Lastly, from the technical analysis point of view, currently from
Daily timeframe indicates -53.33% BEARISH trend from the moving averages index
Weekly timeframe indicates -80% BEARISH trend from the moving averages index
Monthly timeframe indicates -26.67% BEARISH trend from the moving averages index

NASDAQ 100 E-MINI FUTURESNASDAQ 100 E-MINI FUTURES
As we analyzed, we are still in a downward direction and achieved the first goal that we have made beforehand, and there is a high probability that it will achieve the second goal below it

Short-term plan for Nasdaq 100 FuturesPreparing 2 scenarios: one for long and the other for short.
Currently, the market is ranging mainly between 11180 and 10870.
If the price up breaks 11180 , we can expect our TP price to be at 11605.
On the way to our target price, we need to be aware of the level at 11490 and the downtrend line at the larger timescale that the levels could be potential resistances.
If the price down breaks 10870 , we can expect our TP price to be at 10556.
On the way to our target price, we need to be aware of the previous low at 10758 that could be a potential support.
**Not Financial Advice**
The information contained in this article is not intended as, and should not be understood as financial advice. You should take independent financial advice from a professional who is aware of the facts and circumstances of your individual situation.

NQ targets hit both sideWas looking for at least 1st target to get hit on the upside, and it did.
Also am support held where it supposed to
Going long on higher low soon
Setting up a bear trap here imo


NQ updateI was blocked for a week for simply mentioning my site I have it under my TradingView profile, so sorry for those who follow me here.
Here is a quick update of NQ and I will post ES later.
We should have this move down into the channel tomorrow.
One thing to note is that 29th (today) was a window for the low, so if tomorrow we see a good pullback, it will be a buy-able one
I will be posting less here as I have other commitments and really dont like being blocked for something I pay for.

NASDAQ 100 E-MINI FUTURESNASDAQ 100 E-MINI FUTURES
We also set strong goals that have been approached precisely and God willing to achieve them
