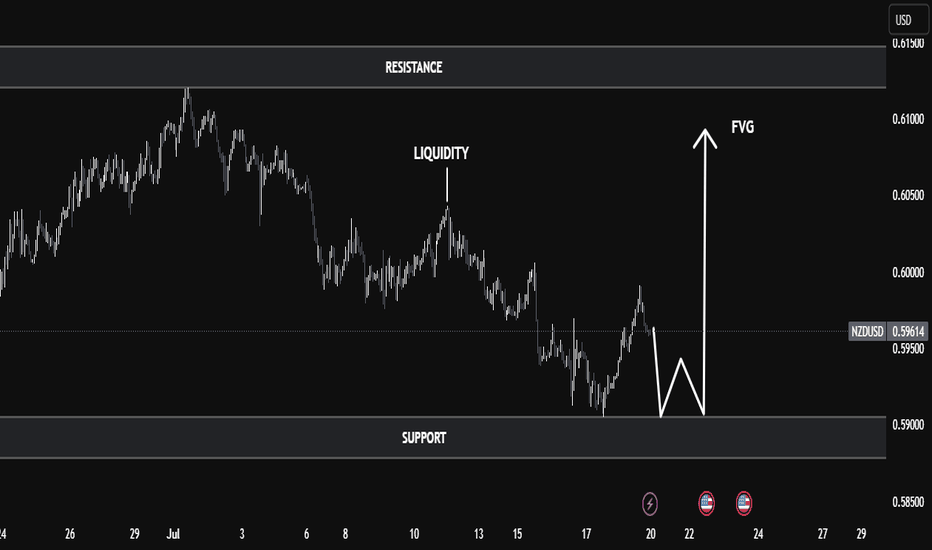
NZD/USD Technical Analysis | Smart Money Perspective🧠 NZD/USD Technical Analysis | Smart Money Perspective
On the current NZD/USD chart, price is trading around 0.5960, positioned between a clearly defined resistance zone (0.6130–0.6150) and a support zone (0.5890–0.5900).
We can observe the following key technical elements:
🔹 1. Liquidity Sweep
Price recently broke below the previous swing low near 0.5900, tapping into a pool of sell-side liquidity. This movement is commonly interpreted as a liquidity grab, where institutions manipulate price to trigger retail stop losses before reversing.
🔹 2. Double Bottom Formation
The chart indicates a potential double bottom forming at the support level — a classic accumulation signal. This pattern suggests buyers may be stepping in after liquidity has been taken out, anticipating a reversal.
🔹 3. Fair Value Gap (FVG)
An FVG (imbalance) is visible in the range of 0.5985 to 0.6015. This inefficiency was created by a sharp bearish move, leaving price action unbalanced. Price is now expected to retrace into this area to rebalance orders — a common smart money behavior.
🔹 4. Market Structure Outlook
If the double bottom confirms with a bullish break of structure above 0.5980, we could expect a continuation toward:
First Target: FVG zone around 0.6015
Second Target: Major resistance near 0.6150, where past distribution occurred.
✅ Conclusion
This setup combines key smart money concepts:
Liquidity grab below support
Accumulation phase at demand
FVG as target
Potential bullish market structure shift
Traders should monitor price action around the support zone for confirmation (e.g., bullish engulfing or break of short-term highs) before entering long positions. Targets remain at the FVG and resistance zones, but risk management is essential in case of a deeper sweep or macroeconomic catalyst.
Nsdusd
Nasdaq 100 Index 2-Hour Chart Analysis2-hour candlestick chart for the Nasdaq 100 Index (NDX) on the NASDAQ exchange. The chart spans from May to August, showcasing a significant upward trend with notable fluctuations. Key indicators include a recent price of 22,861.53, representing a 0.72% increase. The chart features technical analysis elements such as support and resistance levels, highlighted by green and red boxes, and a downward arrow suggesting a potential price movement.
NZDUSD I Current situation and how to trade itWelcome back! Let me know your thoughts in the comments!
** NZDUSD Analysis - Listen to video!
We recommend that you keep this pair on your watchlist and enter when the entry criteria of your strategy is met.
Please support this idea with a LIKE and COMMENT if you find it useful and Click "Follow" on our profile if you'd like these trade ideas delivered straight to your email in the future.
Thanks for your continued support!
NZDUSD FALLING between two strong levelsIn March this year, the price experienced a serious collapse. However, in the summer it pushed off the local support line and began to grow steadily.
During this growth, the price was able to make two important breakouts in a row. First, it broke through the support line that has existed on the chart since 2018. Secondly, it almost immediately broke through a strong historical level. By the way, the last breakout of this level was also in 2018. Then the price dropped. Now - began to grow
This level and line served as a good support for the price growth. However, in December, the price reached another strong level - the resistance level of 0.715. She touched it, carried it through and turned into a fall.
This movement is rather uneven, we could observe a sharp jump in the price down, and then the same sharp correction. Nevertheless, I am convinced that the price will continue to fall and come back to the support level.
Thus, I expect the final target - the support level 0.693.
Traders, if you like this idea or have your own opinion about it, write in the comments. I will be glad👩💻
NZD/USD BEARISH?NZDUSD is showing some indications it may want to make a move to downside in my opinion. It appears we could be moving away from a key "Supply" area, and judging the market structure, we may have a drop coming up soon. I am watching to see if price confirms and starts to head down.
As always I will look to setup a minimum 1-4 RRR on this trade like any other. Trade well. Trade your own analysis. Much love.
- DMMUZIK
ORBEX: Fed Injects Money in Repo Markets BUT Is That Really QE?Market participants seem to have taken Fed’s liquidity injections as QE, dragging dollar down.
Despite increasing the balance sheet, the Fed’s move should be really reassuring investors that funding pressures, at least in the short-term, are and will be lower.
Or, should it not?
Well, the demand for funding was slower than expected near year’s end. But is this perhaps because institutions are trying to shrink their balance sheets to hit yearly targets...?
Timestamps
USDCHF 2H 02:00
AUDUSD 2H 04:50
NZDUSD 2H 05:55
Trade safe
Stavros Tousios
Head of Investment Research
Orbex
This analysis is provided as general market commentary and does not constitute investment advice


