HDFC Accumulation Breakdown Setup?HDFC seems to be building an accumulation range with:
Range High: ₹1955
Range Low: ₹1908
Currently, price is consolidating within this zone. I'm biased to the sell side for now, expecting a potential breakdown below the ₹1908 level.
⚠️ No confirmation yet — it's a “wait and watch” scenario. A strong close below the range low could trigger momentum selling.
💬 What's your view on this setup?
Nse

CHAMBLFERT 1H Chart Analysis📉 CHAMBLFERT 1H Chart Analysis – Potential Breakdown Ahead
📅 Date: 7th June 2025
📊 Current Trend: Bearish continuation forming
⸻
🔍 Key Observations:
• 📌 Price: ₹539.90
• 🔻 Recent Drop: -2.27% today
• 🟩 1H FVG (Fair Value Gap): Indicates minor supply; price struggling to reclaim
• 🟥 30M FVG Above: Larger supply zone near ₹569.55, likely to act as strong resistance
📉 Bias:
Market structure shows weakness. If the price fails to reclaim the 1H FVG, further downside is likely.
🔽 Next potential targets: ₹525 → ₹510
📈 Upside Possibility?
Only if price reclaims ₹550+ and sustains above the 30M FVG zone, else sellers likely remain in control.
🧠 Strategy:
Consider short on retest of 1H FVG with SL above ₹550
Targeting downside levels as per risk-reward plan
📌 Disclaimer: This is a personal analysis, not financial advice. Do your own research before trading.

Crude. Daily Internal to External Range Liquidity. 06.06.25Covering the crude expansion from daily internal towards the first external range liquidity

NIFTY 1W forecast until August 2025India's stock market is correcting now. The correction will be short and not deep - just a normal retest of 24,500 but should not make a weekly close below 24,250 during the first half of June 2025.
A major bullrun will start in the middle of June 2025. Slowly at first, but explosive during summer.
It will find its top in August 2025 at the level of 27,800
Here I publish 1W charts, for weekly 1D charts check my profile for more ways to keep in touch

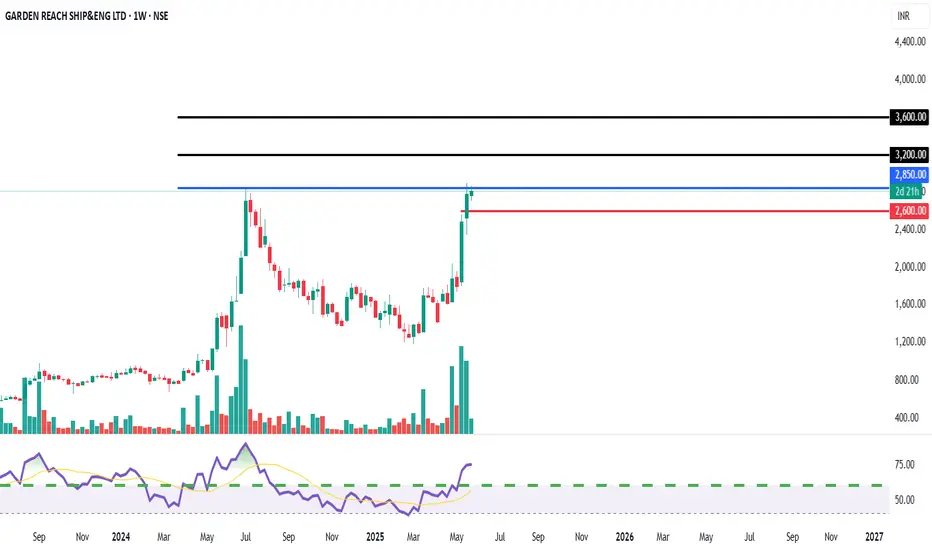
GARDEN REACH SHIPBUILDERS: Breakout Potential - Watch for EntryEntry Price:
Aggressive / Risk-Takers: Await a clear weekly close above ₹2,850, with sustained high volumes. Entry around ₹2,850-₹2,900.
Target Price 1 (T1): ₹3,200 (Based on previous highs and extension)
Target Price 2 (T2): ₹3,600 (Based on Fibonacci extensions and chart patterns)
Stop Loss (SL): ₹2,600 (Closing basis below immediate support, previous resistance)
DISCLAIMER
This report is prepared for informational purposes only and is not intended as a solicitation or an offer to buy or sell any securities. The information contained herein is based on technical analysis and publicly available data, which are believed to be reliable, but no guarantee is made as to their accuracy or completeness. Investing in equities involves risks, and investors should conduct their own due diligence and consult with a financial advisor before making any investment decisions. Past performance is not indicative of future results.
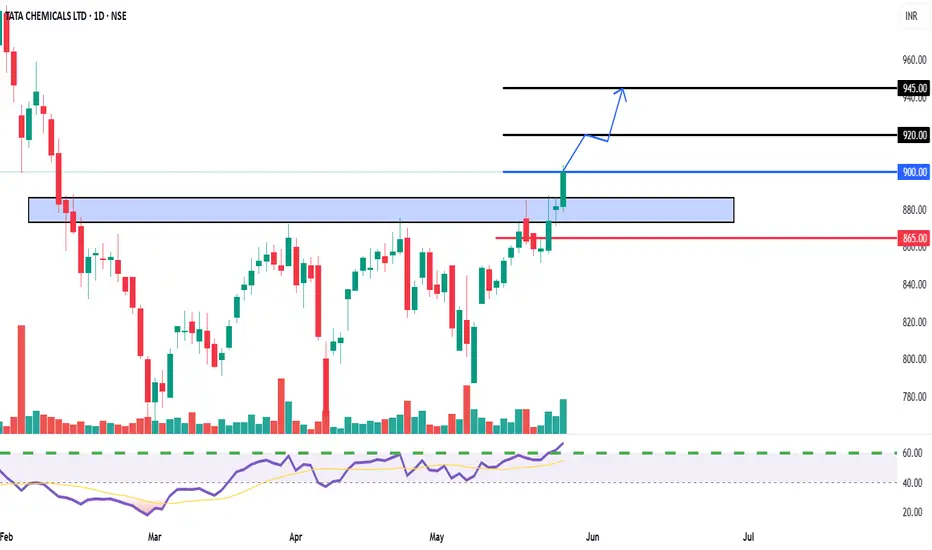
TATA CHEMICALS Breakout Confirmed - Buy on MomentumEntry Price:
Aggressive Entry: Around CMP (₹900-₹905)
Conservative Entry: On a retest of the breakout zone (₹875-₹885), if the opportunity arises.
Target Price 1 (T1): ₹920
Target Price 2 (T2): ₹945
Stop Loss (SL): ₹865 (Closing basis below the breakout zone and previous support)
Cautiously Bullish - Approaching Long-Term Resistance.Entry Zone: We recommend initiating a BUY position in TCGSRAAC only upon a decisive and sustained breakout above the major descending trendline (around ₹115 - ₹118). A daily close above this level with good volumes would be a strong confirmation.
Target 1 (T1): ₹125
Target 2 (T2): ₹132
Target 3 (T3): ₹140+ (If momentum sustains significantly post-breakout)
Stop Loss (SL): ₹105 (Strictly on a daily closing basis, for a breakout entry)
Rationale:
Long-Term Resistance Test: The stock is currently testing a significant descending trendline that has been acting as a major resistance for over several months. A successful breakout would signal a substantial shift in the long-term trend.
Support from Accumulation Zone: The stock has recently bounced from a strong demand zone around ₹80 - ₹88 (highlighted in blue), indicating underlying buying interest.
RSI Rising: The Relative Strength Index (RSI) has recently crossed above the 50-mark and is trending upwards, suggesting a buildup of bullish momentum as the price approaches resistance.
Volume Activity: While recent volumes are moderate, a significant surge in volume on the day of the potential breakout would be crucial for confirmation.
Risk-Reward: A breakout offers a good risk-reward setup for short-term traders, targeting the next set of resistance levels.
Key Risk: Failure to break above the major descending trendline could lead to a reversal and a fall back towards the ₹95 - ₹100 levels. A sustained daily close below ₹105 would invalidate the bullish breakout attempt.
Disclaimer: This report is for informational purposes only and does not constitute financial advice. Investors should conduct their own due diligence and consult with a qualified financial advisor before making any investment decisions. Equity investments are subject to market risks.
For Education Purposes Only

Nifty Weekly Outlook 26.05.2025Expecting bullish action on Nifty. Don't like the current weekly formation. If we moved down today would have been an ideal scenario but lets see.

Confirmed Breakout and Retest of Channel Resistance.Entry Zone: We recommend accumulating Rolex Rings Ltd. in the zone of ₹1,460 - ₹1,500. This area represents a crucial retest of the broken descending channel's resistance, now acting as strong support.
Target 1 (T1): ₹1,580
Target 2 (T2): ₹1,650
Target 3 (T3): ₹1,750 (Extended target if momentum remains strong)
Stop Loss (SL): ₹1,400 (Strictly on a daily closing basis)
Rationale:
Clear Channel Breakout: The stock has executed a textbook breakout from a well-defined multi-month descending channel. This indicates a significant shift in the underlying trend from bearish to bullish.
Successful Retest: Post-breakout, the price has pulled back to retest the upper boundary of the channel, which is a classic technical confirmation of a valid breakout. The retest appears to be holding, suggesting the former resistance has turned into reliable support.
Volume Confirmation: The initial breakout was supported by decent volumes, and the current consolidation/retest phase is occurring on relatively lower volumes, which is typical before the next leg up.
RSI Bullish Momentum: The Relative Strength Index (RSI) is maintaining its position above the 50-mark and shows bullish bias, supporting the upward price momentum.
Favorable Risk-Reward: The current entry point offers an attractive risk-reward profile for a short-term trade, with the potential upside significantly outweighing the downside risk defined by the stop-loss.
Key Risk: A decisive daily closing below ₹1,400 would invalidate the bullish breakout and retest pattern, suggesting a false breakout or a resumption of the downtrend. Strict adherence to the stop-loss is advised.
Disclaimer : This report is for informational purposes only and does not constitute financial advice. Investors should conduct their own due diligence and consult with a qualified financial advisor before making any investment decisions. Equity investments are subject to market risks.
For Education purposes only

Potential Reversal and Breakout Retest.Entry Zone: We recommend initiating a BUY position in AIA Engineering Ltd. around the current levels, ideally between ₹3,280 - ₹3,320. This area represents a retest of the recent trendline breakout.
Target 1 (T1): ₹3,400
Target 2 (T2): ₹3,480
Target 3 (T3): ₹3,580 (If momentum sustains above T2)
Stop Loss (SL): ₹3,200 (Strictly on a closing basis)
Trendline Breakout & Retest: The stock recently broke out of a significant descending trendline, indicating a potential end to the corrective phase. The current price action appears to be a successful retest of this broken trendline, which often acts as new support, presenting a lower-risk entry point.
Volume Confirmation: The initial breakout was accompanied by higher volumes, and while the retest phase has lower volumes (typical), sustained buying interest on subsequent upward moves would confirm strength.
RSI Bounce from Support: The Relative Strength Index (RSI) is showing a bounce from the 40-50 zone, indicating that momentum is regaining strength and potentially moving towards the bullish territory.
Positive Structure: The overall chart structure suggests that the stock is attempting to reverse its short-term downtrend and potentially resume its broader upward trajectory.
Favorable Risk-Reward: The current setup offers a reasonable risk-to-reward ratio for a short-term trade, with potential for upside gains outweighing the defined risk.
Key Risk: A close below ₹3,200 would invalidate the bullish retest scenario and could lead to further downside, bringing the previous lows into play. Traders should adhere strictly to the stop-loss.

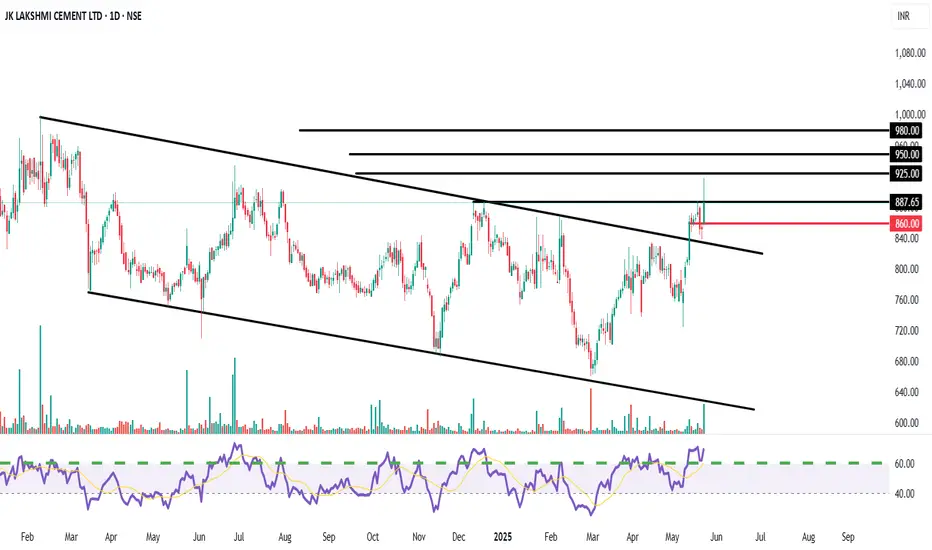
Potential Breakout from a Symmetrical Triangl Descending ChannelEntry Zone: We recommend initiating a BUY position in JK Lakshmi Cement around the current levels, ideally between ₹880 - ₹890. This considers the strong closing above the resistance trendline.
Target 1 (T1): ₹925
Target 2 (T2): ₹950
Target 3 (T3): ₹980 (If momentum sustains above T2)
Stop Loss (SL): ₹860 (Strictly on a closing basis)
Channel Breakout: The stock has decisively broken out of a multi-month descending channel/symmetrical triangle pattern, indicating a potential strong reversal from a corrective phase. This breakout appears to be supported by a noticeable pickup in volumes.
Key Resistance Breach: The stock has also managed to close above a significant horizontal resistance level around ₹880-885, which has acted as a hurdle multiple times in the past. A sustained move above this level confirms bullish intent.
RSI Strength: The Relative Strength Index (RSI) is showing strength, trading well above the 50-mark and moving towards the overbought zone, confirming increasing buying momentum.
Positive Price Action: The overall structure suggests accumulation at lower levels, and the current breakout could initiate the next leg of the uptrend.
Favorable Risk-Reward: The setup offers a compelling risk-reward profile for a short-term trade, with significant upside potential compared to the defined stop-loss.
Key Risk: A failure to sustain above the ₹880 level or a close below the ₹860 stop-loss would invalidate the bullish view and could lead to renewed selling pressure.
+460% potential profit with TVS MotorThis is my pick for buy&hold in 2025 in NSE India. A part of Nifty Auto Index which will drive its growth and lead the sector.
Strong chart from all angles. This is published as demo of what is available on my social media. You can find more through links in my profile.

Nifty weekly Walkthrough and Outlook for next week
Expecting a push down on Nifty towards the daily OB and then a massive displacement towards the upside. The draw remains the same. I want all the buyside of 5th December before another meltdown and second stage distribution on the monthly

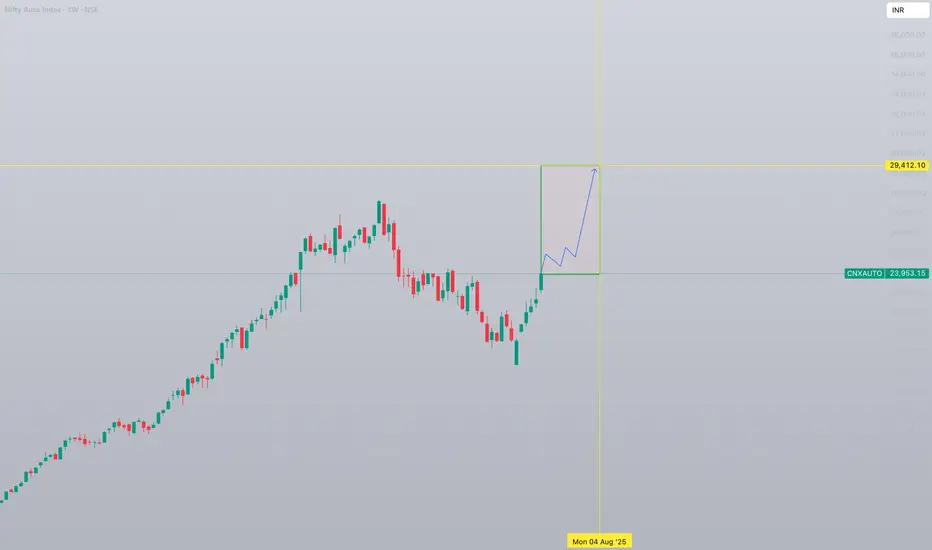
Nifty Auto Index 1W forecast until August 2025NSE Auto Index is in "discharge" mode. This will last until the level of 25000 followed by a sideways-cooldown movement.
Bullish structure will stay intact and the second bullrun will happen shortly.
Major correction/retest will happen after the breakout of previous all-time-high and setting a new ATH with a top at 29,500 in the beginning of August 2025.
OIL – Oil India Ltd | Target: ₹429.00🟢 Trade Details:
LTP: ₹417.30
Recommended Buy Range: ₹415.50 – ₹416.00
🎯 Target: ₹429.00
🛑 Stop Loss: ₹408.70
🔍 Technical Snapshot:
✅ Strong bullish candle with volume confirmation
✅ EMA crossover supports the uptrend (9 EMA > 13 EMA)
✅ RSI at 62.22 shows healthy momentum
✅ Breakout above previous range box visible on Daily & 1H TF
📊 BB %B at 0.82 – still room before overbought levels
💼 Strategy:
Suitable for short-term MTF holding (2–5 days)
Risk-Reward ~1:1.5
Trail SL to cost once ₹424+ is breached
Use smaller timeframes (15m / 1H) to confirm entry with volume
For Education Purposes Only

ITC is above breakout level and in bullish zone. ITC just crossed breakout level of 430.85 and it is expected to cross 460
and 500 level. Stop loss is 414.9 (Reversal level as mentioned by Indicator)

SBIN is above breakout levelSBIN just crossed breakout level of 792.25 and now in bullish zone. Expected to cross 850 level. Stop loss is 782.75 (Reversal level as mentioned on chart)
Note: This is not a buy/sell trade call. It is an analysis.

COFORGE 8100 CE – 29 MAY EXPIntraday to Short-Term Trade Setup (15min/1H)
🟢 Bullish Breakout | Volume Surge Confirmed
🛒 Entry Zone (Buy Above): ₹258–260
🔑 Confirmation on 15min candle close above ₹260 with volume
🎯 Targets:
T1: ₹276
T2: ₹306.50
T3: ₹353.90 (if momentum continues into next session)
🛑 Stop Loss:
SL: ₹230 (on candle close basis for 15min TF)
Conservative SL: ₹240 (if tighter risk appetite)
📊 Indicators Signal:
✅ 9 EMA crossed 26 EMA (momentum confirmation)
✅ RSI at 76.79 – strong, but watch for pullback
✅ BB %B at 0.89 – breakout zone
✅ Clean breakout above resistance (~₹230) with volume spike
✅ Pivot & resistance flip visible on both 15min & 1H TF
For Education Purposes Only

Equity Research - TATA MOTORS LTD 📈 Buy Zone: ₹670.50 – ₹680.30
🎯 Target: ₹740.00
🛑 Stop Loss: ₹641.70
💹 CMP: ₹680.30
Technical Highlights:
✅ Bullish volume spike
✅ RSI above 60 – strong momentum
✅ Price above 20EMA & 50EMA
✅ Breakout and retest on 15m & 1H chart
✅ Good risk-reward setup
📊 Strategy: Wait for confirmation candle on 15min TF above ₹681 for entry.
📉 Stop loss below recent swing low at ₹641.70.
For Education Purposes Only

POWERGRID – Breakout Setup with Volume Spike📍 Entry Zone: ₹310.10 – ₹311.10
🎯 Target: ₹330.00
🛑 Stoploss: ₹302.00
📈 RSI has crossed above 60, volume confirms breakout momentum (🔵 arrow), and price is supported above key EMAs.
🔍 Strong bullish structure with clear higher lows and a clean breakout candle. Momentum shift confirmed with increasing volume.
For Education Purposes Only

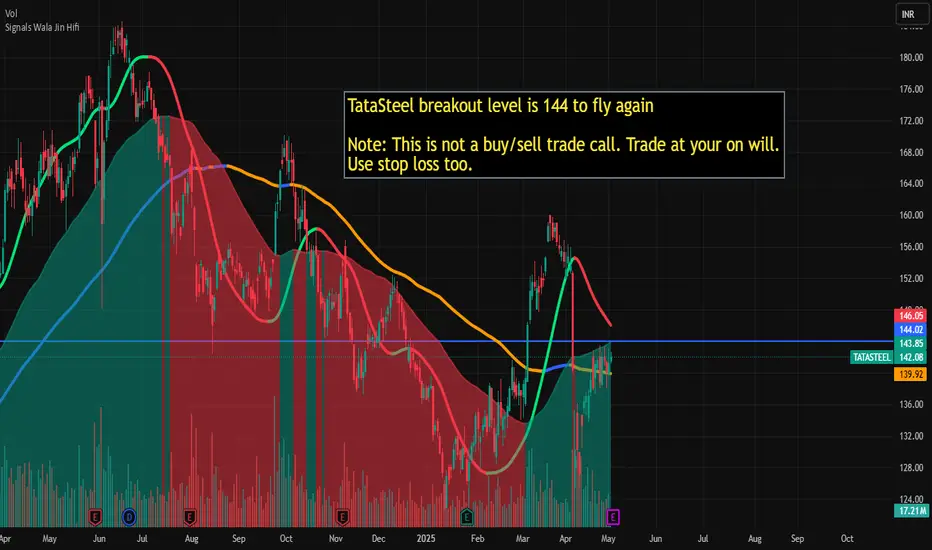
Tata Steel breakout level is 144 for fly againTataSteel breakout level is 144 to fly again
Note: This is not a buy/sell trade call. Trade at your on will. Use stop loss too.
TCS is into Bearish zone, Could drop to 2800TCS is entered into Bearish zone on Monthly Chart and It could drop tp 2800 and below levels.
Note: This is not a buy/sell trade call. Trade at your own will and analysis. Use stop loss too.

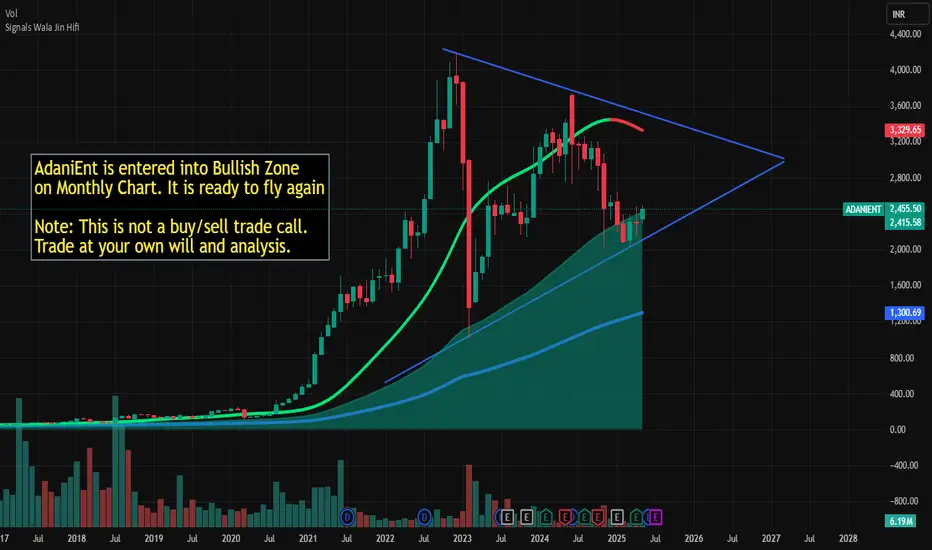
AdaniEnt is ready to fly againAdaniEnt is entered into Bullish Zone
on Monthly Chart. It is ready to fly again
Note: This is not a buy/sell trade call.
Trade at your own will and analysis.