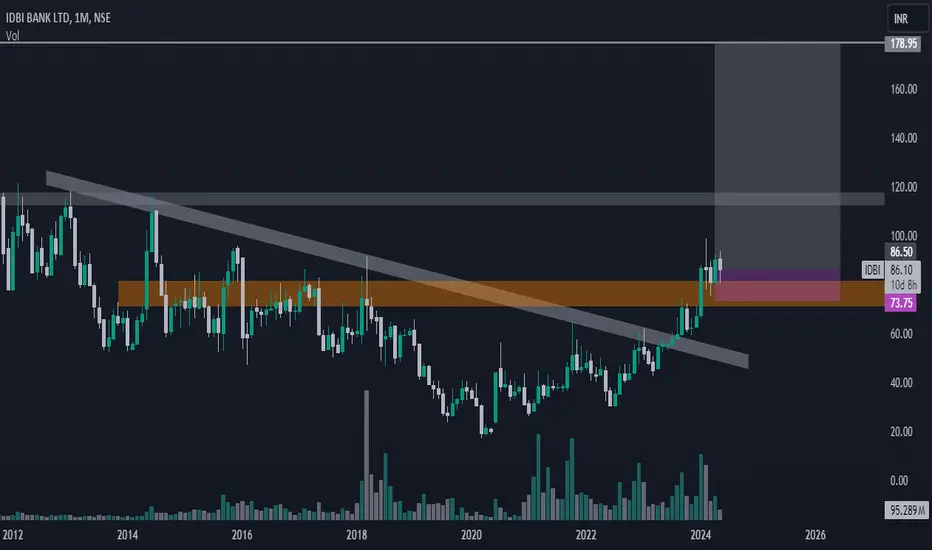
IDBI BANK LTDThis stock breakout major trendline and resistance level so future up move will come
this is only for educational purpose
Nse
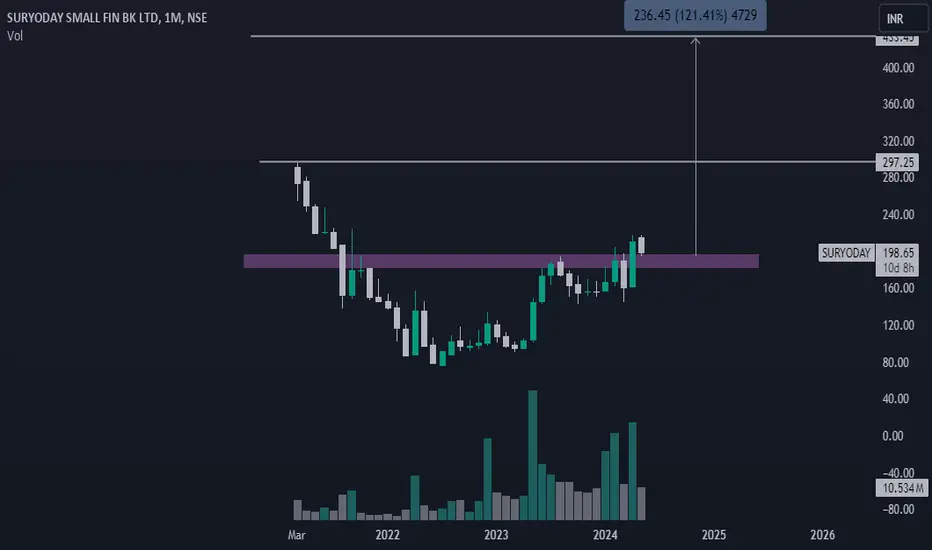
Suryoday small fin bankThis stock breakout cup and handle pattern so stock gave good opportunity for swing trade
this is only for educational purpose
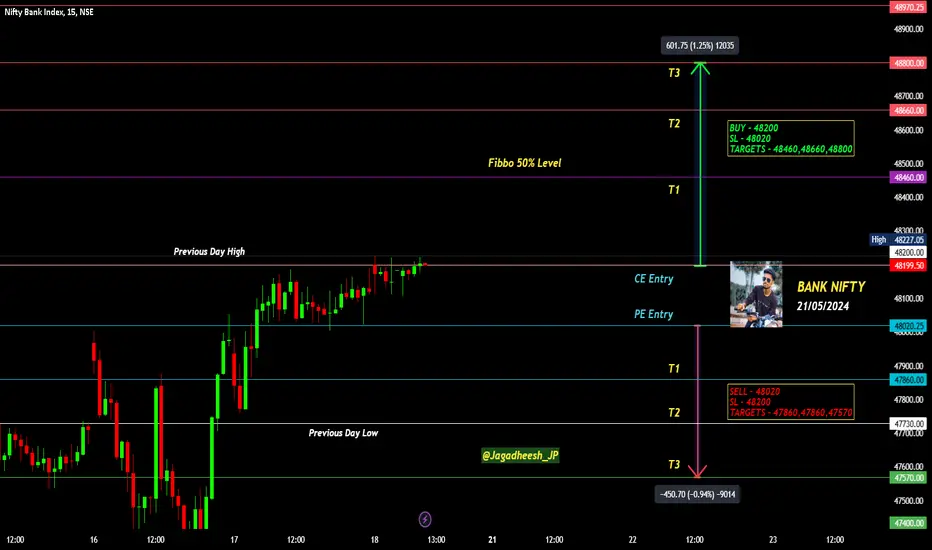
BANK NIFTY INTRADAY LEVELS FOR 21 MAY 2024BUY ABOVE - 48200
SL - 48020
TARGETS - 48460,48660,48800
SELL BELOW - 48020
SL - 48200
TARGETS - 47860,47860,47570
NO TRADE ZONE - 48020 to 48200
Previous Day High - 48200
Previous Day Low - 47730
Based on price action major support & resistance's are here, the red lines acts as resistances, the green lines acts as supports. If the price breaks the support/resistance, it will move to the next support/resistance line. White lines indicates previous day high & low, high acts as a resistance & low acts as a support for next day.
Trendlines are also significant to price action. If the price is above/below the trendlines, can expect an UP/DOWN with aggressive move.
Please NOTE: this levels are for intraday trading only.
Disclaimer - All information on this page is for educational purposes only,
we are not SEBI Registered, Please consult a SEBI registered financial advisor for your financial matters before investing And taking any decision. We are not responsible for any profit/loss you made.
Request your support and engagement by liking and commenting & follow to provide encouragement
HAPPY TRADING 👍
MUTHOOTFIN ON WEEKLY RESISTANCEMUTHOOTFIN has reached a crucial resistance level on the chart. The price has respected this highlighted zone, and we should watch closely for a valid reversal or breakout confirmation. Given that the previous run encountered significant selling pressure at this point, careful attention to price action on lower timeframes is necessary for confirmation. A breakout above the resistance will invalidate the bearish outlook.

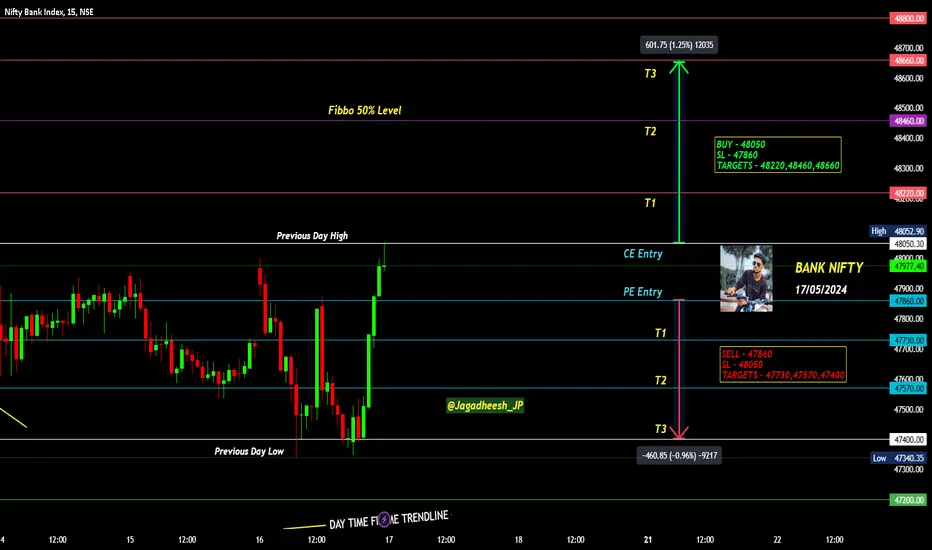
BANK NIFTY INTRADAY LEVELS FOR 17 MAY 2024BUY ABOVE - 48050
SL - 47860
TARGETS - 48220,48460,48660
SELL BELOW - 47860
SL - 48050
TARGETS - 47730,47570,47400
NO TRADE ZONE - 47860 to 48050
Previous Day High - 48050
Previous Day Low - 47400
Based on price action major support & resistance's are here, the red lines acts as resistances, the green lines acts as supports. If the price breaks the support/resistance, it will move to the next support/resistance line. White lines indicates previous day high & low, high acts as a resistance & low acts as a support for next day.
Trendlines are also significant to price action. If the price is above/below the trendlines, can expect an UP/DOWN with aggressive move.
Please NOTE: this levels are for intraday trading only.
Disclaimer - All information on this page is for educational purposes only,
we are not SEBI Registered, Please consult a SEBI registered financial advisor for your financial matters before investing And taking any decision. We are not responsible for any profit/loss you made.
Request your support and engagement by liking and commenting & follow to provide encouragement
HAPPY TRADING 👍
NIFTY INTRADAY LEVELS FOR 17 MAY 2024BUY ABOVE - 22420
SL - 22350
TARGETS - 22470,22510,22550
SELL BELOW - 22350
SL - 22300
TARGETS - 22300,22230,22160
NO TRADE ZONE - 22350 to 22420
Previous Day High - 22420
Previous Day Low - 22060
Based on price action major support & resistance's are here, the red lines acts as resistances, the green lines acts as supports. If the price breaks the support/resistance, it will move to the next support/resistance line. White lines indicates previous day high & low, high acts as a resistance & low acts as a support for next day.
Trendlines are also significant to price action. If the price is above/below the trendlines, can expect an UP/DOWN with aggressive move.
Please NOTE: this levels are for intraday trading only.
Disclaimer - All information on this page is for educational purposes only,
we are not SEBI Registered, Please consult a SEBI registered financial advisor for your financial matters before investing And taking any decision. We are not responsible for any profit/loss you made.
Request your support and engagement by liking and commenting & follow to provide encouragement
HAPPY TRADING 👍

INFY ASCENDING TRIANGLE IDENTIFIEDINFY has formed an ascending triangle pattern on the hourly chart. A bullish candle has closed just above the resistance level, indicating potential upward movement. However, for a confirmed bullish trend, we await a clear breakout above the resistance. It's essential to note that a bearish breakout would invalidate this bullish projection, emphasizing the need for cautious observation.

BANK NIFTY INTRADAY LEVELS 16 MAY 2024BUY ABOVE - 47730
SL - 47450
TARGETS - 47930,48050,48220
SELL BELOW - 47570
SL - 47730
TARGETS - 47400,47200,47000
NO TRADE ZONE - 47570 to 47730
Previous Day High - 47930
Previous Day Low - 47570
Based on price action major support & resistance's are here, the red lines acts as resistances, the green lines acts as supports. If the price breaks the support/resistance, it will move to the next support/resistance line. White lines indicates previous day high & low, high acts as a resistance & low acts as a support for next day.
Trendlines are also significant to price action. If the price is above/below the trendlines, can expect an UP/DOWN with aggressive move.
Please NOTE: this levels are for intraday trading only.
Disclaimer - All information on this page is for educational purposes only,
we are not SEBI Registered, Please consult a SEBI registered financial advisor for your financial matters before investing And taking any decision. We are not responsible for any profit/loss you made.
Request your support and engagement by liking and commenting & follow to provide encouragement
HAPPY TRADING 👍

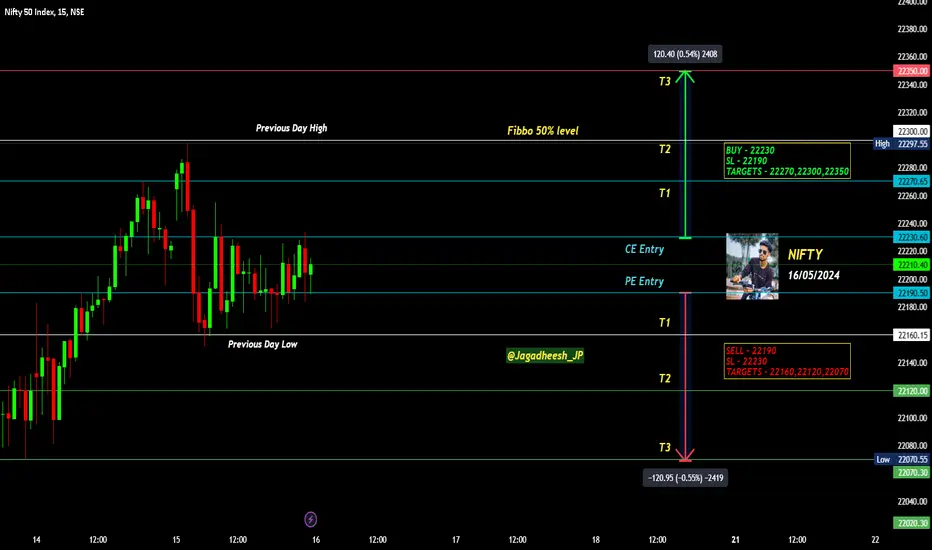
NIFTY INTRADAY LEVELS FOR 16 MAY 2024BUY ABOVE - 22230
SL - 22190
TARGETS - 22270,22300,22350
SELL BELOW - 22190
SL - 22230
TARGETS - 22160,22120,22070
NO TRADE ZONE - 22190 to 22230
Previous Day High - 22300
Previous Day Low - 22160
Based on price action major support & resistance's are here, the red lines acts as resistances, the green lines acts as supports. If the price breaks the support/resistance, it will move to the next support/resistance line. White lines indicates previous day high & low, high acts as a resistance & low acts as a support for next day.
Trendlines are also significant to price action. If the price is above/below the trendlines, can expect an UP/DOWN with aggressive move.
Please NOTE: this levels are for intraday trading only.
Disclaimer - All information on this page is for educational purposes only,
we are not SEBI Registered, Please consult a SEBI registered financial advisor for your financial matters before investing And taking any decision. We are not responsible for any profit/loss you made.
Request your support and engagement by liking and commenting & follow to provide encouragement
HAPPY TRADING 👍
AXISBANK: BULLISH BREAKOUT AND POTENTIAL REVERSAL PATTERNAXISBANK has broken out bullish from a bearish channel, suggesting a potential rally ahead. Additionally, there's a chance of an inverted head and shoulders pattern forming. However, confirmation of this pattern requires waiting for a bullish breakout at the key level.

BANK NIFTY INTRADAY LEVELS FOR 15/05/2024BUY ABOVE - 47900
SL - 47730
TARGETS - 48050,48220,48460
SELL BELOW - 47730
SL - 47900
TARGETS - 47560,47400,47200
NO TRADE ZONE - 47730 to 47900
Previous Day High - 47900
Previous Day Low - 47570
Based on price action major support & resistance's are here, the red lines acts as resistances, the green lines acts as supports. If the price breaks the support/resistance, it will move to the next support/resistance line. White lines indicates previous day high & low, high acts as a resistance & low acts as a support for next day.
Trendlines are also significant to price action. If the price is above/below the trendlines, can expect an UP/DOWN with aggressive move.
Please NOTE: this levels are for intraday trading only.
Disclaimer - All information on this page is for educational purposes only,
we are not SEBI Registered, Please consult a SEBI registered financial advisor for your financial matters before investing And taking any decision. We are not responsible for any profit/loss you made.
Request your support and engagement by liking and commenting & follow to provide encouragement
HAPPY TRADING 👍

NIFTY INTRADAY LEVELS FOR 15/05/2024BUY ABOVE - 22300
SL - 22220
TARGETS - 22350,22420,22470
SELL BELOW - 22180
SL - 22220
TARGETS - 22130,22070,22020
NO TRADE ZONE - 22180 to 22270
Previous Day High - 22270
Previous Day Low - 22070
Based on price action major support & resistance's are here, the red lines acts as resistances, the green lines acts as supports. If the price breaks the support/resistance, it will move to the next support/resistance line. White lines indicates previous day high & low, high acts as a resistance & low acts as a support for next day.
Trendlines are also significant to price action. If the price is above/below the trendlines, can expect an UP/DOWN with aggressive move.
Please NOTE: this levels are for intraday trading only.
Disclaimer - All information on this page is for educational purposes only,
we are not SEBI Registered, Please consult a SEBI registered financial advisor for your financial matters before investing And taking any decision. We are not responsible for any profit/loss you made.
Request your support and engagement by liking and commenting & follow to provide encouragement
HAPPY TRADING 👍

SWING IDEA - SYRMA SGSA potential swing trade opportunity in Syrma SGS , a notable player in the electronics manufacturing industry.
Reasons are listed below :
The stock exhibited resilience as it rebounded strongly from the 450-500 support zone, suggesting a false breakdown and indicating underlying strength.
A hammer candlestick formation on the weekly timeframe signals a potential reversal, hinting at a shift from bearish sentiment to bullish momentum.
Finding support at the 0.5 Fibonacci level further bolsters the bullish outlook, providing a solid foundation for potential upward movement.
The 50-period Exponential Moving Average (EMA) on the weekly chart acts as additional support, reinforcing the bullish bias.
Notable increase in trading volumes reflects heightened market interest and potential accumulation by investors, adding weight to the bullish case.
Syrma SGS has demonstrated a pattern of higher highs, indicating a trend of increasing bullish momentum and reinforcing the potential for upward movement.
Target - 570 // 670
Stoploss - weekly close below 448
DISCLAIMER -
Decisions to buy, sell, hold or trade in securities, commodities and other investments involve risk and are best made based on the advice of qualified financial professionals. Any trading in securities or other investments involves a risk of substantial losses. The practice of "Day Trading" involves particularly high risks and can cause you to lose substantial sums of money. Before undertaking any trading program, you should consult a qualified financial professional. Please consider carefully whether such trading is suitable for you in light of your financial condition and ability to bear financial risks. Under no circumstances shall we be liable for any loss or damage you or anyone else incurs as a result of any trading or investment activity that you or anyone else engages in based on any information or material you receive through TradingView or our services.
@visionary.growth.insights

NIFTY50 INDEX BREAKOUT CONFIRMED, WHAT'S NEXT?The NIFTY50 has indeed followed the projection I made last week, confirming the breakout on the channel we identified. Now, I anticipate a continuation of the bearish trend towards the lower support level. This retracement should provide a significant pullback from the current bullish momentum observed on the hourly timeframe.

BANK NIFTY INTRADAY LEVELS FOR 14 MAY 2024BUY ABOVE - 47900
SL - 47730
TARGETS - 48050,48220,48460
SELL BELOW - 47730
SL - 47900
TARGETS - 47560,47400,47200
NO TRADE ZONE - 47730 to 47900
Previous Day High - 47900
Previous Day Low - 47000
Based on price action major support & resistance's are here, the red lines acts as resistances, the green lines acts as supports. If the price breaks the support/resistance, it will move to the next support/resistance line. White lines indicates previous day high & low, high acts as a resistance & low acts as a support for next day.
Trendlines are also significant to price action. If the price is above/below the trendlines, can expect an UP/DOWN with aggressive move.
Please NOTE: this levels are for intraday trading only.
Disclaimer - All information on this page is for educational purposes only,
we are not SEBI Registered, Please consult a SEBI registered financial advisor for your financial matters before investing And taking any decision. We are not responsible for any profit/loss you made.
Request your support and engagement by liking and commenting & follow to provide encouragement
HAPPY TRADING 👍

NIFTY INTRADAY LEVELS FOR 14 MAY 2024BUY ABOVE - 22130
SL - 22070
TARGETS - 22180,22240,22300
SELL BELOW - 22070
SL - 22130
TARGETS - 22020,21960,21900
NO TRADE ZONE - 22070 to 22130
Previous Day High - 22130
Previous Day Low - 21820
Based on price action major support & resistance's are here, the red lines acts as resistances, the green lines acts as supports. If the price breaks the support/resistance, it will move to the next support/resistance line. White lines indicates previous day high & low, high acts as a resistance & low acts as a support for next day.
Trendlines are also significant to price action. If the price is above/below the trendlines, can expect an UP/DOWN with aggressive move.
Please NOTE: this levels are for intraday trading only.
Disclaimer - All information on this page is for educational purposes only,
we are not SEBI Registered, Please consult a SEBI registered financial advisor for your financial matters before investing And taking any decision. We are not responsible for any profit/loss you made.
Request your support and engagement by liking and commenting & follow to provide encouragement
HAPPY TRADING 👍

ICICIBANK POTENTIAL REVERSAL AHEAD WITH THIS PATTERNICICIBANK has experienced a bullish breakout followed by a pullback within the confines of a bull flag pattern. The recent reversal, respecting the upper boundary, suggests a potential retracement within the current bullish trend. Should the breakout occur as anticipated on the chart, a price decline towards the highlighted key level is conceivable.

TATAMOTORS BACK ON DAILY RESISTANCE, WILL IT GO ABOVE 1150 NEXT?TATAMOTORS might establish a fresh peak provided there's ample volume to breach the highlighted resistance zone. Therefore, it's prudent to monitor this level closely for either a breakout or confirmation of a reversal, which will determine the stock's future trajectory. A decisive breach of the resistance could propel it to a new high, potentially surpassing 1155. Conversely, a bearish reversal and breakout below the floor price of 945 would negate the bullish outlook.

BANK NIFTY INTRADAY LEVELS FOR 13/05/2024BUY ABOVE - 47560
SL - 47400
TARGETS - 47730,47900,48050
SELL BELOW - 47400
SL - 47560
TARGETS - 47200,47000,46800
NO TRADE ZONE - 47400 to 47560
Previous Day High - 47900
Previous Day Low - 47400
Based on price action major support & resistance's are here, the red lines acts as resistances, the green lines acts as supports. If the price breaks the support/resistance, it will move to the next support/resistance line. White lines indicates previous day high & low, high acts as a resistance & low acts as a support for next day.
Trendlines are also significant to price action. If the price is above/below the trendlines, can expect an UP/DOWN with aggressive move.
Please NOTE: this levels are for intraday trading only.
Disclaimer - All information on this page is for educational purposes only,
we are not SEBI Registered, Please consult a SEBI registered financial advisor for your financial matters before investing And taking any decision. We are not responsible for any profit/loss you made.
Request your support and engagement by liking and commenting & follow to provide encouragement
HAPPY TRADING 👍

NIFTY INTRADAY LEVELS FOR 13/05/2024BUY ABOVE - 22070
SL - 22020
TARGETS - 22120,22180,22240
SELL BELOW - 22020
SL - 22070
TARGETS - 21960,21900,21850
NO TRADE ZONE - 22020 to 22070
Previous Day High - 22120
Previous Day Low - 21960
Based on price action major support & resistance's are here, the red lines acts as resistances, the green lines acts as supports. If the price breaks the support/resistance, it will move to the next support/resistance line. White lines indicates previous day high & low, high acts as a resistance & low acts as a support for next day.
Trendlines are also significant to price action. If the price is above/below the trendlines, can expect an UP/DOWN with aggressive move.
Please NOTE: this levels are for intraday trading only.
Disclaimer - All information on this page is for educational purposes only,
we are not SEBI Registered, Please consult a SEBI registered financial advisor for your financial matters before investing And taking any decision. We are not responsible for any profit/loss you made.
Request your support and engagement by liking and commenting & follow to provide encouragement
HAPPY TRADING 👍

SBIN MAY LOOK FOR A CORRECTION AHEADSBIN has been on a robust bullish streak, indicating a possible retracement or correction phase in the near future following its recent rally. There's potential for the price to consolidate within a formed channel before potentially breaking out bearishly, supporting a bearish outlook.

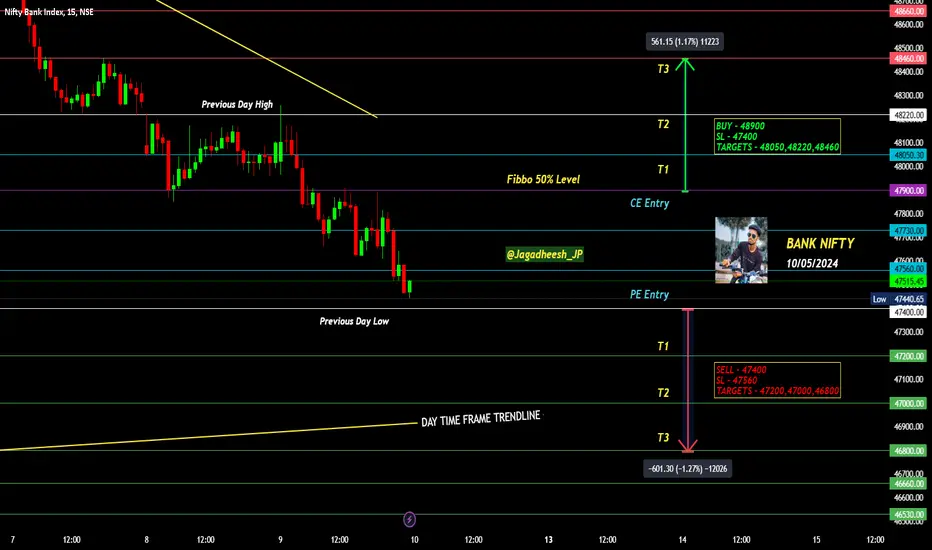
BANK NIFTY INTRADAY LEVELS FOR 10/05/2024BUY ABOVE - 48900
SL - 47400
TARGETS - 48050,48220,48460
SELL BELOW - 47400
SL - 47560
TARGETS - 47200,47000,46800
NO TRADE ZONE - 47400 to 47900
Previous Day High - 48220
Previous Day Low - 47400
Based on price action major support & resistance's are here, the red lines acts as resistances, the green lines acts as supports. If the price breaks the support/resistance, it will move to the next support/resistance line. White lines indicates previous day high & low, high acts as a resistance & low acts as a support for next day.
Trendlines are also significant to price action. If the price is above/below the trendlines, can expect an UP/DOWN with aggressive move.
Please NOTE: this levels are for intraday trading only.
Disclaimer - All information on this page is for educational purposes only,
we are not SEBI Registered, Please consult a SEBI registered financial advisor for your financial matters before investing And taking any decision. We are not responsible for any profit/loss you made.
Request your support and engagement by liking and commenting & follow to provide encouragement
HAPPY TRADING 👍
NIFTY INTRADAY LEVELS FOR 10/05/2024BUY ABOVE - 22070
SL - 22020
TARGETS - 22120,22180,22240
SELL BELOW - 21960
SL - 22020
TARGETS - 21900,21850,21800
NO TRADE ZONE - 21960 to 22070
Previous Day High - 22300
Previous Day Low - 21960
Based on price action major support & resistance's are here, the red lines acts as resistances, the green lines acts as supports. If the price breaks the support/resistance, it will move to the next support/resistance line. White lines indicates previous day high & low, high acts as a resistance & low acts as a support for next day.
Trendlines are also significant to price action. If the price is above/below the trendlines, can expect an UP/DOWN with aggressive move.
Please NOTE: this levels are for intraday trading only.
Disclaimer - All information on this page is for educational purposes only,
we are not SEBI Registered, Please consult a SEBI registered financial advisor for your financial matters before investing And taking any decision. We are not responsible for any profit/loss you made.
Request your support and engagement by liking and commenting & follow to provide encouragement
HAPPY TRADING 👍
