MOTILAL OSWAL FIN long setupcan go long near marked suport say 845s and keep stat 790S ,
GROWING demand for the products in the sector and improving results
Nse

CENTM ELECT LONG on dips near 1450 SL 1330it has 2 decent supports , if one goes will try to nail the other .

GATI long 160 add 150sl need to be close below 143
despite break high with above average volumes it kept retracing back . maybe third times the charm

GSFC on dip to 198 and 188 addsl below 163 closing basis , patience will be required , enter on high probability zones only

HEMISPHERE Prop abv 138need a break above 138 for next run , decent land bank in kitty , can it move ?


BANK NIFTY INTRADAY LEVELS FOR 29/02/2024BUY ABOVE - 46100
SL - 45930
TARGETS - 46300,46450,46560
SELL BELOW - 45930
SL - 46100
TARGETS - 45730,45570,45330
NO TRADE ZONE - 45930 to 46100
Previous Day High - 46750
Previous Day Low - 45930
Based on price action major support & resistance's are here, the red lines acts as resistances, the green lines acts as supports. If the price breaks the support/resistance, it will move to the next support/resistance line. White lines indicates previous day high & low, high acts as a resistance & low acts as a support for next day.
Trendlines are also significant to price action. If the price is above/below the trendlines, can expect an UP/DOWN with aggressive move.
Please NOTE: this levels are for intraday trading only.
Disclaimer - All information on this page is for educational purposes only,
we are not SEBI Registered, Please consult a SEBI registered financial advisor for your financial matters before investing And taking any decision. We are not responsible for any profit/loss you made.
Request your support and engagement by liking and commenting & follow to provide encouragement
HAPPY TRADING 👍

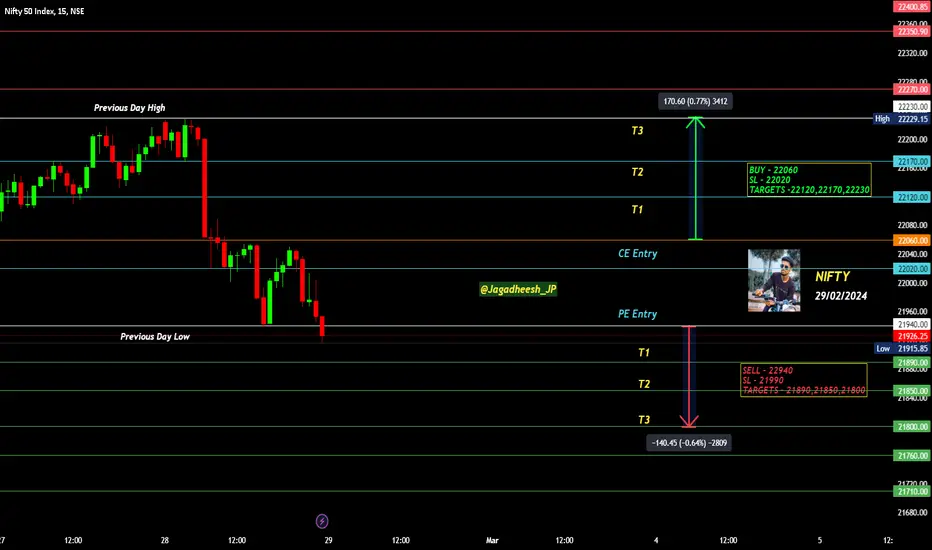
NIFTY INTRADAY LEVELS FOR 29/02/2024BUY ABOVE - 22060
SL - 22020
TARGETS -22120,22170,22230
SELL BELOW - 22940
SL - 21990
TARGETS - 21890,21850,21800
NO TRADE ZONE - 21940 to 22060
Previous Day High - 22230
Previous Day Low - 21940
Based on price action major support & resistance's are here, the red lines acts as resistances, the green lines acts as supports. If the price breaks the support/resistance, it will move to the next support/resistance line. White lines indicates previous day high & low, high acts as a resistance & low acts as a support for next day.
Trendlines are also significant to price action. If the price is above/below the trendlines, can expect an UP/DOWN with aggressive move.
Please NOTE: this levels are for intraday trading only.
Disclaimer - All information on this page is for educational purposes only,
we are not SEBI Registered, Please consult a SEBI registered financial advisor for your financial matters before investing And taking any decision. We are not responsible for any profit/loss you made.
Request your support and engagement by liking and commenting & follow to provide encouragement
HAPPY TRADING 👍
NIFTY INTRADAY LEVELS FOR 28/02/2024BUY ABOVE - 22210
SL - 22170
TARGETS -22250,22300,22350
SELL BELOW - 22170
SL - 22210
TARGETS - 22120,22070,22020
NO TRADE ZONE - 22170 to 22210
Previous Day High - 22210
Previous Day Low - 22070
Based on price action major support & resistance's are here, the red lines acts as resistances, the green lines acts as supports. If the price breaks the support/resistance, it will move to the next support/resistance line. White lines indicates previous day high & low, high acts as a resistance & low acts as a support for next day.
Trendlines are also significant to price action. If the price is above/below the trendlines, can expect an UP/DOWN with aggressive move.
Please NOTE: this levels are for intraday trading only.
Disclaimer - All information on this page is for educational purposes only,
we are not SEBI Registered, Please consult a SEBI registered financial advisor for your financial matters before investing And taking any decision. We are not responsible for any profit/loss you made.
Request your support and engagement by liking and commenting & follow to provide encouragement
HAPPY TRADING 👍

BANK NIFTY INTRADAY LEVELS FOR 28/02/2024BUY ABOVE - 46700
SL - 46560
TARGETS - 46900,47080,47200
SELL BELOW - 46450
SL - 46560
TARGETS - 46300,46450,46300
NO TRADE ZONE - 46560 to 46700
Previous Day High - 46700
Previous Day Low - 46300
Based on price action major support & resistance's are here, the red lines acts as resistances, the green lines acts as supports. If the price breaks the support/resistance, it will move to the next support/resistance line. White lines indicates previous day high & low, high acts as a resistance & low acts as a support for next day.
Trendlines are also significant to price action. If the price is above/below the trendlines, can expect an UP/DOWN with aggressive move.
Please NOTE: this levels are for intraday trading only.
Disclaimer - All information on this page is for educational purposes only,
we are not SEBI Registered, Please consult a SEBI registered financial advisor for your financial matters before investing And taking any decision. We are not responsible for any profit/loss you made.
Request your support and engagement by liking and commenting & follow to provide encouragement
HAPPY TRADING 👍

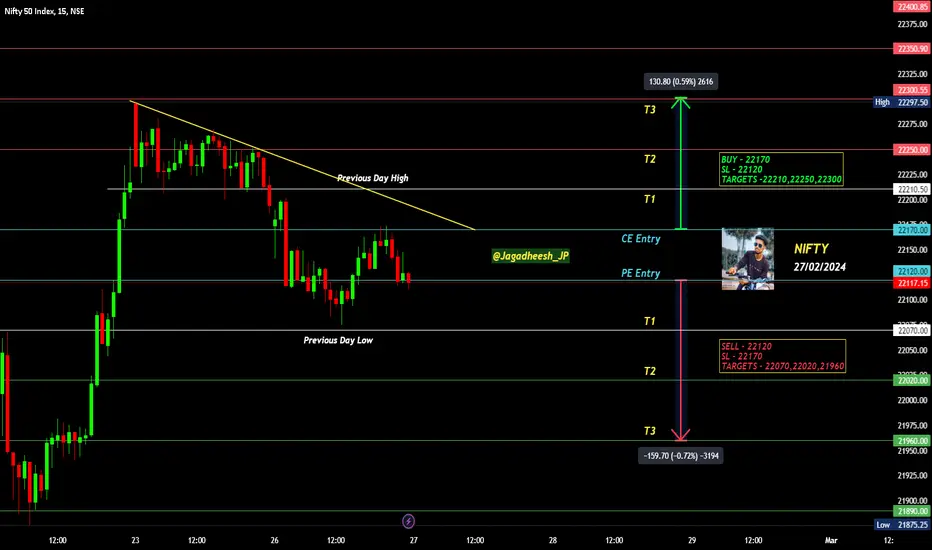
NIFTY INTRADAY LEVELS FOR 27/02/2024BUY ABOVE - 22170
SL - 22120
TARGETS -22210,22250,22300
SELL BELOW - 22120
SL - 22170
TARGETS - 22070,22020,21960
NO TRADE ZONE - 22120 to 22170
Previous Day High - 22210
Previous Day Low - 22070
Based on price action major support & resistance's are here, the red lines acts as resistances, the green lines acts as supports. If the price breaks the support/resistance, it will move to the next support/resistance line. White lines indicates previous day high & low, high acts as a resistance & low acts as a support for next day.
Trendlines are also significant to price action. If the price is above/below the trendlines, can expect an UP/DOWN with aggressive move.
Please NOTE: this levels are for intraday trading only.
Disclaimer - All information on this page is for educational purposes only,
we are not SEBI Registered, Please consult a SEBI registered financial advisor for your financial matters before investing And taking any decision. We are not responsible for any profit/loss you made.
Request your support and engagement by liking and commenting & follow to provide encouragement
HAPPY TRADING 👍
BANK NIFTY INTRADAY LEVELS FOR 26/02/2024BUY ABOVE - 47080
SL - 46900
TARGETS - 47200,47360,47600
SELL BELOW - 46700
SL - 46900
TARGETS - 46450,46300,46100
NO TRADE ZONE - 46700 to 47080
Previous Day High - 47200
Previous Day Low - 46700
Based on price action major support & resistance's are here, the red lines acts as resistances, the green lines acts as supports. If the price breaks the support/resistance, it will move to the next support/resistance line. White lines indicates previous day high & low, high acts as a resistance & low acts as a support for next day.
Trendlines are also significant to price action. If the price is above/below the trendlines, can expect an UP/DOWN with aggressive move.
Please NOTE: this levels are for intraday trading only.
Disclaimer - All information on this page is for educational purposes only,
we are not SEBI Registered, Please consult a SEBI registered financial advisor for your financial matters before investing And taking any decision. We are not responsible for any profit/loss you made.
Request your support and engagement by liking and commenting & follow to provide encouragement
HAPPY TRADING 👍

NIFTY INTRADAY LEVELS FOR 26/02/2024BUY ABOVE - 22250
SL - 22210
TARGETS -22300,22350,22400
SELL BELOW - 22170
SL - 22210
TARGETS - 22120,22070,22020
NO TRADE ZONE - 22170 to 22250
Previous Day High - 22300
Previous Day Low - 22170
Based on price action major support & resistance's are here, the red lines acts as resistances, the green lines acts as supports. If the price breaks the support/resistance, it will move to the next support/resistance line. White lines indicates previous day high & low, high acts as a resistance & low acts as a support for next day.
Trendlines are also significant to price action. If the price is above/below the trendlines, can expect an UP/DOWN with aggressive move.
Please NOTE: this levels are for intraday trading only.
Disclaimer - All information on this page is for educational purposes only,
we are not SEBI Registered, Please consult a SEBI registered financial advisor for your financial matters before investing And taking any decision. We are not responsible for any profit/loss you made.
Request your support and engagement by liking and commenting & follow to provide encouragement
HAPPY TRADING 👍

DIXONthis stock breakout ATH level and retest that level TGT will be 1:4 Risk reward
and this is just for Educational purpose only

CAMSCams has round bottom breakout so TGT up to ATH level
and this is just for Educational purpose only

NCC LTDNCC has breakout ATH level and create good opportinuty for positional trade
and this is just for Educational purpose only

ASTRAL LTDThis stock breakout consolidation and ATH level breakout so further up move will come
and this is just for Educational purpose only

AWLAdani wilmar ltd breakout major trendline with strong movement candle so TGT up to swing high
and this is just for Educational purpose only

ICILIndo count industr LTD has breakout cup and handle pattern with good volume
and this is just for Educational purpose only

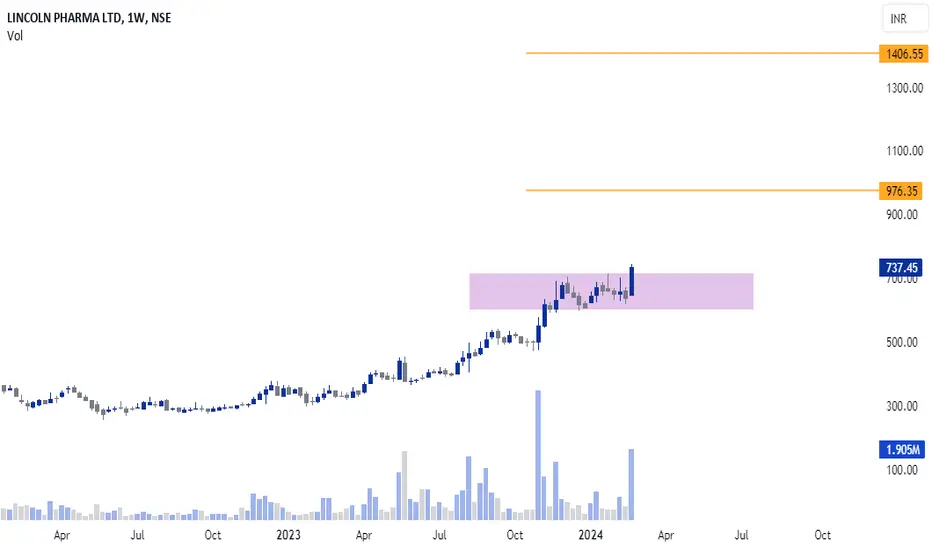
LINCOLNThis stock breakout 14 weeks consolidation level with good volume
and this is just for Educational purpose only
Important Levels for Som DistilleriesEverything is pretty much explained in the picture itself.
For any query kindly dm.
Thank you So Much.

SWING IDEA - GRINDWELL NORTONGrindwell Norton invites attention as it positions itself for a potential breakout. This exploration delves into the compelling factors shaping a promising swing trading opportunity.
Reasons are listed below :
Grindwell Norton has undergone rigorous testing at the 2320 levels, displaying resilience and now gearing up for a potential breakthrough.
A bullish ascending triangle pattern is unfolding, suggesting an imminent breakout as the stock converges towards higher levels.
The weekly timeframe reveals a powerful bullish signal in the form of an engulfing candle, hinting at a shift in market sentiment and the potential for upward momentum.
Witnessing a consistent pattern of higher highs, Grindwell Norton exemplifies a robust upward trajectory, reinforcing confidence in the prevailing bullish trend.
Trading above both the 50-day and 200-day Exponential Moving Averages (EMAs) on the weekly chart, the stock exhibits strength and stability, enhancing the overall technical outlook.
A notable increase in volume activity aligns with recent price movements, adding weight to the potential breakout scenario.
Target - 2635 // 2864
Stoploss - weekly close below 2200
DISCLAIMER -
Decisions to buy, sell, hold or trade in securities, commodities and other investments involve risk and are best made based on the advice of qualified financial professionals. Any trading in securities or other investments involves a risk of substantial losses. The practice of "Day Trading" involves particularly high risks and can cause you to lose substantial sums of money. Before undertaking any trading program, you should consult a qualified financial professional. Please consider carefully whether such trading is suitable for you in light of your financial condition and ability to bear financial risks. Under no circumstances shall we be liable for any loss or damage you or anyone else incurs as a result of any trading or investment activity that you or anyone else engages in based on any information or material you receive through TradingView or our services.
@visionary.growth.insights

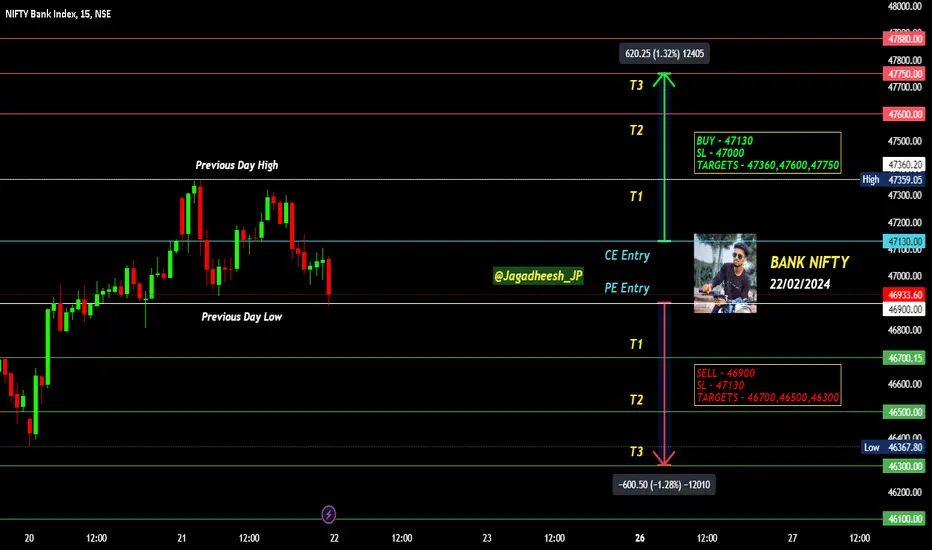
BANK NIFTY INTRADAY LEVELS FOR 22/02/2024BUY ABOVE - 47130
SL - 47000
TARGETS - 47360,47600,47750
SELL BELOW - 46900
SL - 47130
TARGETS - 46700,46500,46300
NO TRADE ZONE - 46900 to 47360
Previous Day High - 47360
Previous Day Low - 46900
Based on price action major support & resistance's are here, the red lines acts as resistances, the green lines acts as supports. If the price breaks the support/resistance, it will move to the next support/resistance line. White lines indicates previous day high & low, high acts as a resistance & low acts as a support for next day.
Trendlines are also significant to price action. If the price is above/below the trendlines, can expect an UP/DOWN with aggressive move.
Please NOTE: this levels are for intraday trading only.
Disclaimer - All information on this page is for educational purposes only,
we are not SEBI Registered, Please consult a SEBI registered financial advisor for your financial matters before investing And taking any decision. We are not responsible for any profit/loss you made.
Request your support and engagement by liking and commenting & follow to provide encouragement
HAPPY TRADING 👍