AxisBank could drop to 1150 and 1100 for bounce backAxis Bank could drop to 1150 and 1100 levels for bounce back to 1200 and plus levels.
Note: This is not a buy/sell trade call. Trade at your own will and analysis. Use stop loss too.
Nse

Nifty Outlook for next weekNSE:NIFTY1!
Expecting a meltdown on Nifty for the next week, then a rapid push up towards the Buyside

GOLD Weekly Outlook 1st week of May 2025 COMEX:GC1!
Expecting another displacement towards the downside on Gold on a weekly fractal. Perfectly lined up with daily and weekly internals

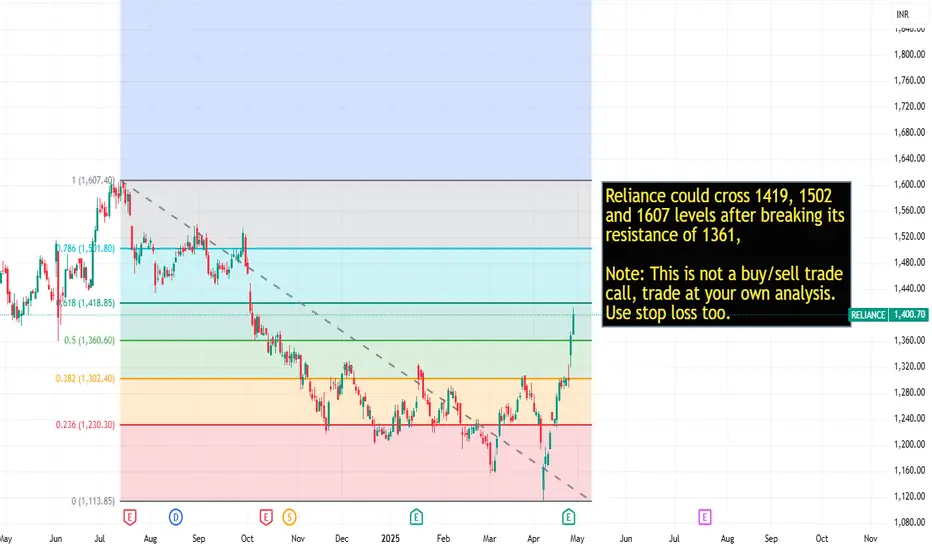
Reliance key levels after breakout of 1361Reliance could cross 1419, 1502
and 1607 levels after breaking its
resistance of 1361,
Note: This is not a buy/sell trade
call, trade at your own analysis.
Use stop loss too.
KFin Technologies LtdCompany Snapshot:
Sector: Financial Services (Mutual Fund Services, RTA)
Market Cap: ₹21,000 Cr
Current Price: ₹1,239.20
Debt-to-Equity: 0.06 (very low)
ROE: 39% | ROCE: 49%
Financial Highlights:
Revenue Growth (3Y CAGR): ~22%
Profit Growth (3Y CAGR): ~32%
EBITDA Margin: ~48%
P/E Ratio: ~35x (TTM)
Industry Avg P/E: ~30-32x
Recent Price Action:
Stock broke out sharply in April 2025.
Support: ₹1,180 | Resistance: ₹1,300
RSI near 70 (mildly overbought, but momentum strong).
Key Strengths:
Dominant RTA player with 70%+ MF asset share.
Consistent cash flows and expanding international footprint.
High operating leverage driving margin expansion.
Key Risks:
Regulatory changes (SEBI reforms) could pressure fees.
High client concentration risk with top AMCs.
Valuation & Recommendation:
DCF Estimated Fair Value: ₹1,280–₹1,350
Recommendation: BUY on Dips / Accumulate
12-month Target Price: ₹1,320
Investment Horizon: 1–2 years
📈 Verdict: Strong business fundamentals, steady growth, and low debt make KFin Technologies attractive for long-term investors. Minor corrections can offer better entry points.
For Education Purposes only

Live buy signal in AxisBank at 1182.6Live Khareedo (Buy) signal in AxisBank at 1182.6. Lets see how much it will rise.
Note: This is not a buy/sell trade call. Use stop loss.

Live buying signal in TataMotors at 664Live Khareedo (Buy) signal in Tata Motors at 664. Lets see how long it will go up.
Note: This is not a buy/sell trade call, trade at your own will and analysis. Use stop loss too.

Live buying signal in Reliance at 1348Live signal in Reliance at 1348 Khareedo (Buy), Lets see how long it will go up.
Note: This is not a buy/sell trade call. Use stop loss.

Live buying signal in Nifty 24275Live Khareedo (Buying) signal in Nifty at 24275, lets see how long it will go up.
Note: This is not a buy/sell trade call. trade at your own will and analysis. Use stop loss.

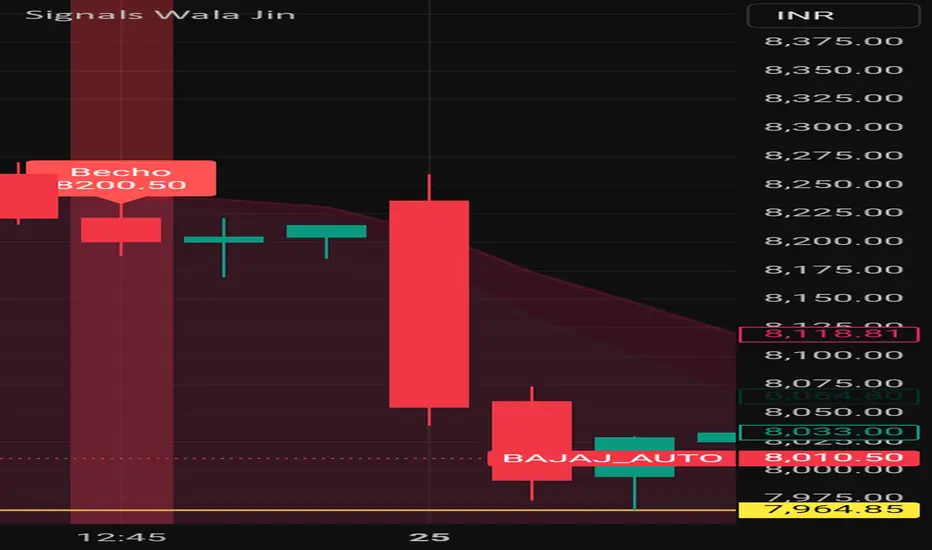
235 rupees dropped #BajajAuto share after signal 235 points dropped #BajajAuto share after generation of Signal "Becho" means sell by my custom designed indicator named SignalsWalaJin
Note: This is not a buy sell trade call. Trade at your own will. Use stop loss too.
113 rupe dropped Adanient after signal 113 rupees dropped #Adanient share after generation of Signal "Becho" means sell by my custom designed indicator named SignalsWalaJin
Note: This is not a buy sell trade call. Trade at your own will. Use stop loss too.

153 points dropped #Tac after SignalsWalaJin signal153 points dropped #Tac share after generation of Signal "Becho" means sell by my custom designed indicator named SignalsWalaJin
Note: This is not a buy sell trade call. Trade at your own will. Use stop loss too.

63 points dropped #AxisBank after #SignalsWalaJin signal63 points dropped #Axisbank share after generation of Signal "Becho" means sell by my custom designed indicator named SignalsWalaJin
Note: This is not a buy sell trade call. Trade at your own will. Use stop loss too.

Dixon in bearish zoneJadugar and Paka Kam generated signals Becho @ 16217 means sell at 16217, lets see how much it will fall.

IndusIndBk is in bearish zoneIndusIndBk is into bearish zone, my custom indicator generated sell "Becho" signal at 824.05 and it was dropped till 805 and rise again. Lets see how much it will drop.
Note: This is not a buy/sell call, Use stop loss too.

Divislab is in bullish zoneMy custom indicators named Jadugar and Paka Kam generated signal at 6070 Becho means to sell at 6070 and it started falling from that level. Lets see how much it will fall.
Note: This is not a buy/sell call, trade at your own will. use stop loss too.

TataMotors is in bullish zoneMy custom indicators named Jadugar and Paka Kam generated signals in last 1H candle that Becho @ 658.4 means sell at this price, lets see how much it will drop.
Note: This is not a buy/sell trade call, this is education purpose post, trade at your own will, Use stop loss.

Reliance is into bullish zoneMy custom designed indicator names Jin ka Bacha generated signal at price level of 1291 "Khareedo" means to buy, I noticed late and posting now about it, It go to 1325 after signal generated,
Note: This is not a buy/sell call, trade at your own will and use stop loss.

JK CEMENT | Strong Volume Breakout | Short-Term Upside in Play📈 Short-Term Trade Plan:
Buy Zone: ₹5,240–₹5,255 (on retest of breakout zone)
Target 1: ₹5,310
Target 2: ₹5,360
Stoploss: ₹5,195 (below the breakout candle wick)
🔍 Technical Insights:
Strong volume surge on breakout above ₹5,220–₹5,230 resistance zone.
RSI comfortably above 60, suggesting sustained strength.
Box breakout pattern typically suggests upward continuation with momentum.
for educational purposes only

EMCURE PHARMA | Approaching Key Resistance | Breakout or Triple ⚙️ Technical Setup Highlights:
Price is testing a resistance zone around ₹1100, which has been rejected twice before (as indicated by black arrows).
Volume has picked up on the recent move up — indicating buying interest.
RSI is turning up from near the 50 level, signaling positive momentum.
📈 Trade Plan:
🔹 If Price Breaks Above ₹1110-1120 with Volume:
Buy above ₹1120 (wait for a breakout candle with volume)
Target 1: ₹1180
Target 2: ₹1240
Stoploss: ₹1070 (just below the breakout level)
🔻 If Price Rejected at ₹1100-1120 Zone Again:
Sell near ₹1100-1110 (on bearish reversal candle confirmation)
Target: ₹1020
Stoploss: ₹1130
🎯 Ideal Strategy:
Wait for confirmation — either a clean breakout above ₹1120 or a rejection signal at resistance. Avoid trading within the zone.
for educational purposes only

ASTRAL LTD | At Key Trendline Resistance | Breakout or Rejection🟢 Buy Recommendation (Breakout Trade)
Entry: Buy only on breakout and daily close above ₹1,420–₹1,430 (above trendline resistance).
Target 1: ₹1,550
Target 2: ₹1,650
Stop Loss: ₹1,320 (below recent consolidation support)
📌 Rationale: If price breaks above the trendline on good volume and closes above ₹1,430, a trend reversal may begin.
🔴 Sell/Short Recommendation (Rejection Trade)
Entry: Sell if the price gets rejected from ₹1,400–₹1,420 and shows a red candle (confirmation).
Target 1: ₹1,280
Target 2: ₹1,180
Stop Loss: ₹1,445 (above the trendline)
📌 Rationale: If the price fails to break the trendline, it could resume the downtrend. RSI is overbought, and sellers might take over.
for educational purposes only

SBIN is crossed breakout level of 800.46SBIN is crossed breakout level and closed above it, It is a positive sign. Key levels are 800, 824, 857 and 912.
Note: This is not a buy/sell trade call. Use stop loss too.

Reliance is near to breakout 1346 levelAfter long time reliance is near to breakout level to enter is bullish zone. Breakout level is 1346 and key levels are 1358, 1416, 1489 and 1606.
Note: This is not a buy/sell trade call. Trade at your own will and use stop loss.
