UPL BUY 486 SL 469 TGT 500/620/700UPL BUY 486 SL 469 TGT 500/620/700
7KInvest Ideas$$
DISCLAIMER: These videos are for educational purposes only. Investing of any kind involves risk. While it is possible to minimize risk, your investments are solely your responsibility. It is imperative that you conduct your own research. I am merely sharing my opinion with no guarantee of gains or losses on investments.
Nse

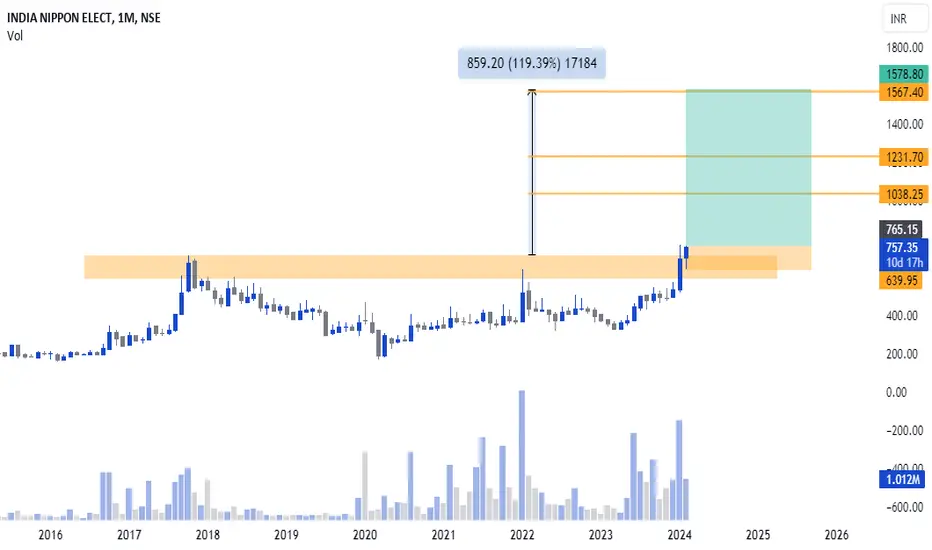
INDNIPPONIndia nippon elect has breakout 6 year resistance level and ATH level with good volume so further up move will come
This is only for educational purpose
MASTEKThis stock breakout some consolidation level with good volume and major resistance level at 3400 if breaks this level further up move will come
This is only for educational purpose

SANDHARSandhar technologies LTD stock breakout 5 years resistance and ATH level with good volume and retest this level
This is only for educational purpose

KIRLPNUThis stock breakout major resistance level with good volume
This is only for educational purpose

GRANULES INDIAGranules has breakout ATH resistance level so stock has create good opportunity for swing trade
This is only for educational purpose

Buy CASTROLIND 167 - 173 SL 160 Tgt 195-220Buy CASTROLIND 167 - 173 SL 160 Tgt 195-220
I am expecting 15-30 % return positional basis on this trade

CONCOR Share -- CE1000 -- BuyConcor -- CE1000 -- HODL-29 FEB
These stocks breakout the upper Trendline and support confirm in weekly time frames
In option you buy CE call you want my Target 1100 in Feb last month
For equity trader you can take swing trade and sale at 1100
Option traders
Take profit 1st - stock price 1000
Take profit 2nd - stock price 1100
For more charts analysis -- comments me in this post.

$Bhartiairtel CE 1200 #HODL till 28 FEBBharti Airtel -- CE1200 -- HODL -- 29 FEB
These stocks breakout the upper Trendline and support confirm in weekly time frames
In option you buy CE call you want my Target 1200 in Feb last month
Fir equity trader you can take swing trade and sale @1200
For more charts analysis -- comments me in this post.

ASIAN PAINTSAsian paints price moving in triangle pattern so price came down and took support from bottom trade line so TGT will be upper trend line
only for educational purpose

NUVAMA WEALTH MANAGE LTDThis stock breakout some of consolidation level so stock has been create good opportunity for swing trade and this is only for educational purpose

JK CEMENTS LTDThis stock breakout cup and handle pattern TGT will be 1:3 risk reward
and only for educational purpose

NIFTY INTRADAY LEVELS FOR 15/02/2024BUY ABOVE - 21860
SL - 21810
TARGETS - 21910,21970,21010
SELL BELOW - 21770
SL - 21810
TARGETS - 21710,21640,21580
NO TRADE ZONE - 21770 to 21860
Previous Day High - 21770
Previous Day Low - 21580
Based on price action major support & resistance's are here, the red lines acts as resistances, the green lines acts as supports. If the price breaks the support/resistance, it will move to the next support/resistance line. White lines indicates previous day high & low, high acts as a resistance & low acts as a support for next day.
Trendlines are also significant to price action. If the price is above/below the trendlines, can expect an UP/DOWN with aggressive move.
Please NOTE: this levels are for intraday trading only.
Disclaimer - All information on this page is for educational purposes only,
we are not SEBI Registered, Please consult a SEBI registered financial advisor for your financial matters before investing And taking any decision. We are not responsible for any profit/loss you made.
Request your support and engagement by liking and commenting & follow to provide encouragement
HAPPY TRADING 👍

BANK NIFTY INTRADAY LEVELS FOR 15/02/2024BUY ABOVE - 46170
SL - 46010
TARGETS - 46300,46500,46670
SELL BELOW - 45730
SL - 46010
TARGETS - 45570,45330,45150
NO TRADE ZONE - 45730 to 46170
Previous Day High - 45730
Previous Day Low - 44950
Based on price action major support & resistance's are here, the red lines acts as resistances, the green lines acts as supports. If the price breaks the support/resistance, it will move to the next support/resistance line. White lines indicates previous day high & low, high acts as a resistance & low acts as a support for next day.
Trendlines are also significant to price action. If the price is above/below the trendlines, can expect an UP/DOWN with aggressive move.
Please NOTE: this levels are for intraday trading only.
Disclaimer - All information on this page is for educational purposes only,
we are not SEBI Registered, Please consult a SEBI registered financial advisor for your financial matters before investing And taking any decision. We are not responsible for any profit/loss you made.
Request your support and engagement by liking and commenting & follow to provide encouragement
HAPPY TRADING 👍

BANK NIFTY INTRADAY LEVELS FOR 14/02/2024BUY ABOVE - 45570
SL - 45450
TARGETS - 45730,46010,46200
SELL BELOW - 45330
SL - 45470
TARGETS - 45150,44950,44740
NO TRADE ZONE - 45330 to 45730
Previous Day High - 45730
Previous Day Low - 44740
Based on price action major support & resistance's are here, the red lines acts as resistances, the green lines acts as supports. If the price breaks the support/resistance, it will move to the next support/resistance line. White lines indicates previous day high & low, high acts as a resistance & low acts as a support for next day.
Trendlines are also significant to price action. If the price is above/below the trendlines, can expect an UP/DOWN with aggressive move.
Please NOTE: this levels are for intraday trading only.
Disclaimer - All information on this page is for educational purposes only,
we are not SEBI Registered, Please consult a SEBI registered financial advisor for your financial matters before investing And taking any decision. We are not responsible for any profit/loss you made.
Request your support and engagement by liking and commenting & follow to provide encouragement
HAPPY TRADING 👍

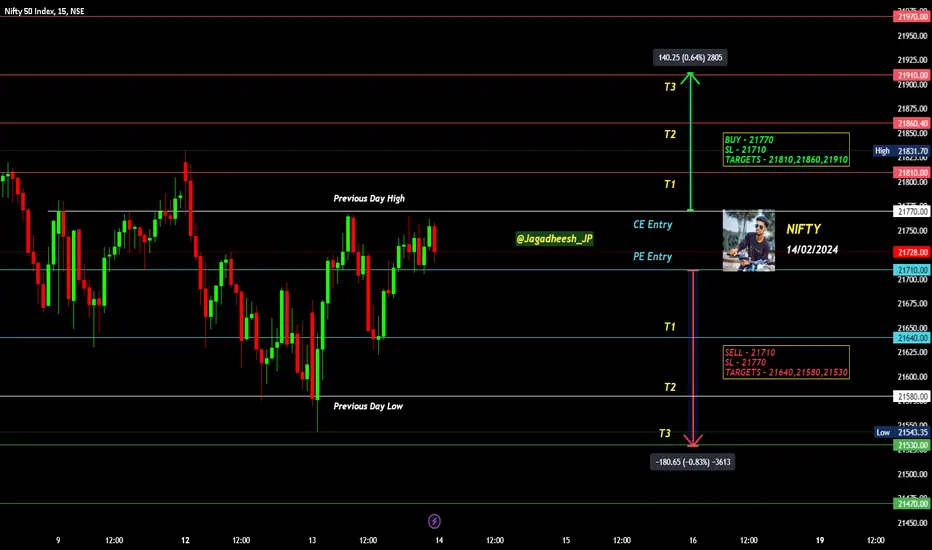
NIFTY INTRADAY LEVELS FOR 14/02/2024BUY ABOVE - 21770
SL - 21710
TARGETS - 21810,21860,21910
SELL BELOW - 21710
SL - 21770
TARGETS - 21640,21580,21530
NO TRADE ZONE - 21710 to 21770
Previous Day High - 21770
Previous Day Low - 21580
Based on price action major support & resistance's are here, the red lines acts as resistances, the green lines acts as supports. If the price breaks the support/resistance, it will move to the next support/resistance line. White lines indicates previous day high & low, high acts as a resistance & low acts as a support for next day.
Trendlines are also significant to price action. If the price is above/below the trendlines, can expect an UP/DOWN with aggressive move.
Please NOTE: this levels are for intraday trading only.
Disclaimer - All information on this page is for educational purposes only,
we are not SEBI Registered, Please consult a SEBI registered financial advisor for your financial matters before investing And taking any decision. We are not responsible for any profit/loss you made.
Request your support and engagement by liking and commenting & follow to provide encouragement
HAPPY TRADING 👍

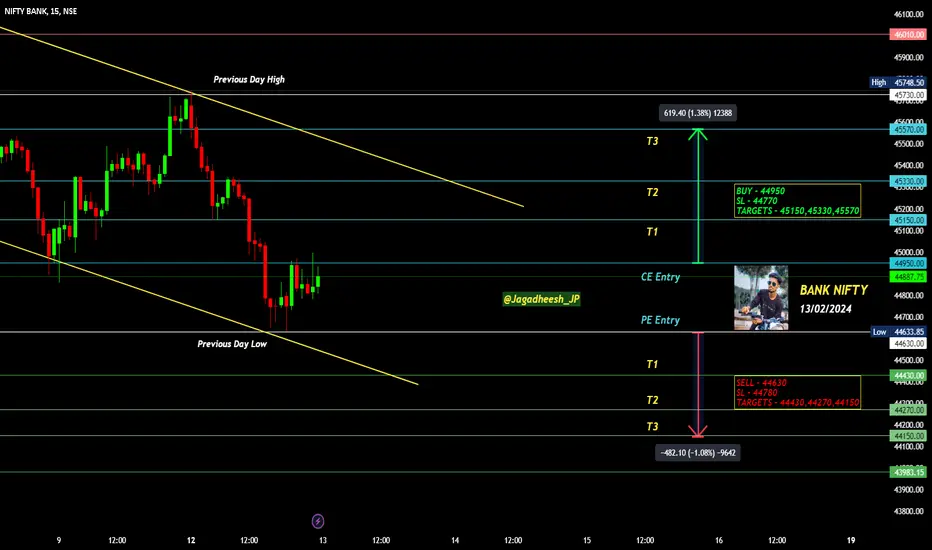
BANK NIFTY INTRADAY LEVELS FOR 13/02/2024BUY ABOVE - 44950
SL - 44770
TARGETS - 45150,45330,45570
SELL BELOW - 44630
SL - 44780
TARGETS - 44430,44270,44150
NO TRADE ZONE - 44630 to 44950
Previous Day High - 45730
Previous Day Low - 44630
Based on price action major support & resistance's are here, the red lines acts as resistances, the green lines acts as supports. If the price breaks the support/resistance, it will move to the next support/resistance line. White lines indicates previous day high & low, high acts as a resistance & low acts as a support for next day.
Trendlines are also significant to price action. If the price is above/below the trendlines, can expect an UP/DOWN with aggressive move.
Please NOTE: this levels are for intraday trading only.
Disclaimer - All information on this page is for educational purposes only,
we are not SEBI Registered, Please consult a SEBI registered financial advisor for your financial matters before investing And taking any decision. We are not responsible for any profit/loss you made.
Request your support and engagement by liking and commenting & follow to provide encouragement
HAPPY TRADING 👍
NIFTY INTRADAY LEVELS FOR 13/02/2024BUY ABOVE - 21670
SL - 21620
TARGETS - 21730,21770,21810
SELL BELOW - 21580
SL - 21620
TARGETS - 21530,21470,21400
NO TRADE ZONE - 21580 to 21670
Previous Day High - 21810
Previous Day Low - 21580
Based on price action major support & resistance's are here, the red lines acts as resistances, the green lines acts as supports. If the price breaks the support/resistance, it will move to the next support/resistance line. White lines indicates previous day high & low, high acts as a resistance & low acts as a support for next day.
Trendlines are also significant to price action. If the price is above/below the trendlines, can expect an UP/DOWN with aggressive move.
Please NOTE: this levels are for intraday trading only.
Disclaimer - All information on this page is for educational purposes only,
we are not SEBI Registered, Please consult a SEBI registered financial advisor for your financial matters before investing And taking any decision. We are not responsible for any profit/loss you made.
Request your support and engagement by liking and commenting & follow to provide encouragement
HAPPY TRADING 👍

TAKE SOLUTIONSThis stock breakout and retest level and SL also be small 1:3 risk reward
this is only for educational purpose

BANK NIFTY INTRADAY LEVELS FOR 12/02/2024BUY ABOVE - 45730
SL - 45570
TARGETS - 46010,46200,46300
SELL BELOW - 45330
SL - 45570
TARGETS - 45110,44900,44610
NO TRADE ZONE - 45330 to 45730
Previous Day High - 45730
Previous Day Low - 44900
Based on price action major support & resistance's are here, the red lines acts as resistances, the green lines acts as supports. If the price breaks the support/resistance, it will move to the next support/resistance line. White lines indicates previous day high & low, high acts as a resistance & low acts as a support for next day.
Trendlines are also significant to price action. If the price is above/below the trendlines, can expect an UP/DOWN with aggressive move.
Please NOTE: this levels are for intraday trading only.
Disclaimer - All information on this page is for educational purposes only,
we are not SEBI Registered, Please consult a SEBI registered financial advisor for your financial matters before investing And taking any decision. We are not responsible for any profit/loss you made.
Request your support and engagement by liking and commenting & follow to provide encouragement
HAPPY TRADING 👍

NIFTY INTRADAY LEVELS FOR 12/02/2024BUY ABOVE - 21810
SL - 21770
TARGETS - 21860,21910,21970
SELL BELOW - 21730
SL - 21770
TARGETS - 21670,21580,21530
NO TRADE ZONE - 21730 to 21810
Previous Day High - 21810
Previous Day Low - 21670
Based on price action major support & resistance's are here, the red lines acts as resistances, the green lines acts as supports. If the price breaks the support/resistance, it will move to the next support/resistance line. White lines indicates previous day high & low, high acts as a resistance & low acts as a support for next day.
Trendlines are also significant to price action. If the price is above/below the trendlines, can expect an UP/DOWN with aggressive move.
Please NOTE: this levels are for intraday trading only.
Disclaimer - All information on this page is for educational purposes only,
we are not SEBI Registered, Please consult a SEBI registered financial advisor for your financial matters before investing And taking any decision. We are not responsible for any profit/loss you made.
Request your support and engagement by liking and commenting & follow to provide encouragement
HAPPY TRADING 👍

MOTILAL OSWALThis stock breakout ATH resistance level and some of consolidation level breakout in D TF and TGT will be upto 40%
this is only for educational purpose
