#JIOFIN LONGTERM LONG TRADE SETUPGreetings Folks,
today i have prepared a setup of JIOFIN on NSE
the analysis is as follows-
- the price is approaching the all time low
- i am hoping for the price to take support near its ATL
- the market structure is not compelling
- the stock may pump/dump some times before making good structure
- i would advise you to be very cautious while dealing in this stock
dont play with fire, always use a predefined stoploss
Nse

Will PAYTM (One 97 comm., India) activate the target 1475 ?Daily chart, the stock should cross the Resistance line R1 (green) and trade above 810, to target the Resistance line R2 (at around 1050)
After clear crossing and closing 2 days above R2, the target will be 1475
Stop loss below 720 should be considered.

BAJEL PROJECTSThis stock breakout ipo price and cup and handle pattern so TGT will be almost 40% high
This idea is only for educational purpose

MISHTANN BUY 20.50-21.50 SL 17 TGT 27/34/40/50MISHTANN BUY 20.50-21.50 SL 17 TGT 27/34/40/50
7KInvest Ideas$$
DISCLAIMER: These videos are for educational purposes only. Investing of any kind involves risk. While it is possible to minimize risk, your investments are solely your responsibility. It is imperative that you conduct your own research. I am merely sharing my opinion with no guarantee of gains or losses on investments.

KHAICHEM BUY 78-81 SL 69 TGT 95/107/140/164/200KHAICHEM BUY 78-81 SL 69 TGT 95/107/140/164/200
DISCLAIMER: These videos are for educational purposes only. Investing of any kind involves risk. While it is possible to minimize risk, your investments are solely your responsibility. It is imperative that you conduct your own research. I am merely sharing my opinion with no guarantee of gains or losses on investments.

GTL INTRASTRUCTURE - BEST PERFORMER PENNY STOCKCan enter at CMP 1.75 or Enter at 1.60 level
Targets - 2.35,3.75+
Disclaimer - All information on this page is for educational purposes only,
we are not SEBI Registered, Please consult a SEBI registered financial advisor for your financial matters before investing And taking any decision. We are not responsible for any profit/loss you made.
Request your support and engagement by liking and commenting & follow to provide encouragement
HAPPY TRADING 👍

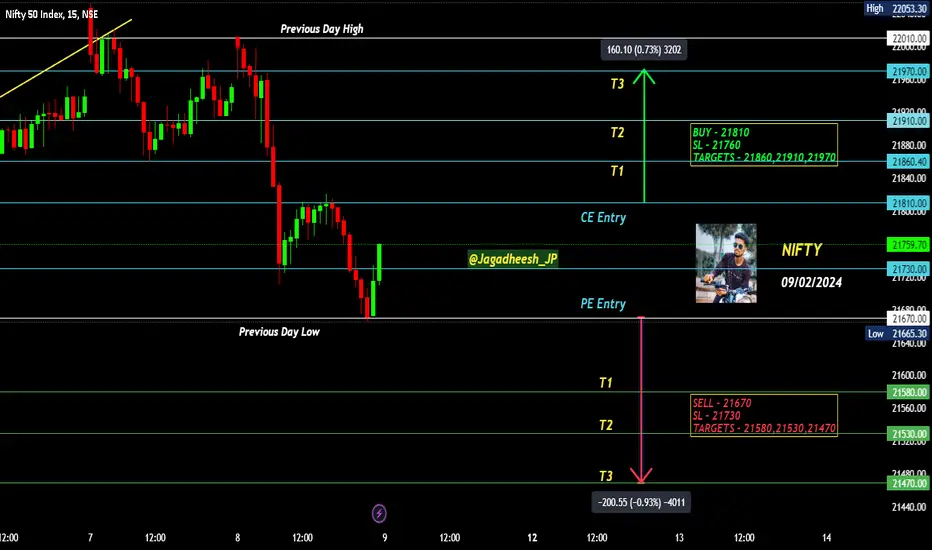
NIFTY INTRADAY LEVELS FOR 09/02/2024BUY ABOVE - 21810
SL - 21760
TARGETS - 21860,21910,21970
SELL BELOW - 21670
SL - 21730
TARGETS - 21580,21530,21470
NO TRADE ZONE - 21670 to 21810
Previous Day High - 22010
Previous Day Low - 21670
Based on price action major support & resistance's are here, the red lines acts as resistances, the green lines acts as supports. If the price breaks the support/resistance, it will move to the next support/resistance line. White lines indicates previous day high & low, high acts as a resistance & low acts as a support for next day.
Trendlines are also significant to price action. If the price is above/below the trendlines, can expect an UP/DOWN with aggressive move.
Please NOTE: this levels are for intraday trading only.
Disclaimer - All information on this page is for educational purposes only,
we are not SEBI Registered, Please consult a SEBI registered financial advisor for your financial matters before investing And taking any decision. We are not responsible for any profit/loss you made.
Request your support and engagement by liking and commenting & follow to provide encouragement
HAPPY TRADING 👍
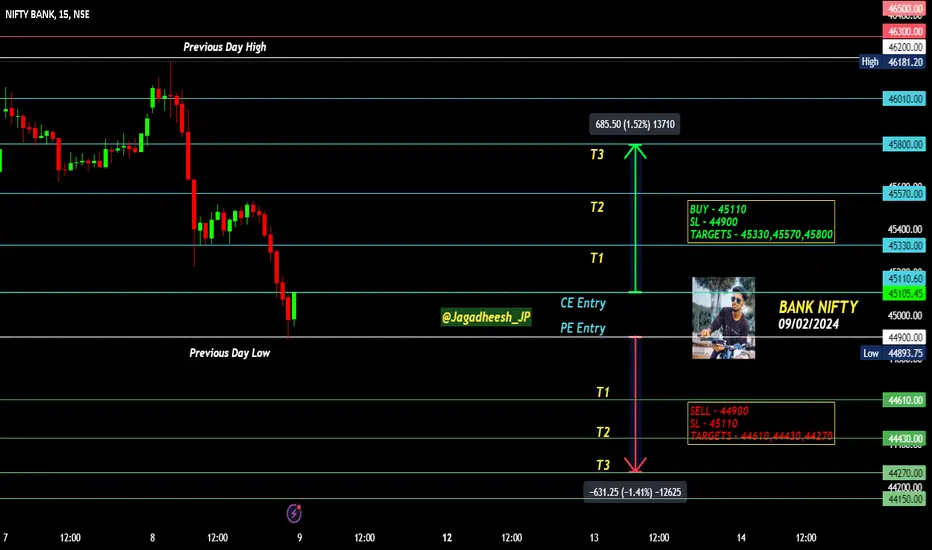
BANK NIFTY INTRADAY LEVELS FOR 09/02/2024BUY ABOVE - 45110
SL - 44900
TARGETS - 45330,45570,45800
SELL BELOW - 44900
SL - 45110
TARGETS - 44610,44430,44270
NO TRADE ZONE - 44900 to 45110
Previous Day High - 46200
Previous Day Low - 44900
Based on price action major support & resistance's are here, the red lines acts as resistances, the green lines acts as supports. If the price breaks the support/resistance, it will move to the next support/resistance line. White lines indicates previous day high & low, high acts as a resistance & low acts as a support for next day.
Trendlines are also significant to price action. If the price is above/below the trendlines, can expect an UP/DOWN with aggressive move.
Please NOTE: this levels are for intraday trading only.
Disclaimer - All information on this page is for educational purposes only,
we are not SEBI Registered, Please consult a SEBI registered financial advisor for your financial matters before investing And taking any decision. We are not responsible for any profit/loss you made.
Request your support and engagement by liking and commenting & follow to provide encouragement
HAPPY TRADING 👍
RAMA STEEL TUBES - ENTRY POINTCan enter at CMP - 43₹
SL - 32
Targets - 50,60,70+
Disclaimer - All information on this page is for educational purposes only,
we are not SEBI Registered, Please consult a SEBI registered financial advisor for your financial matters before investing And taking any decision. We are not responsible for any profit/loss you made.
Request your support and engagement by liking and commenting & follow to provide encouragement
HAPPY TRADING 👍

MISHTANN FOODS - 2 YEARS HIGH BREAKOUTCan enter at CMP 23₹
or enter at 21₹
Target - 35.55
Disclaimer - All information on this page is for educational purposes only,
we are not SEBI Registered, Please consult a SEBI registered financial advisor for your financial matters before investing And taking any decision. We are not responsible for any profit/loss you made.
Request your support and engagement by liking and commenting & follow to provide encouragement
HAPPY TRADING 👍

PRITIKA AUTO INDUS - GOOD VOLUMECan Enter at CMP 41.30 or Enter at 37 level
If again falls then you need to average at 26 level
BEST STOCK TO INVEST
Disclaimer - All information on this page is for educational purposes only,
we are not SEBI Registered, Please consult a SEBI registered financial advisor for your financial matters before investing And taking any decision. We are not responsible for any profit/loss you made.
Request your support and engagement by liking and commenting & follow to provide encouragement
HAPPY TRADING 👍

NALCO (NATIONAL ALUMINIUM) - SWING TRADING ANALYSISAfter a very long consolidation in a form of Ascending triangle a good breakout is there with a good volume.
Disclaimer - All information on this page is for educational purposes only,
we are not SEBI Registered, Please consult a SEBI registered financial advisor for your financial matters before investing And taking any decision. We are not responsible for any profit/loss you made.
HAPPY TRADING GUYS
@Jagadheesh_Jk

SAIL BUY 128-29 SL 118 TGT 140/164/200SAIL BUY 128-29 SL 118 TGT 140/164/200
DISCLAIMER: These videos are for educational purposes only. Investing of any kind involves risk. While it is possible to minimize risk, your investments are solely your responsibility. It is imperative that you conduct your own research. I am merely sharing my opinion with no guarantee of gains or losses on investments.

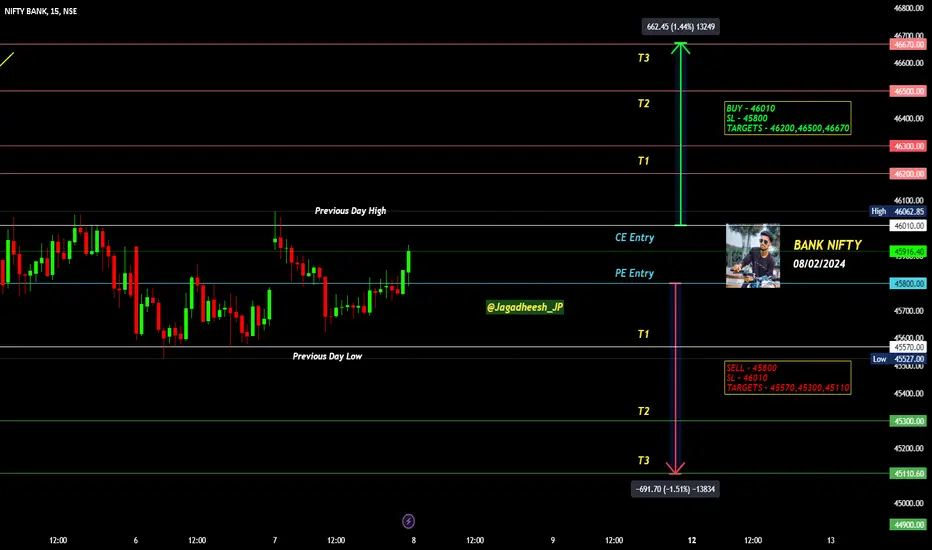
BANK NIFTY INTRADAY LEVELS FOR 08/02/2024BUY ABOVE - 46010
SL - 45800
TARGETS - 46200,46500,46670
SELL BELOW - 45800
SL - 46010
TARGETS - 45570,45300,45110
NO TRADE ZONE - 45800 to 46010
Previous Day High - 46010
Previous Day Low - 45570
Based on price action major support & resistance's are here, the red lines acts as resistances, the green lines acts as supports. If the price breaks the support/resistance, it will move to the next support/resistance line. White lines indicates previous day high & low, high acts as a resistance & low acts as a support for next day.
Trendlines are also significant to price action. If the price is above/below the trendlines, can expect an UP/DOWN with aggressive move.
Please NOTE: this levels are for intraday trading only.
Disclaimer - All information on this page is for educational purposes only,
we are not SEBI Registered, Please consult a SEBI registered financial advisor for your financial matters before investing And taking any decision. We are not responsible for any profit/loss you made.
Request your support and engagement by liking and commenting & follow to provide encouragement
HAPPY TRADING 👍
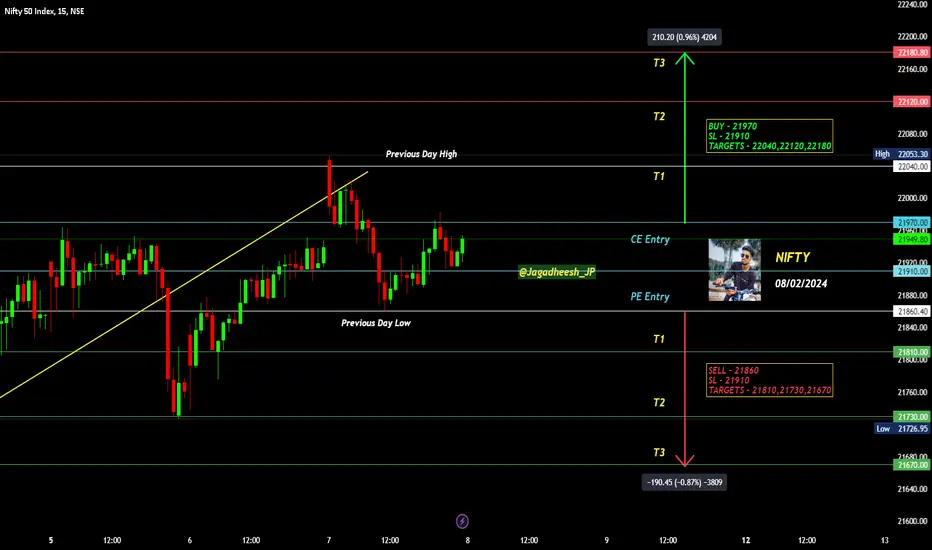
NIFTY INTRADAY LEVELS FOR 08/02/2024BUY ABOVE - 21970
SL - 21910
TARGETS - 22040,22120,22180
SELL BELOW - 21860
SL - 21910
TARGETS - 21810,21730,21670
NO TRADE ZONE - 21860 to 21970
Previous Day High - 22040
Previous Day Low - 21860
Based on price action major support & resistance's are here, the red lines acts as resistances, the green lines acts as supports. If the price breaks the support/resistance, it will move to the next support/resistance line. White lines indicates previous day high & low, high acts as a resistance & low acts as a support for next day.
Trendlines are also significant to price action. If the price is above/below the trendlines, can expect an UP/DOWN with aggressive move.
Please NOTE: this levels are for intraday trading only.
Disclaimer - All information on this page is for educational purposes only,
we are not SEBI Registered, Please consult a SEBI registered financial advisor for your financial matters before investing And taking any decision. We are not responsible for any profit/loss you made.
Request your support and engagement by liking and commenting & follow to provide encouragement
HAPPY TRADING 👍
ITDCThis stock breakout nearly 5 years consolidation level so create good opportunity for swing trade and only for educational purpose

ASIAN ENERGY SERVICESThis stock breakout consolidation level further up move will come and this is only for educational purpose

YES BANK RANGE BREAKOUT FROM ALL TIME LOW LEVELI Suggested this stock on 12th Nov 2023 at 19 level
Entered at 19
Targets - 22,30,45,70+
18% Returns Given 🚀💰 Best Penny stock to invest now
Investment possible at CMP - 21.45 level if falls than average at 19 level
@Jagadheesh_JP
In this channel, I share my expertise in trading strategies, technical analysis, and market trends to help you make informed decisions in your trading ventures.
Stay tuned for daily updates, in-depth market analyses, and real-time trading scenarios to witness firsthand how we transform from Zero to Hero in the trading world. My Only aim is to empower you with the knowledge and skills necessary to navigate the complexities of the financial markets successfully.
Disclaimer - All information on this page is for educational purposes only,
we are not SEBI Registered, Please consult a SEBI registered financial advisor for your financial matters before investing And taking any decision. We are not responsible for any profit/loss you made.
Request your support and engagement by liking and commenting & follow to provide encouragement
HAPPY TRADING 👍

NYKAA - 1 YEAR OF REASISTANCE BREAKOUTEntry Given Now
Can enter at CMP - 161
SL - 135
Targets - 215,310,410+
Disclaimer - All information on this page is for educational purposes only,
we are not SEBI Registered, Please consult a SEBI registered financial advisor for your financial matters before investing And taking any decision. We are not responsible for any profit/loss you made.
Request your support and engagement by liking and commenting & follow to provide encouragement
HAPPY TRADING 👍

TCSthis IT stock breakout major resistance level if this week candle closed strongly then considered as good breakout and only for educational purpose

CAMS cams has round pattern break outing if weekly candle closed above the resistance TGT will be ATH level

JIO FIN SERVICESThis stock breakout 5 month consolidation level with high volume and only for educational purpose

Trade setup YESBANK can give a breakout and rally 10% and moreTrade set-up YESBANK can give a breakout and rally 10% and even more
Major breakout will be seen if price hold level mention then we can expect 45 levels
