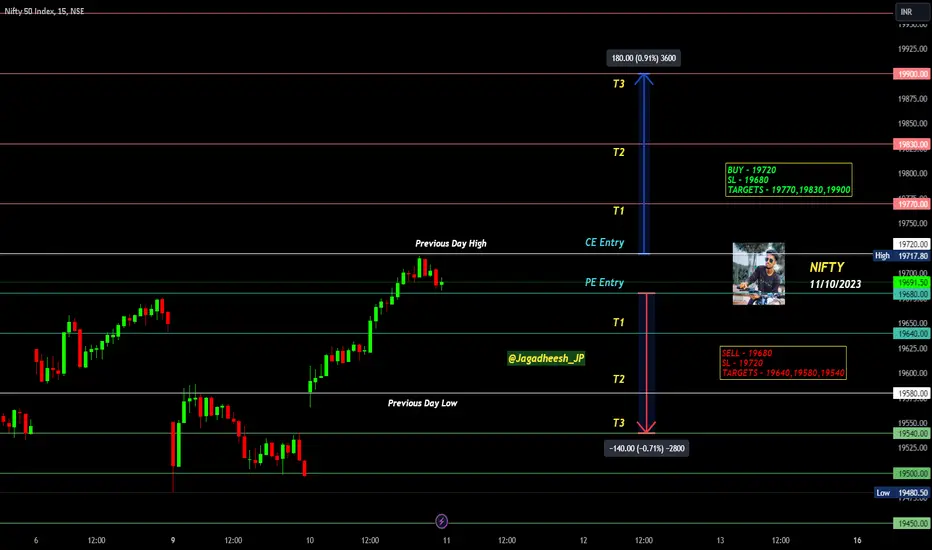
NIFTY INTRADAY LEVELS FOR 11/10/2023BUY ABOVE - 19720
SL - 19680
TARGETS - 19770,19830,19900
SELL BELOW - 19680
SL - 19720
TARGETS - 19640,19580,19540
NO TRADE ZONE - 19680 to 19720
Previous Day High - 19720
Previous Day Low - 19580
I am sharing NIFTY levels this levels acts as important support & resistance for intraday. if you want to trade with this levels wait for 15 min Candle closing above that levels. You can trade with breakout and reversal both.
In this channel, I share my expertise in trading strategies, technical analysis, and market trends to help you make informed decisions in your trading ventures.
Stay tuned for daily updates, in-depth market analyses, and real-time trading scenarios to witness firsthand how we transform from Zero to Hero in the trading world. My Only aim is to empower you with the knowledge and skills necessary to navigate the complexities of the financial markets successfully.
Based on price action major support & resistance's are here, the red lines acts as resistances, the green lines acts as supports. If the price breaks the support/resistance, it will move to the next support/resistance line. White lines indicates previous day high & low, high acts as a resistance & low acts as a support for next day.
Please NOTE: this levels are for intraday trading only.
Disclaimer - All information on this page is for educational purposes only,
we are not SEBI Registered, Please consult a SEBI registered financial advisor for your financial matters before investing And taking any decision. We are not responsible for any profit/loss you made.
Request your support and engagement by liking and commenting & follow to provide encouragement
HAPPY TRADING 👍
Nse
#IDEA/VI LONG TRADE IDEA SETUPGreetings Folks,
today i have prepared a setup of IDEA on NSE
the analysis is as follows
- the price is making bearish structures
- the price has made a temporary higher low, its not validated until the price breaks past the previous lower high
- the volume is minimal, the RR can be good but so is the risk associated with it
dont play with fire, always use a predefined stoploss

FOODS and INNS long 185can keep stop at cls below 160 S
CAN ADD AT DIPS . has potential to be multibagger is next qtr results deliver can fly , strict stoploss though

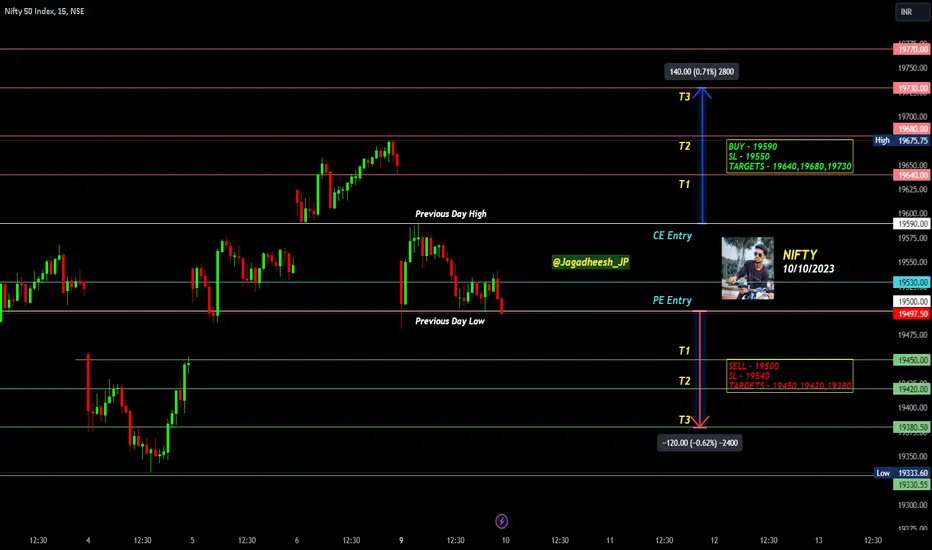
NIFTY INTRADAY LEVELS FOR 10/10/2023BUY ABOVE - 19590
SL - 19550
TARGETS - 19640,19680,19730
SELL BELOW - 19500
SL - 19540
TARGETS - 19450,19420,19380
NO TRADE ZONE - 19500 to 19590
Previous Day High - 19590
Previous Day Low - 19480
I am sharing NIFTY levels this levels acts as important support & resistance for intraday. if you want to trade with this levels wait for 15 min Candle closing above that levels. You can trade with breakout and reversal both.
In this channel, I share my expertise in trading strategies, technical analysis, and market trends to help you make informed decisions in your trading ventures.
Stay tuned for daily updates, in-depth market analyses, and real-time trading scenarios to witness firsthand how we transform from Zero to Hero in the trading world. My Only aim is to empower you with the knowledge and skills necessary to navigate the complexities of the financial markets successfully.
Based on price action major support & resistance's are here, the red lines acts as resistances, the green lines acts as supports. If the price breaks the support/resistance, it will move to the next support/resistance line. White lines indicates previous day high & low, high acts as a resistance & low acts as a support for next day.
Please NOTE: this levels are for intraday trading only.
Disclaimer - All information on this page is for educational purposes only,
we are not SEBI Registered, Please consult a SEBI registered financial advisor for your financial matters before investing And taking any decision. We are not responsible for any profit/loss you made.
Request your support and engagement by liking and commenting & follow to provide encouragement
HAPPY TRADING 👍
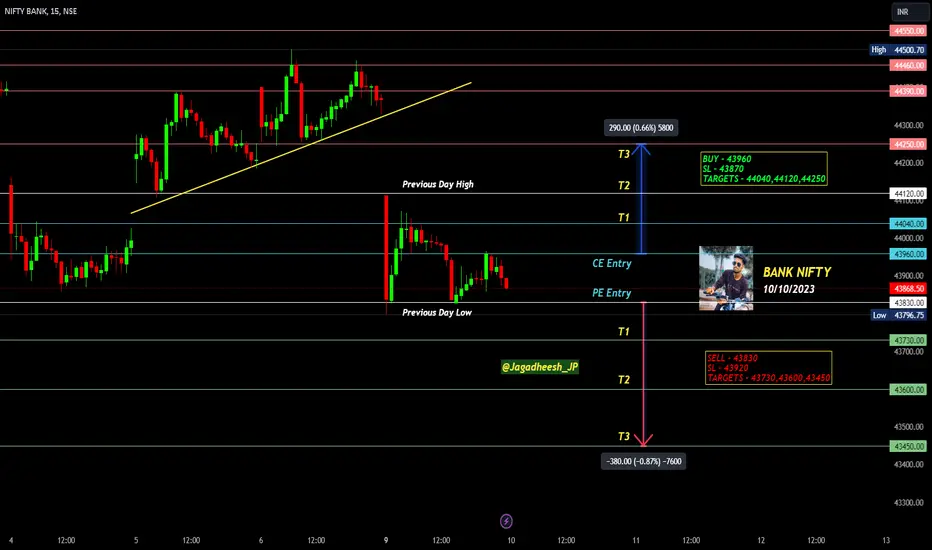
BANK NIFTY INTRADAY LEVELS FOR 10/10/2023BUY ABOVE - 43960
SL - 43870
TARGETS - 44040,44120,44250
SELL BELOW - 43830
SL - 43920
TARGETS - 43730,43600,43450
NO TRADE ZONE - 43830 to 43960
Previous Day High - 44120
Previous Day Low - 43796
I am sharing BANK NIFTY levels this levels acts as important support & resistance for intraday. if you want to trade with this levels wait for 15 min Candle closing above that levels. You can trade with breakout and reversal both.
In this channel, I share my expertise in trading strategies, technical analysis, and market trends to help you make informed decisions in your trading ventures.
Stay tuned for daily updates, in-depth market analyses, and real-time trading scenarios to witness firsthand how we transform from Zero to Hero in the trading world. My Only aim is to empower you with the knowledge and skills necessary to navigate the complexities of the financial markets successfully.
Based on price action major support & resistance's are here, the red lines acts as resistances, the green lines acts as supports. If the price breaks the support/resistance, it will move to the next support/resistance line. White lines indicates previous day high & low, high acts as a resistance & low acts as a support for next day.
Trendlines are also significant to price action. If the price is above/below the trendlines, can expect an UP/DOWN with aggressive move.
Please NOTE: this levels are for intraday trading only.
Disclaimer - All information on this page is for educational purposes only,
we are not SEBI Registered, Please consult a SEBI registered financial advisor for your financial matters before investing And taking any decision. We are not responsible for any profit/loss you made.
Request your support and engagement by liking and commenting & follow to provide encouragement
HAPPY TRADING 👍
#JPPOWER SHORT TRADE IDEA SETUPGreetings Folks,
today i have prepared a setup of JPPOWER on NSE
the analysis is as follows
- the price is in bearish structure right now
- we have some liquidity build up which adds to confirmation for our short
- 2 possible area for trades
- the zone above BSL is more favorable for our trade
dont play with fire, always use a predefined stoploss

#INFIBEAM LONG TRADE IDEA SETUPGreetings Folks,
today i have prepared a setup of INFIBEAM on NSE
the analysis is as follows
- price is in a good bullish rally
- dont root for deep retracements, join the herd early as possible
-we will not change our bias before the market shows some bearish structure
dont play with fire, always use a predefined stoploss

BANK NIFTY INTRADAY LEVELS FOR 09/10/2023BUY ABOVE - 44460
SL - 44390
TARGETS - 44550,44660,44750
SELL BELOW - 44310
SL - 44350
TARGETS - 44250,44120,44040
NO TRADE ZONE - 44310 to 44460
Previous Day High - 44500
Previous Day Low - 44250
I am sharing BANK NIFTY levels this levels acts as important support & resistance for intraday. if you want to trade with this levels wait for 15 min Candle closing above that levels. You can trade with breakout and reversal both.
In this channel, I share my expertise in trading strategies, technical analysis, and market trends to help you make informed decisions in your trading ventures.
Stay tuned for daily updates, in-depth market analyses, and real-time trading scenarios to witness firsthand how we transform from Zero to Hero in the trading world. My Only aim is to empower you with the knowledge and skills necessary to navigate the complexities of the financial markets successfully.
Based on price action major support & resistance's are here, the red lines acts as resistances, the green lines acts as supports. If the price breaks the support/resistance, it will move to the next support/resistance line. White lines indicates previous day high & low, high acts as a resistance & low acts as a support for next day.
Trendlines are also significant to price action. If the price is above/below the trendlines, can expect an UP/DOWN with aggressive move.
Please NOTE: this levels are for intraday trading only.
Disclaimer - All information on this page is for educational purposes only,
we are not SEBI Registered, Please consult a SEBI registered financial advisor for your financial matters before investing And taking any decision. We are not responsible for any profit/loss you made.
Request your support and engagement by liking and commenting & follow to provide encouragement
HAPPY TRADING 👍

#GLS LONG TRADE IDEA SETUPGreetings Folks,
today i have prepared a setup of GLS on NSE
the analysis is as follows
- price is in a range structure right now
- we are looking for a breakout in upper side
- if the price opens with gap up, better to enter at minor retracement
- if price dont breaks the range by noon, we wont initiate the trade
dont play with fire, always use a predefined stoploss

NIFTY INTRADAY LEVELS FOR 06/10/2023" SYMMETRICAL TRIANGLE PATTERN "
BUY ABOVE - 19460
SL - 19430
TARGETS - 19500,19560,19600
SELL BELOW - 19430
SL - 19460
TARGETS - 19380,19330,19260
NO TRADE ZONE - 19530 to 19570
Previous Day High - 19570
Previous Day Low - 19490
I am sharing NIFTY levels this levels acts as important support & resistance for intraday. if you want to trade with this levels wait for 15 min Candle closing above that levels. You can trade with breakout and reversal both.
In this channel, I share my expertise in trading strategies, technical analysis, and market trends to help you make informed decisions in your trading ventures.
Stay tuned for daily updates, in-depth market analyses, and real-time trading scenarios to witness firsthand how we transform from Zero to Hero in the trading world. My Only aim is to empower you with the knowledge and skills necessary to navigate the complexities of the financial markets successfully.
Based on price action major support & resistance's are here, the red lines acts as resistances, the green lines acts as supports. If the price breaks the support/resistance, it will move to the next support/resistance line. White lines indicates previous day high & low, high acts as a resistance & low acts as a support for next day.
Please NOTE: this levels are for intraday trading only.
Disclaimer - All information on this page is for educational purposes only,
we are not SEBI Registered, Please consult a SEBI registered financial advisor for your financial matters before investing And taking any decision. We are not responsible for any profit/loss you made.
Request your support and engagement by liking and commenting & follow to provide encouragement
HAPPY TRADING 👍

BANK NIFTY INTRADAY LEVELS FOR 06/10/2023BUY ABOVE - 44230
SL - 44170
TARGETS - 44310,44390,44550
SELL BELOW - 44120
SL - 44190
TARGETS - 44040,43960,43860
NO TRADE ZONE - 44120 to 44230
Previous Day High - 44390
Previous Day Low - 44120
I am sharing BANK NIFTY levels this levels acts as important support & resistance for intraday. if you want to trade with this levels wait for 15 min Candle closing above that levels. You can trade with breakout and reversal both.
In this channel, I share my expertise in trading strategies, technical analysis, and market trends to help you make informed decisions in your trading ventures.
Stay tuned for daily updates, in-depth market analyses, and real-time trading scenarios to witness firsthand how we transform from Zero to Hero in the trading world. My Only aim is to empower you with the knowledge and skills necessary to navigate the complexities of the financial markets successfully.
Based on price action major support & resistance's are here, the red lines acts as resistances, the green lines acts as supports. If the price breaks the support/resistance, it will move to the next support/resistance line. White lines indicates previous day high & low, high acts as a resistance & low acts as a support for next day.
Trendlines are also significant to price action. If the price is above/below the trendlines, can expect an UP/DOWN with aggressive move.
Please NOTE: this levels are for intraday trading only.
Disclaimer - All information on this page is for educational purposes only,
we are not SEBI Registered, Please consult a SEBI registered financial advisor for your financial matters before investing And taking any decision. We are not responsible for any profit/loss you made.
Request your support and engagement by liking and commenting & follow to provide encouragement
HAPPY TRADING 👍

EIHOTEL - INVEST & HOLD FOR 2 MONTHSEntry Level : 222
SL : 202
Targets : 242,256,273+
52wk High : 274.95
52wk Low : 150.35
Mkt Cap : 139.49 B
Disclaimer - All information on this page is for educational purposes only,
we are not SEBI Registered, Please consult a SEBI registered financial advisor for your financial matters before investing And taking any decision. We are not responsible for any profit/loss you made.
Request your support and engagement by liking and commenting & follow to provide encouragement
HAPPY TRADING 👍

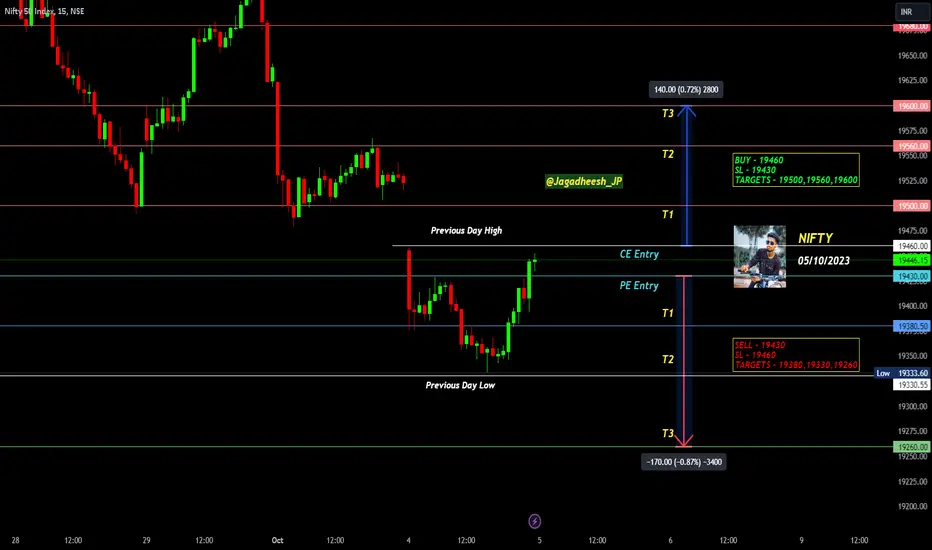
NIFTY INTRADAY LEVELS FOR 05/10/2023BUY ABOVE - 19460
SL - 19430
TARGETS - 19500,19560,19600
SELL BELOW - 19430
SL - 19460
TARGETS - 19380,19330,19260
NO TRADE ZONE - 19430 to 19460
Previous Day High - 19460
Previous Day Low - 19330
I am sharing NIFTY levels this levels acts as important support & resistance for intraday. if you want to trade with this levels wait for 15 min Candle closing above that levels. You can trade with breakout and reversal both.
In this channel, I share my expertise in trading strategies, technical analysis, and market trends to help you make informed decisions in your trading ventures.
Stay tuned for daily updates, in-depth market analyses, and real-time trading scenarios to witness firsthand how we transform from Zero to Hero in the trading world. My Only aim is to empower you with the knowledge and skills necessary to navigate the complexities of the financial markets successfully.
Based on price action major support & resistance's are here, the red lines acts as resistances, the green lines acts as supports. If the price breaks the support/resistance, it will move to the next support/resistance line. White lines indicates previous day high & low, high acts as a resistance & low acts as a support for next day.
Please NOTE: this levels are for intraday trading only.
Disclaimer - All information on this page is for educational purposes only,
we are not SEBI Registered, Please consult a SEBI registered financial advisor for your financial matters before investing And taking any decision. We are not responsible for any profit/loss you made.
Request your support and engagement by liking and commenting & follow to provide encouragement
HAPPY TRADING 👍
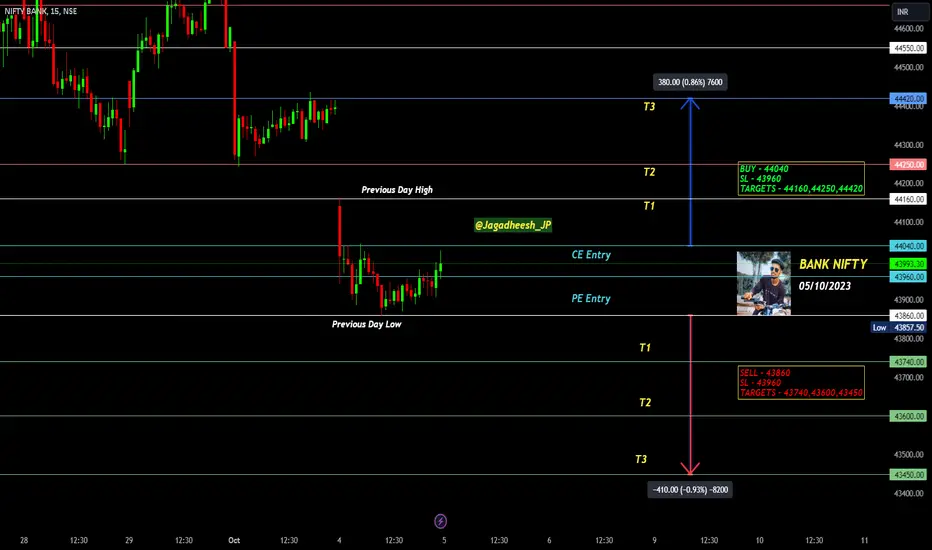
BANK NIFTY INTRADAY LEVELS FOR 05/10/2023BUY ABOVE - 44040
SL - 43960
TARGETS - 44160,44250,44420
SELL BELOW - 43860
SL - 43960
TARGETS - 43740,43600,43450
NO TRADE ZONE - 43860 to 44040
Previous Day High - 44160
Previous Day Low - 43860
I am sharing BANK NIFTY levels this levels acts as important support & resistance for intraday. if you want to trade with this levels wait for 15 min Candle closing above that levels. You can trade with breakout and reversal both.
In this channel, I share my expertise in trading strategies, technical analysis, and market trends to help you make informed decisions in your trading ventures.
Stay tuned for daily updates, in-depth market analyses, and real-time trading scenarios to witness firsthand how we transform from Zero to Hero in the trading world. My Only aim is to empower you with the knowledge and skills necessary to navigate the complexities of the financial markets successfully.
Based on price action major support & resistance's are here, the red lines acts as resistances, the green lines acts as supports. If the price breaks the support/resistance, it will move to the next support/resistance line. White lines indicates previous day high & low, high acts as a resistance & low acts as a support for next day.
Trendlines are also significant to price action. If the price is above/below the trendlines, can expect an UP/DOWN with aggressive move.
Please NOTE: this levels are for intraday trading only.
Disclaimer - All information on this page is for educational purposes only,
we are not SEBI Registered, Please consult a SEBI registered financial advisor for your financial matters before investing And taking any decision. We are not responsible for any profit/loss you made.
Request your support and engagement by liking and commenting & follow to provide encouragement
HAPPY TRADING 👍
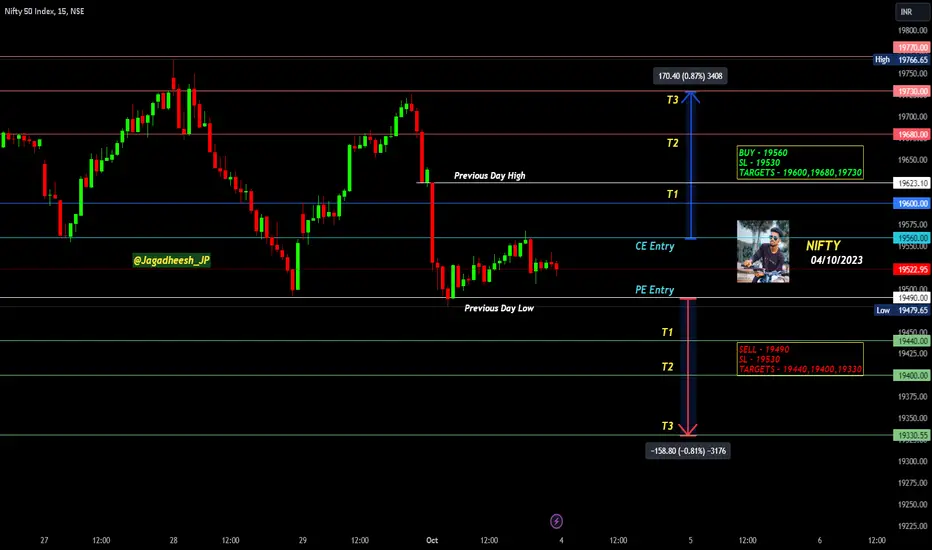
NIFTY INTRADAY LEVELS FOR 04/10/2023BUY ABOVE - 19560
SL - 19530
TARGETS - 19600,19680,19730
SELL BELOW - 19490
SL - 19530
TARGETS - 19440,19400,19330
NO TRADE ZONE - 19490 to 19560
Previous Day High - 19620
Previous Day Low - 19490
I am sharing NIFTY levels this levels acts as important support & resistance for intraday. if you want to trade with this levels wait for 15 min Candle closing above that levels. You can trade with breakout and reversal both.
In this channel, I share my expertise in trading strategies, technical analysis, and market trends to help you make informed decisions in your trading ventures.
Stay tuned for daily updates, in-depth market analyses, and real-time trading scenarios to witness firsthand how we transform from Zero to Hero in the trading world. My Only aim is to empower you with the knowledge and skills necessary to navigate the complexities of the financial markets successfully.
Based on price action major support & resistance's are here, the red lines acts as resistances, the green lines acts as supports. If the price breaks the support/resistance, it will move to the next support/resistance line. White lines indicates previous day high & low, high acts as a resistance & low acts as a support for next day.
Please NOTE: this levels are for intraday trading only.
Disclaimer - All information on this page is for educational purposes only,
we are not SEBI Registered, Please consult a SEBI registered financial advisor for your financial matters before investing And taking any decision. We are not responsible for any profit/loss you made.
Request your support and engagement by liking and commenting & follow to provide encouragement
HAPPY TRADING 👍
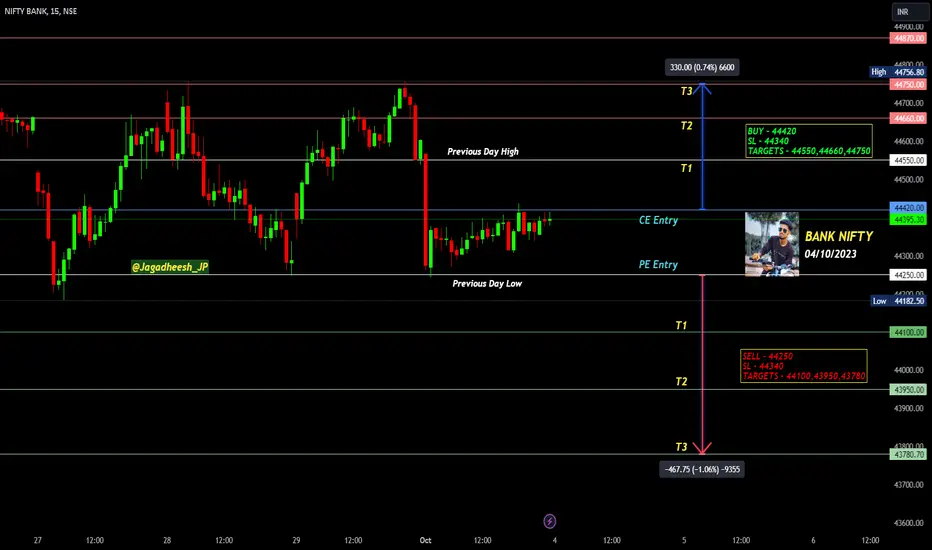
BANK NIFTY INTRADAY LEVELS FOR 04/10/2023BUY ABOVE - 44420
SL - 44340
TARGETS - 44550,44660,44750
SELL BELOW - 44250
SL - 44340
TARGETS - 44100,43950,43780
NO TRADE ZONE - 44250 to 44420
Previous Day High - 44550
Previous Day Low - 44250
I am sharing BANK NIFTY levels this levels acts as important support & resistance for intraday. if you want to trade with this levels wait for 15 min Candle closing above that levels. You can trade with breakout and reversal both.
In this channel, I share my expertise in trading strategies, technical analysis, and market trends to help you make informed decisions in your trading ventures.
Stay tuned for daily updates, in-depth market analyses, and real-time trading scenarios to witness firsthand how we transform from Zero to Hero in the trading world. My Only aim is to empower you with the knowledge and skills necessary to navigate the complexities of the financial markets successfully.
Based on price action major support & resistance's are here, the red lines acts as resistances, the green lines acts as supports. If the price breaks the support/resistance, it will move to the next support/resistance line. White lines indicates previous day high & low, high acts as a resistance & low acts as a support for next day.
Trendlines are also significant to price action. If the price is above/below the trendlines, can expect an UP/DOWN with aggressive move.
Please NOTE: this levels are for intraday trading only.
Disclaimer - All information on this page is for educational purposes only,
we are not SEBI Registered, Please consult a SEBI registered financial advisor for your financial matters before investing And taking any decision. We are not responsible for any profit/loss you made.
Request your support and engagement by liking and commenting & follow to provide encouragement
HAPPY TRADING 👍