SYMPHONY LTD CMP -1280 for 700%%Buy Long term 3-5 Years
Symphony Ltd
Cmp - 1277
Target 11000..
** This Post is for educational purpose Only, Please concern your financial advisor before investing in market related investment**
Nseindia

Nifty weekly Walkthrough and Outlook for next week
Expecting a push down on Nifty towards the daily OB and then a massive displacement towards the upside. The draw remains the same. I want all the buyside of 5th December before another meltdown and second stage distribution on the monthly

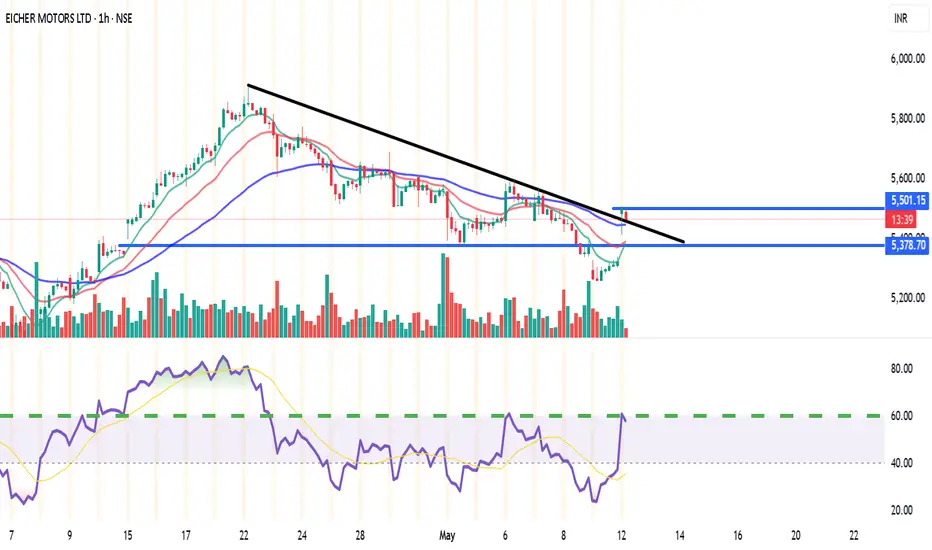
EICHERMOT (NSE) – Bullish Setup on 15min & 1H🔑 Trade Plan:
📥 Buy Above: ₹5485 (above current resistance & candle body highs)
🎯 Targets:
T1: ₹5527 (Pivot R1)
T2: ₹5555
🛡️ Stop Loss: ₹5380 (below 13 EMA & Supertrend support)
📊 Technical Signals:
RSI: 58.08 – Bullish momentum, still room to run
%B (BB): 0.77 – Close to breakout from upper band
EMA Crossover: 9 EMA > 13 EMA – Short-term bullish crossover confirmed
Supertrend: Support at ₹5322, aligning with bullish reversal
Volume: Spike during recent green candles signals strong buying interest
⚙️ Strategy Notes:
Use 15min chart for entry timing post breakout
Tighten SL to cost after T1 hits
Ideal for short-term intraday/swing traders
For Education Purposes Only
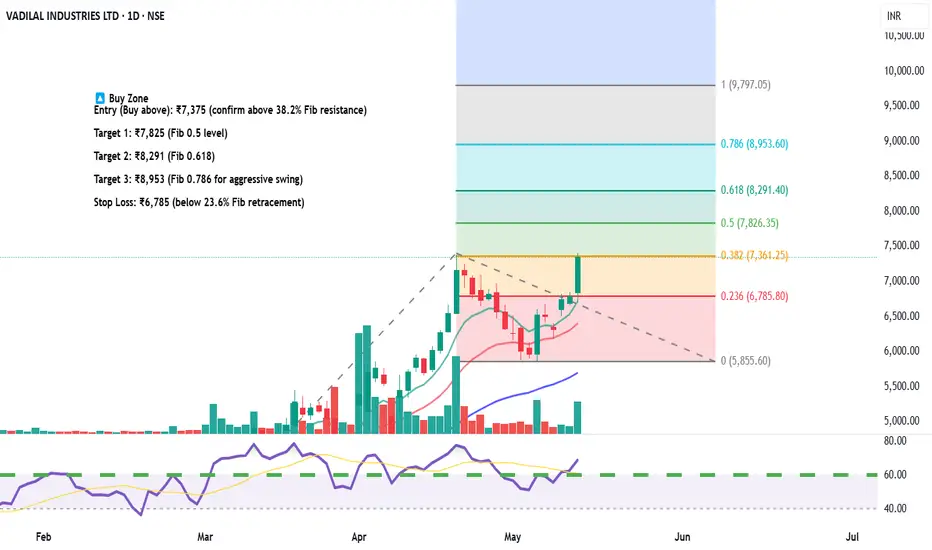
Vadilal Industries – Equity Trade Setup & Research View🟢 Long Trade Setup (Bullish Reversal Play)
Current Price: ₹7,346.50
Fibonacci Level Tested: 38.2% at ₹7,361 — a crucial breakout level
Trendline Breakout: Price has broken above falling trendline with volume confirmation
RSI: Near 60 – bullish momentum building
🔼 Buy Zone
Entry (Buy above): ₹7,375 (confirm above 38.2% Fib resistance)
Target 1: ₹7,825 (Fib 0.5 level)
Target 2: ₹8,291 (Fib 0.618)
Target 3: ₹8,953 (Fib 0.786 for aggressive swing)
Stop Loss: ₹6,785 (below 23.6% Fib retracement)
🔻 Short Trade Setup (if rejection happens)
Sell Below: ₹7,200
Target: ₹6,785
Stoploss: ₹7,375
📅 Timeframe: Daily (1D)
📊 Risk/Reward Ratio: 1:2.5+
🔁 Valid for: Next 2–4 weeks
For Education Purposes Only
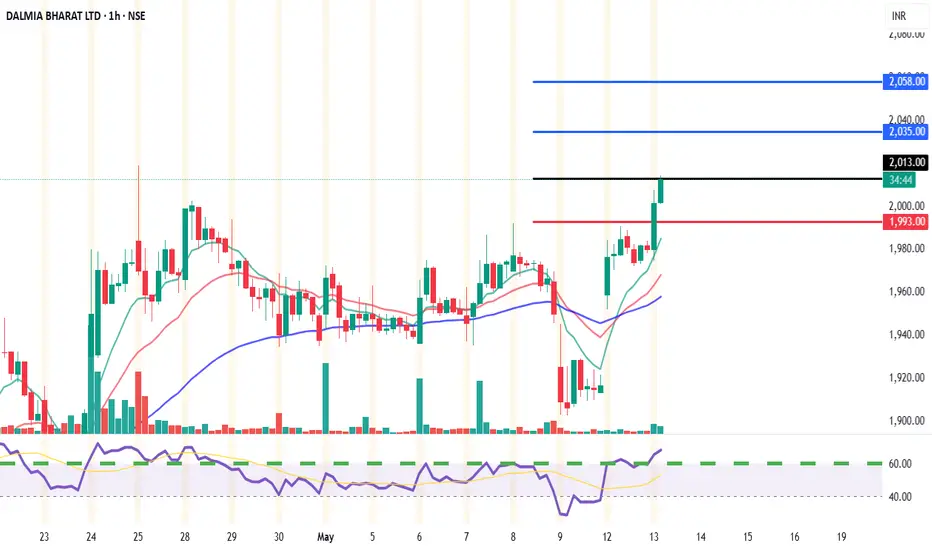
Trade Setup: DALMIA BHARAT (NSE)📊 Chart Summary:
Current Price: ₹2,009
EMA Support: 9 EMA (₹2,003.57) | 26 EMA (₹1,993.31)
Volume: Increasing with bullish candles
Price Action: Sustaining above key pivot and EMA levels
Momentum: Strong with minor consolidation
✅ Intraday Buy Setup (15min & 1h)
Buy Above: ₹2,013.50 (Break of intraday resistance zone)
Targets:
🎯 Target 1: ₹2,035.80 (Pivot R2)
🎯 Target 2: ₹2,058.30 (Pivot R3)
Stop Loss: ₹1,993 (below 26 EMA and pivot zone)
Risk:Reward: ~1:2 or better
For Education Purposes Only
Gabriel India Ltd (GABRIEL) – Weekly Resistance Breakout Setup✅ Trade Idea:
Price has reclaimed the 0.618 retracement at ₹608.25
Breakout above the ₹612 horizontal level (weekly closing basis)
Volume is rising and RSI shows strong uptrend
💰 Buy Zone:
Entry: ₹610 – ₹613
(preferably above ₹612 on strong 15min or 1H candle close)
🎯 Targets:
T1: ₹630 (previous minor supply zone)
T2: ₹646.65 (Fib 0.786 level)
T3: ₹695.55 (Fib 1.0 extension)
T4: ₹836.85 (1.618 extension for swing positional)
🛑 Stop Loss:
Intraday SL: ₹598 (below 9 EMA on 1H)
Swing SL: ₹581 (Fib 0.5 retracement support)
🔁 Strategy:
Wait for confirmation via volume + RSI > 60
Trail SL to ₹610 once ₹630 is hit
Lock partial profit near ₹646 if market sentiment weakens
For Education Purposes Only

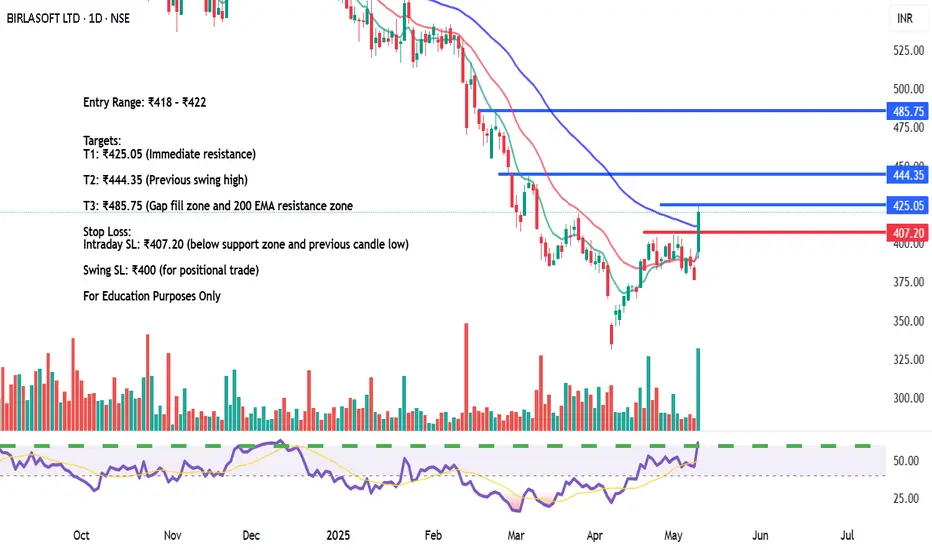
BIRLASOFT LTD – Bullish Reversal with Volume Surge✅ Trade Plan:
Stock gave a bullish breakout with a large green candle & volume spike
RSI crossed 60 level – bullish strength confirmed
Price broke above short-term resistance zone at ₹407 and nearing ₹425
💰 Buy Zone:
Entry Range: ₹418 – ₹422 (on 15min or 1H candle close above ₹420)
🎯 Targets:
T1: ₹425.05 (Immediate resistance)
T2: ₹444.35 (Previous swing high)
T3: ₹485.75 (Gap fill zone and 200 EMA resistance zone)
🛑 Stop Loss:
Intraday SL: ₹407.20 (below support zone and previous candle low)
Swing SL: ₹400 (for positional trade)
🔁 Strategy:
Scalp at ₹425 with 30–40% booking
Hold rest for breakout continuation toward ₹444+
Trail SL to ₹415 once above ₹425
For Education Purposes Only
Bajaj Finserv Ltd scending Triangle formation on the monthly📌 Trade Setup: Bajaj Finserv Ltd (NSE)
Pattern: Ascending Triangle
Timeframe: Monthly
Signal: Approaching breakout of horizontal resistance zone
✅ Buy Recommendation
Buy above: ₹2,075 (Monthly close above resistance confirms breakout)
Aggressive entry: ₹2,035 (Current level with early risk)
Target 1: ₹2,400
Target 2: ₹2,750
Target 3: ₹3,000+ (Long-term projection from triangle height)
❌ Stop Loss
SL: ₹1,850 (Below recent swing low and trendline support)
for educational purposes only

E-mini Nasdaq 100 Weekly Overview & Outlook for next weekIntroduction of Gap Quadrants. Weekly Orderflow Review. Expecting classic Weekly "Power of Three" next week. Along with a SMT Divergence on the lows with ES1!

DIVISLAB: Eyeing Breakout from A-B-C ChannelDaily TF
DIVISLAB is nearing the completion of a complex W-X-Y corrective pattern. A long position could be considered after a breakout from the A-B-C channel, with potential targets in the 6100–6400 range.
I will update more information soon.

Nifty is not going north anywhere till 2026This is completely based on neowave time rules.
Nifty may go down slow and steady towards16900 by Dec 2026
Nifty May go up and make a new high and will fall back to 20900 by Dec2026
Nifty may get restricted going down much or up. Will settle at 18850 by Feb 2026.
We are in double formation from top. 1st Phase is in progress. 2nd Phase of selling may start from Late Aug or Early Sep.
Labels are hidden on purpose.

CIPLA CHANNEL BREAKOUT AND FORMING CUP HANDLECipla broke long term Channel and doing retest on Daily TF
Cup and handle forming on 1 hr TF
Buy on dips till 1440-1445
Idea Invalid if closing below 1434 on Daily TF

LEMONTREE HOTELS 240 MINS TIME FRAMEThe Structure looks good to us, waiting for this instrument to correct and then give us these opportunities as shown on this instrument (Price Chart).
Note: Its my view only and its for educational purpose only. Only who has got knowledge about this strategy, will understand what to be done on this setup. its purely based on my technical analysis only (strategies). we don't focus on the short term moves, we look for only for Bullish or Bearish Impulsive moves on the setups after a good price action is formed as per the strategy. we never get into corrective moves. because it will test our patience and also it will be a bullish or a bearish trap. and try trade the big moves.
We do not get into bullish or bearish traps. We anticipate and get into only big bullish or bearish moves (Impulsive Moves). Just ride the Bullish or Bearish Impulsive Move. Learn & Know the Complete Market Cycle.
Buy Low and Sell High Concept. Buy at Cheaper Price and Sell at Expensive Price.
Please keep your comments useful & respectful.
Keep it simple, keep it Unique.
Thanks for your support
Tradelikemee Academy
Saanjayy KG


HBL ENGINEERING- BEAR CASE: POTENTIAL H&SHBL ENGINEERING- Potential H&S Forming, bear case scenario
Break of the crucial support decisively( full candle close) can test the low wicks earlier tested twice at 360-370 levels also.
Keep a watch on the results also.

Bharti Airtel Trade Setup | High-Risk, High-Reward OpportunityHere's an exciting analysis of Bharti Airtel Ltd based on the chart! 📊🚀
🔥 Trade Setup & Key Levels
📥 Entry Zone: 1657 - 1674 (Smart buy zone)
🛑 Stop-Loss (SL): 1592 (Risk protection)
🎯 Target Profits (TP):
TP1: 1737 (First milestone 🥇)
TP2: 1778 (Stronger bullish push 📈)
TP3: 1858 (Big breakout potential 💥)
📌 Observations & Strategy
Current Price: 1619.75 (-2.45%) 📉 → Price is below the entry zone, meaning a potential bounce or more downside.
RSI & Indicators: Oversold conditions ⚠️ → Possible buyer interest soon!
Risk-Reward Ratio: A great setup with a high reward vs. risk trade! 🔥
🚀 What’s Exciting?
If support at 1592 holds, we could see a bullish explosion 🚀🔥
A break above 1657 might trigger a rally toward 1737+ levels 📈💰
If 1592 breaks down, a deeper fall might be in play ⚠️📉
This setup is high-risk, high-reward—perfect for traders looking for a strong breakout move! 💎 What do you think? 🤔
⚠ Disclaimer: I am not SEBI registered. Stocks and securities are subject to market risk 📉📈. Please read all levels carefully before making any trading decisions.
📊 Follow for more insights & trade setups! 🚀

BAJAJHFL Short term IdeaBAJAJHFL is at breakout level. It has tested the TL 2 times and now the swing broke.
People who are looking for low risk and High reward can look this.
This is not a call, please analyze and consult your financial advisor before investing.
Entry can be at Spot(115.29) or safe players can enter above 120, your Risk will be 110(Stoploss) and Targets T1 - 145, T2 - 180.
Estimated Holding time - 3 to 6 months, maximum - 1 year

HBL Engineering- Possible DOUBLE BottomPossible Double Bottom formed by HBL Engineering, major support held 515-520 on the weekly chart. Breakout above its 726 resistance with a clear close above should target 1000 gradually( the break out target)

47% GROWTH》GODREJPROP SHOWING A GOOD REVERSAL SIGN FROM BOTTOMRecently NSE:GODREJPROP almost drawdown 19% from recent high and we plan for almost 47% upward potentially reward.
🔔 NOTE:
➡️ ENTRY ONLY IF the weekly candle CLOSES ABOVE 2550 INR.
📊 Godrej Properties (GODREJPROP) is exhibiting a positive reversal from its bottom levels. However, ⚠️ signs of weakness remain visible.
✅ Suggestion:
Wait for a strong confirmation with the weekly close above 2550 INR to enter.
Once confirmed, bullish momentum could target long-term profits at the 3802 INR level.
🎯 TARGET LEVELS
TP-1 🟡: 2836.25 INR
TP-2 🟠: 3026.00 INR
TP-3 🟢: 3405.90 INR (50% Profit Booking Recommended Due to Resistance ⚒️)
TP-4 🟩: 3802.00 INR (Long-Term Target – 9 to 12 Months 🚀)
📉 STRICT STOP LOSS (SL):
2240.90 INR 🚫 (Ensure proper risk management here!)
⚡ Action Plan:
If entry conditions are met, follow the targets and risk levels carefully. This stock offers an excellent reward-to-risk ratio, but confirmation is key! 🕒
🔴DISCLAIMER:
I AM NOT A SEBI-REGISTERED ANALYST. SECURITIES AND INVESTMENTS ARE SUBJECT TO MARKET RISKS. PLEASE READ AND UNDERSTAND THE TRADING IDEA CAREFULLY BEFORE MAKING ANY INVESTMENT DECISIONS. INVEST WISELY AND AT YOUR OWN RISK. 📉📈
If you find this really helpful
Like,share,subscribe @Alpha_strike_trader

"LONG" NIFTY 50 is approaching The "Accumulation Zone" (LTCIG)1. Key observation
Accumulation Zone 🟢
The chart identifies a critical "Accumulation Zone" between 22,600–22,800, highlighted in green.
This area serves as a strong support zone where buyers may step in, halting the current downtrend.
Significance: If NIFTY consolidates here, it could build momentum for a powerful reversal and potentially new all-time highs. 🚀
2. Notes on NIFTY Movement ✍️
"NOTE: NIFTY HAVE TO COME IN THIS ZONE FOR FLY UPWARD NEW HIGH" 🛫
This means for NIFTY to reach new heights, it must revisit and hold this accumulation zone.
Watch for bullish patterns like hammer candlesticks or breakouts in this region to confirm upward movement. 🔥
3. Best Price Range for Investments 💰
"BEST PRICE RANGE TO DO A LONG-TERM INVESTMENT" 🏦
Investors can find opportunities in this zone, with stocks available at significant discounts (40–60% off).
A perfect time for those planning long-term gains as the zone may represent undervaluation. 📈
4. Technical Indicators 🔍
RSI (Relative Strength Index):
Positioned near the oversold zone, indicating the downtrend is losing momentum and reversal is likely. ⚡
MACD (Moving Average Convergence Divergence):
The histogram shows weakening bearish momentum, further supporting the case for a reversal. 🔄
5. Resistance and Breakout Levels 🟡
If NIFTY holds the accumulation zone, key resistance levels to watch:
23,300 and 23,700.
Breaking these could pave the way for new all-time highs! 🌟
6. What to Watch For 👀
Volume Confirmation:
A spike in buying volume around this zone will validate accumulation and signal strong upward momentum.
Price Action:
Look for bullish candlestick patterns like hammers, engulfing, or inside bars.
Conclusion 🏁
NOTE↣ NIFTY 50 is approaching a pivotal moment. The "Accumulation Zone" offers an opportunity for traders and investors alike. 📉➡️📈
If this zone holds, expect a potential reversal with NIFTY aiming for new highs. 🚀🔥
Keep an eye on price action, volume, and RSI to confirm the trend! Happy Trading! 💹
🔴Disclaimer:
I am not a SEBI-registered advisor. This analysis and the suggested levels are for educational purposes only.Investments and securities are subject to market risk. Please carefully assess your risk tolerance before making any decisions.
If you really like this idea please iike,share,subscribe @Alpha_strike_trader

ZOMATO- KEY PRICE LEVELSThe entire move from the Flash crash level of JUNE 4 on ZOMATO
Targets at lower levels marked, should hit the 0.618 FIB level if we see move below 226 where it stopped yesterday.
May not break 200-207, wick down to 200 possible but likely to hold barring a major sell off
Stops below 200 for short term trades when it does come down to 210 odd


A LONG-TERM INVESTMENT IN AMARA RAJA ENERGY MOBILITY LTD (ARE&M)A long-term investment opportunity in Amara Raja Energy Mobility Ltd (ARE&M), here's an analysis of the chart and a suggested approach:
☣️Key Insights:
1. Price Correction:
The stock has seen a correction of 49%, making it an attractive level for long-term accumulation.
2. Strong Support Zone:
Identified between ₹992–₹1,011. This is a critical area to monitor for stability and potential reversal.
3. ✅️Targets (TP):
🟢TP-1: ₹1,160.80
🟢TP-2: ₹1,363.90
🟢TP-3: ₹1,541.20
4. 🔴Stop Loss (SL):
₹941.00, to manage risks in case of further downside.
5. ✅️Entry Zone:
Around ₹1,001.55, which aligns with the strong support levels.
⚪️Long-Term Outlook:
Sector Potential: As ARE&M operates in the energy and mobility domain, it benefits from macro trends favoring renewable energy and electric mobility solutions.
Recommendation: Accumulate near the support zone and hold for long-term targets. Monitor price action and adjust the strategy if the stock closes below ₹941.
🔴Disclaimer:
I am not SEBI registered. This information is purely for educational purposes and not financial advice. The securities market is subject to market risks; please do your own research. Thanks😊
If you like this idea
👍Like,share,subscribe 👋@Alpha_strike_trader
