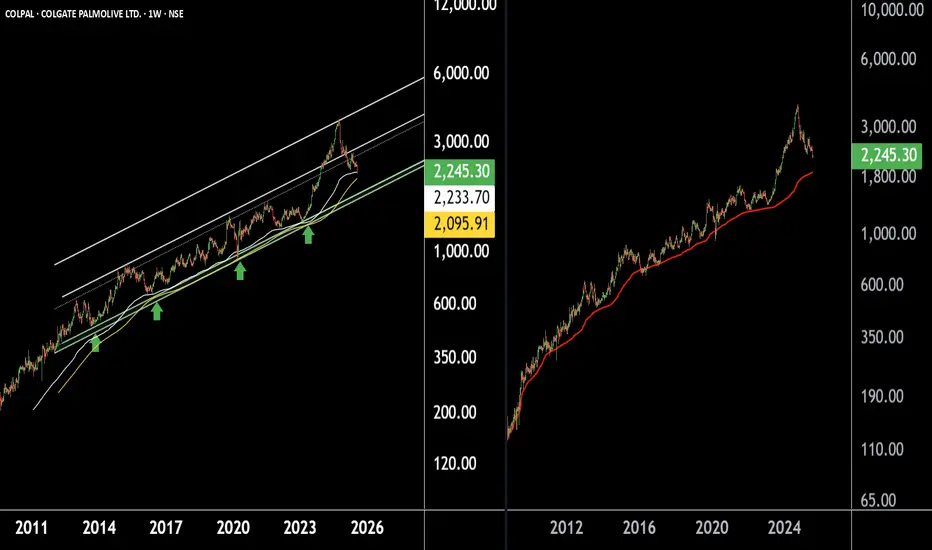
Colgate Palmolive – A Safe Haven Stock for Long-Term InvestorsThere are two chart of Colpal.
COLPAL is moving in well defined parallel channel with support near at 1750-1850.
COLPAL is taking support on Ema with near at 2050-2150.
COLPAL is taking support near its AVWAP zone, which lies between ₹1800–₹1900.
If this level is sustain then we may see higher prices in COLPAL.
Thank You !!
Nsestocks
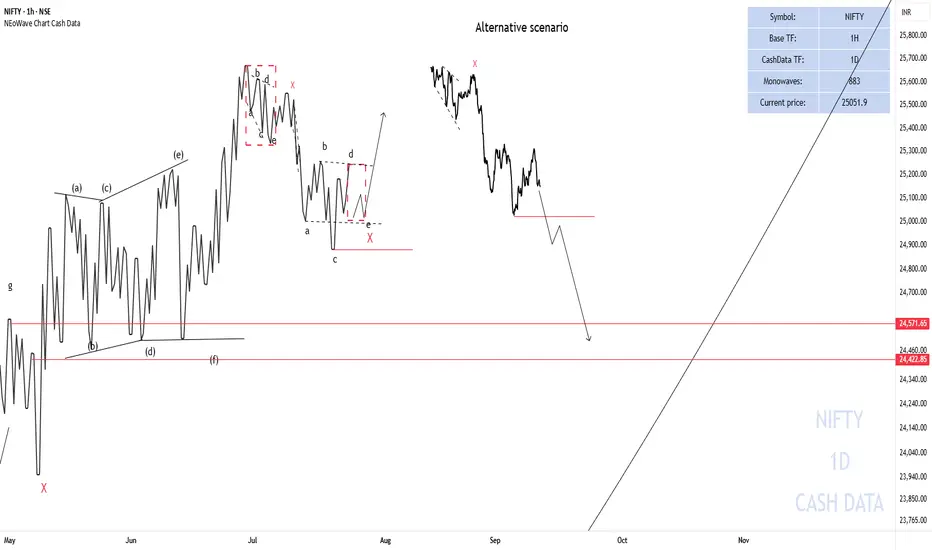
NIFTY50 Analysis ScenariosNIFTY briefly went below 25000 points but could not consolidate so a possible scenario is that X- wave is forming, triangle - X - triangle and then the upward movement starts.
Alternative scenario
If the end of wave-c of the reverse triangle breaks (red horizontal line), NIFTY could decline to the specified range.
Good luck
NEoWave Chart
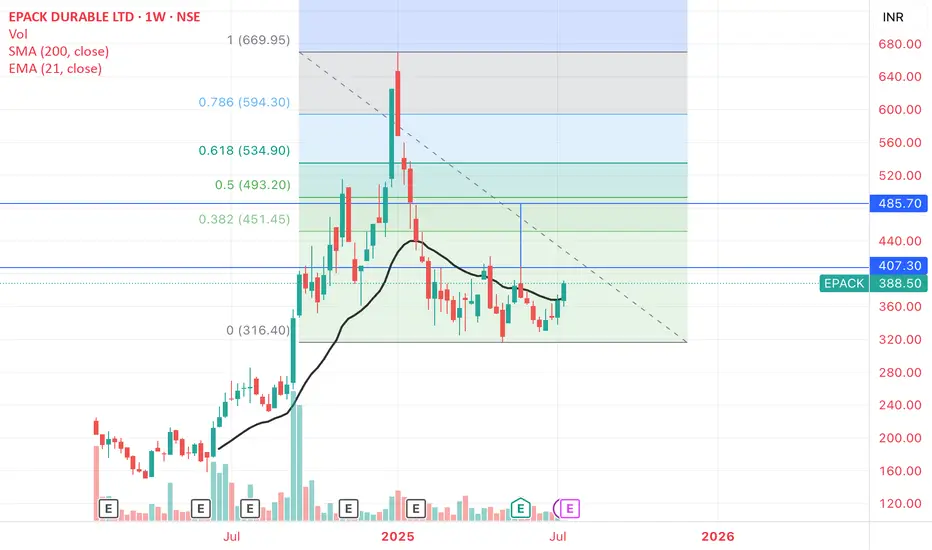
E-PACK_ Potential Double Bottom and TargetsE-PACK DURABLE: Potential Double Bottom with Resistance 407-410 zone.
Weekly close above it - Target 480-490 , that is also the 50% retrace Fib Level of the entire fall from the peak
Weekly close and support held at 407-410 matters
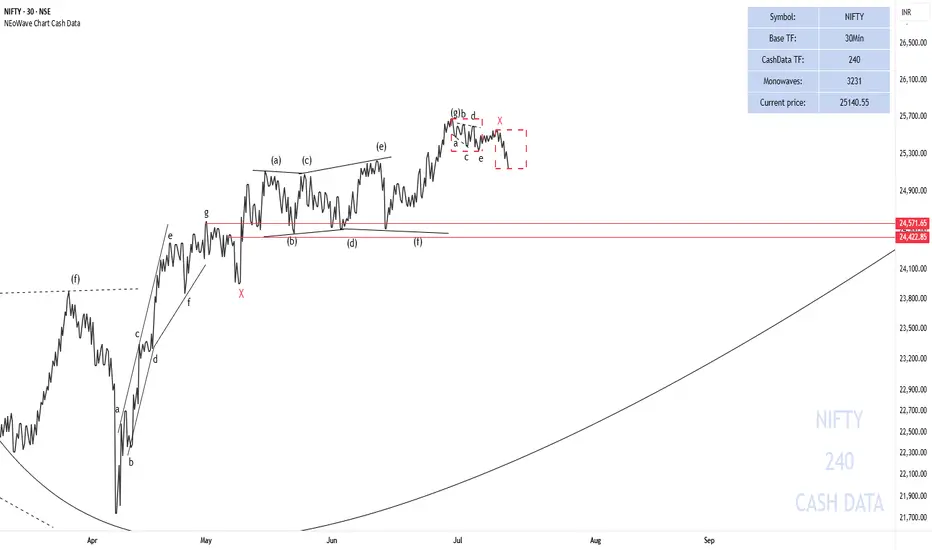
Will NIFTY make a price correction?
My first scenario is still valid and I think it is more likely to happen. It seems that Wave-g has ended from the second pattern and I think NIFTY50 will decline at least to the price range of the X-wave and there we need to check the waves again to see what pattern is forming. To confirm this scenario, a break below the key level of 25000 is very important.
I have also proposed a second scenario that this correction may be an X-wave and after that the price can eventually grow to 25680-26133 and spend time there to complete the third pattern. This scenario is also valid as long as the price remains above the level of 25000.
The price correction that is forming can be a double combination pattern like triangle - X - diametric or triangle - X - triangle.
Good luck
NEoWave Chart
Good luck
NEoWave Chart

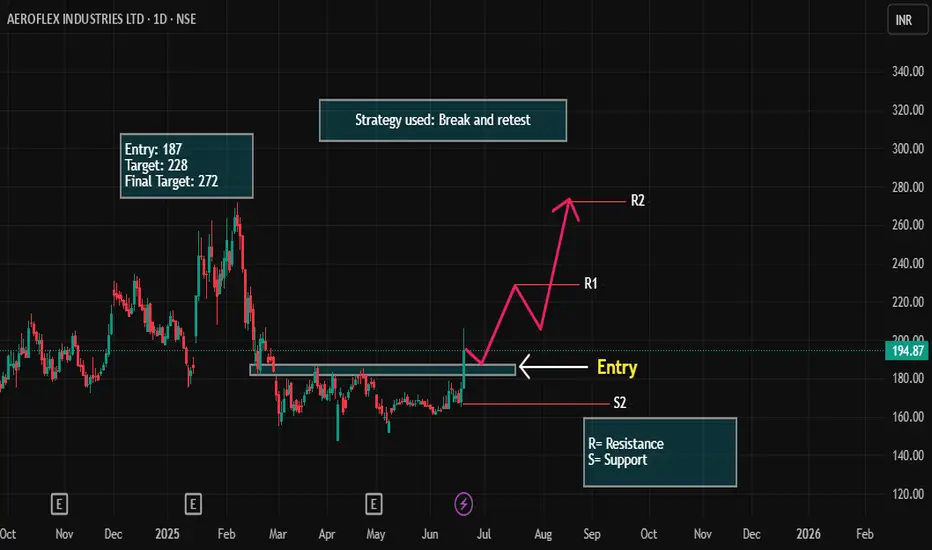
AEROFLEX LONG Setup!Stock: Aerofle (AERF)
Current Market Price (CMP): ₹194
Entry Point: ₹187
Target: ₹228
Final Target: ₹272
Stop Loss (SL): Below Support 2
Trade Setup with Stop Loss:
Entry at ₹187: As mentioned earlier, you plan to enter at ₹187, which is lower than the current market price of ₹194. You're waiting for a pullback to this level, anticipating the stock will rebound from this price and head higher.
Target at ₹228: This is your first price target, where the stock is expected to face resistance. Once the stock hits ₹228, it might experience some pullback or consolidation.
Final Target at ₹272: This is the key level where you're aiming for the stock to reach, assuming the trend continues. ₹272 is your ultimate exit target.
Stop Loss (SL) Below Support 2:
The stop loss is placed below Support 2, which is a lower level of support. By positioning the stop loss here, you're allowing for some price fluctuation, but you’re limiting your downside risk in case the trade doesn’t play out as expected. Support 2 serves as a critical level, and if the price falls below this, it could indicate a reversal or breakdown of the trend.
Why This Setup Works:
Support 2 is your safety net. If the stock breaks below this level, it suggests that the uptrend is invalidating, so exiting with minimal loss is a good risk management strategy.
You're using the break and retest strategy with Support 2 as a critical level to protect against a major downtrend. If the stock holds above ₹187 and moves up to ₹228 and beyond, your risk-to-reward setup is favorable.
Trade setup HINDZINCHINDZINC Is approaching a key support level at 440. This level is critical for determining the stock's next move. A breakdown below 440 could signal increased bearish momentum, potentially leading to further downside. On the other hand, if the 440 level holds strong and shows signs of support, it could mark the beginning of a bullish reversal. In that case, there's a significant upside potential, with a possible long-term target around 655. For now, it's important to stay patient and wait for a clear signal—either a breakdown or a bounce from the current level—before making any trading decisions.

Complete trade setup! Kindly follow all key levels and resistance marked on the chart. Be patient — waiting is the key in trading.
STLTECHYeah, the stock’s looking bullish, but don’t jump into a moving train. Let it cool down a bit—around ₹95 looks like a solid entry. That’s when we hop on and ride the move safely.

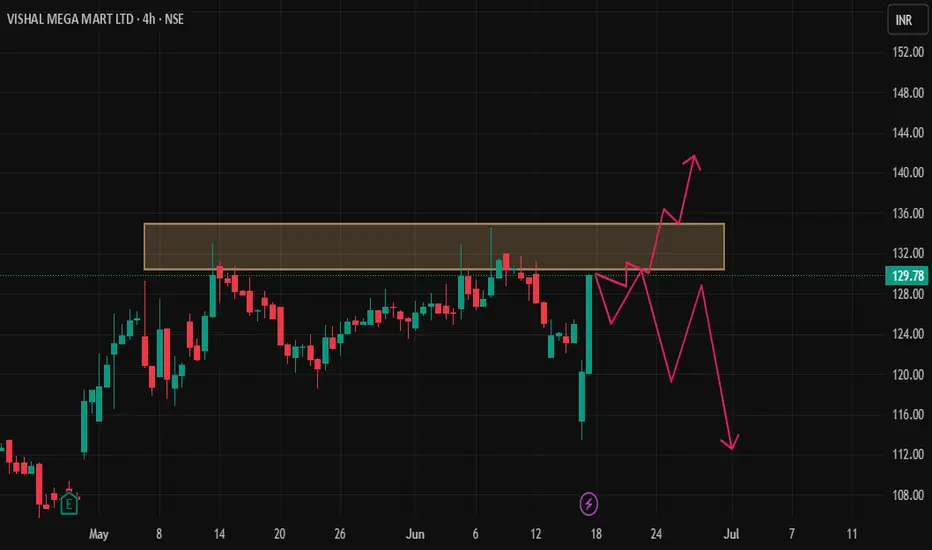
VMM Trade planFor VMM, the market is currently at a crucial zone. There are two possible scenarios: either we break the high key level and continue the bullish momentum, or we drop below the current support, triggering a bearish move. At this point, there’s no clear trade setup. We’ll wait for confirmation in either direction before taking any position to minimize risk and ensure better entry.
IDIA Range Accumulation – Bullish Only With Fundamental TriggerThe stock is currently trading inside a tight range, indicating a phase of consolidation.
📉 Buy Zone: ₹6.38
I’m planning to accumulate if price drops near this zone. From a technical view, it’s a strong demand area. However, for the bullish breakout to sustain, we’ll need strong fundamental support — like earnings, news, or sector momentum.
🔍 If fundamentals align, this could become a long-term multibagger setup.
✅ Strategy:
Wait for ₹6.38 zone
Accumulate small quantities
Hold for long-term with regular news tracking
💬 What do you think?
Would you wait for breakout or buy inside the range?
#TechnicalAnalysis #SwingTrade #LongTermView #SupportZone #BreakoutSetup #StockMarketIndia

CESC Ltd – Short-Term Breakout Idea|Target: ₹171.00 CMP: ₹165.70
Recommended Buy Range: ₹164.50 – ₹165.00
Target: ₹171.00 🎯
Stop Loss: ₹161.50 🛡️
Timeframe: 15 min & 1H
Risk-Reward: ~1.4:1
Type: Momentum Breakout / Swing Trade
🔍 Technical Analysis:
✅ EMA Cross (9/13) bullish crossover
✅ Price trading above EMA-26
✅ RSI at 65 – bullish, not overbought
✅ BB %B around 1.0 – strong upper band breakout
✅ Volume spike supports the move
Watch for a strong close above ₹167 to confirm momentum toward ₹171.
For Education Purposes Only

PEL | Breakout Setup | Short-Term Buy | Target ₹1100🟩 Trade Plan:
Buy Zone: ₹1059 – ₹1060
Target: ₹1100 (approx. 3.77% upside)
Stop Loss: ₹1037
Risk-Reward Ratio: ~2:1
Setup Type: Breakout above resistance zone (marked on chart)
Volume Confirmation: Strong bullish candle with high volume
RSI Confirmation: RSI bouncing above 60, momentum building
📈 Chart Annotations (TradingView Tips):
Draw resistance zone on 1H around ₹1060 – ₹1070 (breakout zone)
Plot EMA (9 & 21) or EMA crossover to confirm short-term bullish trend
Use RSI (14) to highlight momentum breakout
Highlight entry point, stoploss, and target with labels
Use TradingView’s “Long Position Tool” to visually display RR
For Education Purposes only

ENDURANCE – Breakout from Supply Zone | Target ₹2136 ⚙️ ENDURANCE TECH LTD (NSE:ENDURANCE)
Time Frame: 15min / 1 Hour
📊 Trade Type: Positional / Intraday Momentum
📌 Buy Zone: ₹2042 (Above supply zone breakout)
🎯 Target 1: ₹2136
🎯 Target 2: ₹2287
🛑 Stop Loss: ₹1915
📈 CMP: ₹2022.60
📌 Chart Insights:
✅ Strong volume breakout from horizontal resistance
✅ Cleared EMA 9/13/26 crossover
✅ RSI > 60 indicates bullish momentum
✅ Bollinger Band breakout (BB %B > 1.00)
✅ Breaking above pivot R2 zone (₹2042) opens room to R3
⚠️ Strategy:
Enter on confirmation above ₹2042 with volume support on 15min or 1H timeframe.
Stop loss below breakout candle or EMA cluster around ₹1915.
Trailing stop as it approaches targets.
For Education Purposes Only

PB Fintech (NSE: 543390) Trade Setup📈 Breakout Watch | Price retesting key pivot at ₹1,745
Momentum building with RSI > 60 and bullish structure. Ideal for intraday or short swing.
🔵 Long Entry
Buy Above: ₹1,745 (Pivot breakout confirmation on 15m/1H candle close)
Target 1: ₹1,775 (minor resistance)
Target 2: ₹1,807 (next pivot)
Target 3: ₹1,869 (final swing target)
Stoploss: ₹1,720 (below previous candle low/support zone)
✅ Volume confirmation and RSI strength supporting move
🧠 Good for breakout traders looking for momentum continuation
🔴 Short Setup (if rejection from ₹1,745)
Sell Below: ₹1,730 (on rejection + bearish candle)
Target: ₹1,682
Stoploss: ₹1,745
📊 Indicators:
RSI: 65.7 → bullish, near breakout threshold
BB% B: 0.88 → strong bullish move near upper band

SBFC FINANCE Breakout from Long Consolidation | Strong Volume✅ Recommendation: Buy (Post-Breakout Strategy)
CMP: ₹108
Buy Zone: ₹106–₹108 (current price is still within a safe buying range after breakout)
Target 1: ₹120
Target 2: ₹135
Stop-Loss: ₹98 (just below breakout zone)
Risk-Reward Ratio: ~1:2 (ideal)
⚠️ Caution
Don’t chase if the price shoots up quickly from here. Wait for minor dips toward ₹106 to enter.
If price closes below ₹98 with volume, the breakout may fail — consider exiting.
for educational purposes only

Equity Research Report – CARE Ratings Ltd (CARERATING)🔹 Technical Outlook
Stock has broken out of a horizontal resistance near ₹1,237 with volume pickup.
RSI is above 60, indicating momentum strength.
Short-term EMAs are crossing over the 50-day EMA — bullish signal.
Volume confirms accumulation.
🛒 Trade Setup
✅ Short-Term View (Swing/Positional Trade):
Buy above: ₹1,240 (on closing basis)
Target 1: ₹1,320
Target 2: ₹1,375
Stop-Loss: ₹1,185
Timeframe: 2–4 weeks
🏦 Long-Term View (Investor Strategy):
Buy Range: ₹1,180–1,240
Target 1: ₹1,450
Target 2: ₹1,580
Stop-Loss: ₹1,080 (weekly close)
Timeframe: 3–6 months
for educational purpose only

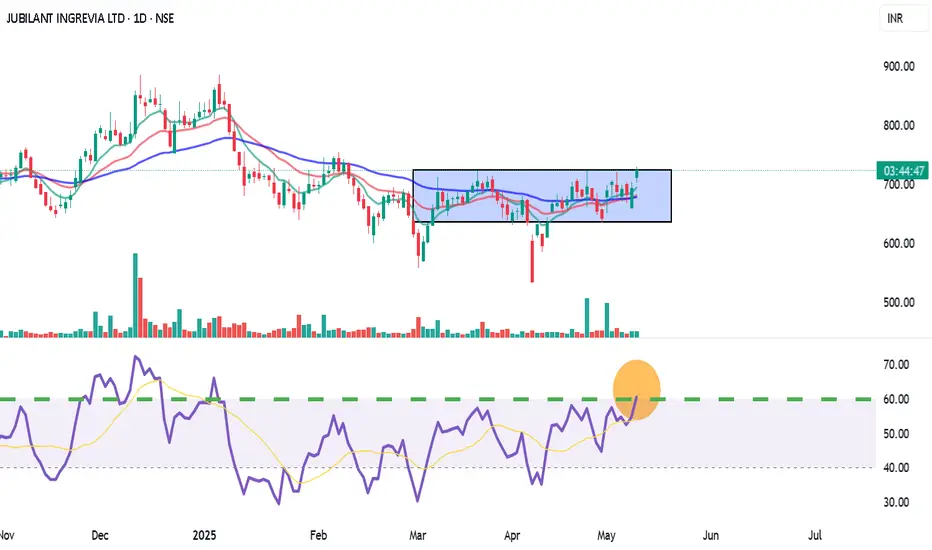
Jubilant Ingrevia (JUBLINGREA) – Short-Term Breakout Trade LTP: ₹726.30 | Recommended Entry: ₹722.00 – ₹723.00
Type: Short-Term Swing / Intraday MTF Trade
✅ Trade Setup:
Breakout above horizontal resistance near ₹725.75
9 EMA has crossed 26 EMA (bullish momentum)
RSI at 60.84 – strong trend, room for upside
BB %B: 0.96 – price pushing upper band = momentum buying
Good volume breakout on daily TF confirms buying interest
🟢 Buy Zone: ₹722 – ₹723
🔁 On retest or 15-min candle close above ₹725.75 with volume
🎯 Targets:
T1: ₹738
T2: ₹750 (supply zone / fib level)
T3: ₹765+ (if breakout sustains in 1H)
🛑 Stop Loss:
Conservative SL: ₹707 (below support + 9EMA)
Aggressive SL: ₹712 (tight SL for intraday)
For Education Purposes Only
Equity Research Report – Paras Defence & Space Tech Ltd Technical Summary
Volume Spike: Sharp surge in volume confirms breakout strength.
Resistance Flipped: ₹1,299 now acting as strong support.
Momentum: RSI near 75 (overbought but strong bullish trend), indicating short-term potential with caution.
Moving Averages: 20/50/200 EMA crossover in bullish alignment.
🛒 Trade Setup
Short-Term View (Swing/Positional Trade):
Buy Zone: ₹1,315–₹1,330 (on dip near support ₹1,299)
Target 1: ₹1,435
Target 2: ₹1,475
Stop-Loss: ₹1,255 (below support & 5-day EMA)
Timeframe: 2–3 weeks
Short-Term View (Swing/Positional Trade):
Sell Zone below: ₹1,299
Target 1: ₹1,222
Target 2: ₹1,200
Stop-Loss: ₹1,255
For Education purposes only

Analysis and Summary of the ADITYA BIRLA CAPITAL LTD. (NSE: ABCA🔍 Technical Overview:
Current Price: ₹200.25
Recent Price Action: Price is attempting a bounce after forming a higher low near ₹187.83.
📈 Key Technical Levels:
Fibonacci Levels:
0.0 (Support): ₹187.83
0.5 (Mid-Resistance): ₹204.67
0.618 (Golden Ratio): ₹208.64
1.0 (Previous High): ₹221.51
1.618 (Target Extension): ₹242.33
📐 Pattern Forming:
A descending triangle or falling wedge pattern seems to be forming, indicated by the downward sloping trendline from the recent highs. This setup can break out in either direction but often has a bullish bias when occurring in an uptrend.
📊 Interpretation:
Bullish View:
A break above ₹204.67 (0.5 Fibonacci level) could push prices toward ₹208.64, then ₹221.51.
If ₹221.51 breaks, ₹242.33 is the long-term Fibonacci extension target.
Bearish View:
A breakdown below ₹187.83 may trigger further correction.
This would invalidate the bullish setup.
🧠 Conclusion:
The stock is currently consolidating between key resistance at ₹204–208 and support at ₹187. A breakout above ₹208.64 will confirm bullish momentum. Watch for volume spikes and candlestick confirmation around those key levels.

Equity Trade Setup – Siemens Ltd. (NSE: SIEMENS)Trade Type: Breakout + Channel Trend Continuation
🔹 Trade Details
Buy Zone (Entry): ₹2,982.00 – ₹2,987.00
Current LTP: ₹2,970.00
Stoploss (SL): ₹2,887.00 (below recent swing support)
Target (T1): ₹3,150.00
Target %: ~5.46%
Timeframe: 3–5 trading days
R:R Ratio: ~2:1
Confidence: Moderate to High (subject to intraday volume confirmation)
For Education Purposes Only

Equity Trade Setup – Marico Ltd. (NSE: MARICO)Trade Type: Momentum Breakout (Short-Term)
🔹 Trade Details
Buy Zone (Entry): ₹734.75 – ₹735.75
Current LTP: ₹736.80
Stoploss (SL): ₹727.00 (below swing low & 20 EMA)
Target (T1): ₹766.00
Target % Left: ~3.93%
🔍 Technical Indicators
📈 EMA Crossover: 9 EMA > 21 EMA > 50 EMA (bullish alignment)
📊 RSI: Near 60–65, with upward momentum (bullish)
🔺 Volume Surge: Confirming breakout from consolidation zone
✅ Client Advisory Summary
BUY MARICO LTD at ₹734.75–735.75 for a short-term breakout move.
Target: ₹766.00
Stoploss: ₹727.00
Timeframe: 1–3 Days
R:R Ratio: ~3:1
Confidence: High (based on EMA alignment, RSI strength, and volume confirmation)
For Education Purposes Only

Equity Research Report – TVS Motor Company Ltd.📌 Timeframes Analyzed: 15-Minute and 1-Hour
📅 Date: May 5, 2025
📍 CMP: ₹2,774.40
📈 Setup: Bullish breakout from falling channel with EMA crossover
🔹 Technical Highlights
Pattern: Descending channel breakout (1H)
Moving Averages: Price is trading above the 20-EMA and 50-EMA with bullish crossover
Volume: Breakout confirmed by increasing volume
RSI (Momentum): RSI is trending up above 50 with positive divergence
🟢 Trade Plan – Intraday to Short-Term Swing
✅ Buy Levels (Confirmation Entry)
Buy Above: ₹2,780 (breakout confirmation level)
🎯 Targets
Timeframe Target 1 Target 2 Target 3
15-min ₹2,810 ₹2,835 ₹2,860
1-hour ₹2,850 ₹2,880 ₹2,920
🔻 Stop Loss
Intraday SL: ₹2,745 (below channel support and 50-EMA)
Swing SL: ₹2,720
