NTPC
NTPC Weekly/Daily/240 demand 88.25-84.5NTPC Weekly/Daily/240 demand 88.25-84.5
pro:
1. Origin of weekly move
2.Weely/daily/240 min co insiding
3. 2 excplodive candle in daily
4. straight drop to the zone, so bounce can be clean and faster
con:
1. 4 base so confirmation entry
2.2 Cluster of zone left , so weaker zone
ntpc will fall down or not i am a new trader pls some one confirm that my analysis is correct or not
1.its forming an wedge pattern and moving down words
2. it have taken a resistance at 108.15 and start to fall down
3.the wedge patter is supporting both day and week chart time frame
4. And RSI touched 80 over brought zone
NSE:NTPC
NTPC - Intraday Technical AnalysisHi Traders,
From the kind of support am getting from my recent publishes, am guessing u want more short term analysis. Or maybe you dont want this kind of technical analysis and its better to stop what am doing and concentrate more on my trading. So this might be the last post on Indian stocks.
We have a bullish bias on this stock because of the breakout we had last week.
It seems price would honor the trendline in hourly chart, and we have a key level at 102.70. So price can continue upwards after testing the trendline or the key level at 102.70. We suggest a buy entry only if you get price structure in the lower timeframe.
Since we have the weekly trendline passing through the golden zone, we expect the maximum drawdown can be till this level.
Hoping this was useful. For queries pls feel free to comment.
Happy Trading
NTPC - Complete Technical AnalysisHi Traders,
This stock will provide some buying opportunities in coming days.
As we breakdown the chart, the price has broken through the weekly inner trendline in confluence with the break of SMA 50. This is a good indication that price will test the outer trendline .
The weekly chart formed a double bottom pattern and broke above the neckline, that's another reason to buy this stock.
A thing of concern about this stock is that we have a golden zone between 109.50 - 118.00 level, where price can move in a range before testing the outer trendline .
We should expect some drawdown as price can retest the broken levels. we have strong support at the neckline of double bottom and at the inner trendline .
A break above 130.40 levels marks the end of a 2 year long downtrend, and we will have a bullish outlook on this stock for at least a year and half.
For this kind of complete technical analysis msg me the stocks that u would like to have complete technical analysis .
Pls Like and follow .
Happy Trading.....
NTPC ::: BREAKOUTDATE: 20 AUG 2020
INSTRUMENT: NTPC
INDICATORS: DAY
PSAR: BULLISH
STOCHASTICS: BULLISH
200 DMA: 101.60
INDICATORS: WEEK
PSAR: BULLISH
STOCHASTICS: BULLISH
INDICATORS: MONTH
PSAR: BULLISH
STOCHASTICS: BULLISH
CMP: 101.10
BUY: 102.60
TGT . 01: 106.68
TGT . 02: 111.76
RISK DISCLOSURE :
Technical analysis of FOREX and INDIAN MARKETS. We are not SEBI REGISTERED ANALYSTS The views expressed here are for our record purposes only. Please consult your personal financial advisor before investing. We are in no way responsible for your profits/losses what so ever.
NTPC Looking Bullish on Chart & Good For Long RunHello There,
Greetings Form Team UD Trade..
This is short evaluation on NTPC (Chart Idea) As per current chart analysis we can expect good up trend in comming days, if you are looking for investment for a month this will be the best option from you. also you can expect tarfet with the levels 100 (First Target Within 2 weeks) 113 (Target 2 Within month) and if you want to make more profit in this you can go with the same flow.. Due to market downtrend this script is now below average price point do not miss this opportunity.. if you don't want to invest just do paper trade and wait for one month from today and comment below after one month with the LTP.
Hope this analysis will help you to make good profit as a positional trade..
Thanks
Team UD Trade
MTPC Looking Bullish And Good For Long RunMy India Vodafone,
Hello There,
Greetings Form Team UD Trade..
This is short evaluation on NTPC (Chart Idea) As per current chart analysis we can expect good up trend in comming days, if you are looking for investment for a month this will be the best option from you. also you can expect tarfet with the levels 100 (First Target Within 2 weeks) 113 (Target 2 Within month) and if you want to make more profit in this you can go with the same flow.. Due to market downtrend this script is now below average price point do not miss this opportunity.. if you don't want to invest just do paper trade and wait for one month from today and comment below after one month with the LTP.
Hope this analysis will help you to make good profit as a positional trade..
Thanks
Team UD Trade
NTPC- Intraday Buy above 93.5NTPC- Intraday Buy ONLY above 93.25. Maybe carried fwd for a day, if required.
TGT: 95.25 - 96
SL: Below 92.25
Disclaimer: These are just my views, I am only SHARING my views - kindly do NOT trade blindly with these levels, please do your own research before entering/ or as per advice from your own financial adviser.
Had previously published intraday shorting for CONCOR, but later only realised that it was privately published.
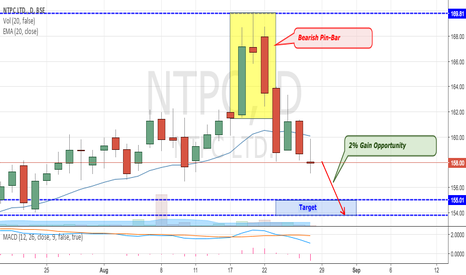
NTPC Confirmed Bearish Pin-Bar CandlesticksThe Pin Bar Candlesticks formation indicates change in trend. If it is found near important resistance level then it signals selling pressure and rejection of prices on high level as indicated the above chart.
Therefore, it is an important formation to measure market sentiments and as per above chart it indicates high selling pressure or profit taking signals short.


