+$413,000 profit on 918% move $1.15 to $11.71 $MLGOMultiple Buy Alerts 1st at $2.27 yesterday after hours with plan to hold overnight
Then 3 new Buy Alerts in $3 - $5 range today with $9 - $10 max target 🎯
Massive win on extremely strong buying all along
I repeatedly mentioned it in public chats as well especially during easiest swings $7.50 to $11.50 in minutes
NVDA

NVDA correction to $105-112 range- NVDA has completed it's motive wave 1-5 and currently is under corrective wave ABC.
- Within ABC leg, it's under the leg C where it will eventually find a bottom and then start fresh motive wave 1-5.
- Chart looks interesting and monitor carefully for the entry when it corrects!

Bullish Bat on APLD?Beyond the great trade setup here, I'll mention that APLD is NVDA's 2nd largest holdings on their books. Let's hope that NVDA earrnings report shows they haven't sold and maybe that'll help this little engine that could. What's your thoughts? Do you think that APLD and its market partic NASDAQ:APLD NASDAQ:APLD ipants are going to respect levels and let this Bat fly?

Is there a single soul out there who haven't profited on this?100 Million shares volume
Continuous buying on every dip
Multiple Buy Alerts sent out with explanation on why to buy and hold and which price to aim for into end of day
Is there a single soul out there on this planet who haven't made a profit on NASDAQ:JTAI today?
If you're the one you need help with trading! This one was way too easy, DM me asap to help you!

SMCI BONANZA HOW SUPERMICRO GOES BANANA-STANDING AGAINThe Great Banana Republic of Bananadom
🍌 In a world where sunshine dripped like honey and the very air smelled of sweet ripeness, lay the Great Banana Republic of Bananadom. Here, houses were carved from colossal banana peels, their smooth yellow surfaces gleaming. The roads? Paved with dried banana chips, providing a satisfying crunch with every step. The citizens, known as Bananadomites, were a cheerful bunch, their skin naturally tinted a warm yellow. They wore clothes woven from banana fiber, adorned with intricate patterns of banana leaves and blossoms.
🍌 Our protagonist was Bananabelle, a spirited Bananadomite with a crown of woven banana leaves atop her head. Bananabelle wasn't just any Bananadomite ; she was the Royal Banana Baker, famed throughout the republic for her innovative banana-based delicacies. From banana bread that sang sweet melodies when sliced to banana smoothies that granted temporary flight, her creations were legendary.
🍌 Life in Bananadom was idyllic, a continuous cycle of harvesting, baking, and celebrating the glorious banana. But one day, a shadow fell upon this sunny paradise. The Great Banana Tree, the source of all bananas in Bananadom, began to wither. Its leaves drooped, its fruit shriveled, and the air lost its sweet fragrance. Panic gripped the republic. Without the Great Banana Tree, Bananadom would cease to exist.
🍌 Bananabelle, known for her courage and ingenuity, stepped forward. She proposed a daring quest: to venture beyond Bananadom, into the uncharted lands rumored to exist beyond the seemingly endless banana plantations that surrounded their republic. Legend spoke of a mystical Banana Oasis, a hidden paradise where the first banana seed sprouted, and where the secret to eternal banana growth resided.
🍌 Gathering a team of brave Bananadomites– a strong banana farmer named Bananabert, a wise old banana leaf weaver named Nana, and a nimble banana monkey named Chip – Bananabelle set off. Their journey was fraught with peril. They navigated through jungles of giant banana slugs, crossed rivers of banana pudding, and outsmarted grumpy gorillas guarding banana hoards.
🍌 Along the way, Nana shared ancient Bananadomite lore, revealing that the Great Banana Tree's decline was linked to a growing apathy among the Bananadomites. They had become complacent, taking the banana’s bounty for granted and forgetting the importance of gratitude and respect for nature.
🍌 Finally, after weeks of travel, they reached the Banana Oasis. It was a sight to behold: a lush valley teeming with every variety of banana imaginable. At its heart stood a shimmering waterfall of banana nectar, nourishing a single, glowing banana seed.
🍌 As Bananabelle approached the seed, a voice echoed through the valley. It was the spirit of the Great Banana Tree, reminding her of the importance of cherishing their blessings. Bananabelle, humbled, vowed to reignite the spirit of gratitude and respect in Bananadomite. She carefully collected a vial of the banana nectar and, with a renewed sense of purpose, led her team back home.
🍌 Upon their return, Bananabelle poured the nectar onto the roots of the Great Banana Tree. Slowly, miraculously, the tree began to revive. Its leaves unfurled, its fruit plumped, and the air filled with its sweet fragrance once more. The Bananadomites rejoiced, their hearts filled with gratitude. Bananabelle's bravery and wisdom had saved their republic. From that day on, the people of Bananadom celebrated the Banana Oasis Quest, a reminder to always cherish the gifts of nature and the power of community. And Bananabelle? She continued to bake her legendary banana treats, each one a testament to the enduring spirit of the Great Banana Republic of Bananadomite.
🍌🍌🍌 What's a Banana-tastic adventure 🍌🍌🍌

$3.35 to $13.46 in 45 minutes during premarket, strong 300%Early bird gets the worm in premarket stock trading I guess. When they start moving like this during early morning it pays to wake up early and catch one of these because it could be more profit faster than during all regular trading hours during the day.

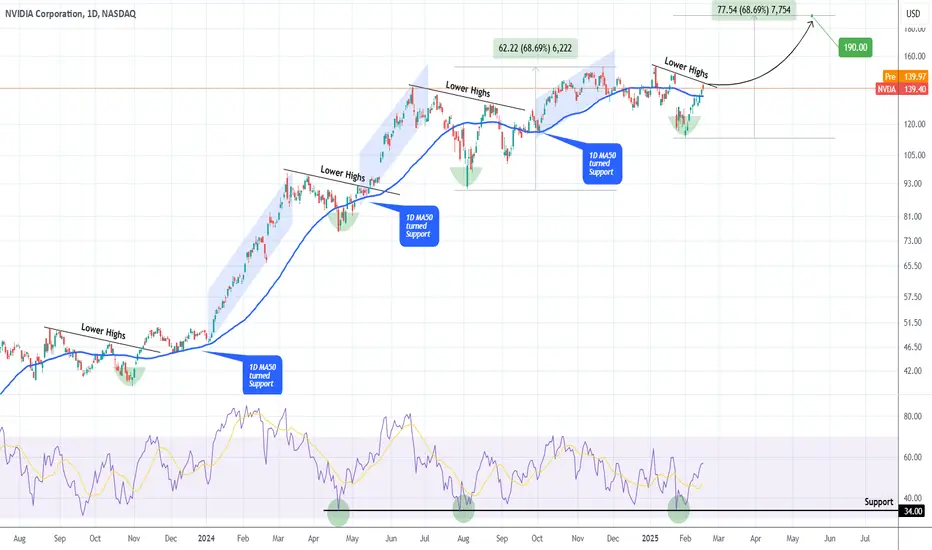
NVIDIA Rejected on the most important Resistance of all.Last time we looked at NVIDIA Corporation (NVDA) was just 20 days ago (January 29, see chart below) but we managed to get the exact bottom buy opportunity on the 1W MA50:
As the stock reacted with an immediate and relentless rally of 10 straight green 1D candles, it hit yesterday its first hurdle, the All Time High (ATH) Lower Highs trend-line and closed in red.
This Lower Highs trend-line is historically very important as every time a similar technical structure broke in the past 2 years, a strong rally followed. The early ones were stronger, which is natural to expect as the company was recovering from the 2022 Inflation Crisis and had enormous room to grow. On a side-note, the 1D RSI rebounded on its 34.00 Support, where the stock's last two bottoms were priced.
As a result, we believe that if NVIDIA breaks and closes above the current Lower Highs trend-line, it should at least repeat the last rally from its bottom (+68.69%), which translates to a $190 medium-term Target.
-------------------------------------------------------------------------------
** Please LIKE 👍, FOLLOW ✅, SHARE 🙌 and COMMENT ✍ if you enjoy this idea! Also share your ideas and charts in the comments section below! This is best way to keep it relevant, support us, keep the content here free and allow the idea to reach as many people as possible. **
-------------------------------------------------------------------------------
💸💸💸💸💸💸
👇 👇 👇 👇 👇 👇
NVDA - Back again, now down again?The pattern seems to repeat.
Again, we had a HAGOPIAN, which sais, that price goes back more than from where it came, and this rule was right.
Up in here, I'm not that confident anymore that price will reach the Centerline. But, it's not about what I think, or how confident I'm are. I just have to follow my Strategy and act according to the Rules, the trading framework of the Medianlines.
That said, we either shoot up on earnings, or we definitely tank down. For now, there is no trade, only a Gamble. I rarely gamble, so I'll sit on the sidelines and let it happen whatever will come out on earnings.
As for a Lotto-Ticket, I would buy some Puts and just have fun to watch how they get burned, or how I get a Christmas Moment in the beginning of the new year §8-)

$TSLA poised for an EASY rise to $400 and beyond.BUY NASDAQ:TSLA NOW
A falling wedge is a chart pattern suggesting a probable rise in a stock's price. This bullish pattern emerges during a downtrend, as the price range tightens and the trend lines converge.
RSI: 35.02 as of 02/10/2025
NASDAQ:TSLA 's price began 2025 at $403.84. As of today, it stands at $350.73, reflecting a -13% decrease since the start of the year. By the end of 2025, it's projected to reach $692 , a year-to-year increase of +71%. This marks a +97% rise from today’s price. Mid-2025 predictions place Tesla at $477 . In the first half of 2026, the price is expected to climb to $805, and by year-end, add another $163 to close at $968, which is +176% from the current price.
-Month Low $350.51
Low $350.51
Pivot Point 1st Support Point $346.59
Pivot Point 2nd Support Point $342.46
Price 1 Standard Deviation Support $334.84
Pivot Point 3rd Support Point $334.40
Thank you

$42 TARGET $RXRX BUY NOW!The triple bottom chart pattern usually emerges after an extended downtrend with bears dominating the market. While the first bottom might reflect regular price fluctuations, the second bottom signals that the bulls are gathering strength and gearing up for a potential reversal. The third bottom demonstrates robust support, suggesting that bears may surrender when the price surpasses resistance levels.
ALSO: Investing in Recursion Pharmaceuticals (RXRX) offers intriguing possibilities for several reasons:
Innovative Technology: NASDAQ:RXRX utilizes artificial intelligence (AI) and machine learning to expedite drug discovery. Their BioHive-2 supercomputer, powered by Nvidia AI chips, is among the most powerful accelerated computing systems globally.
Partnerships: NASDAQ:RXRX has formed alliances with major tech and healthcare leaders, including Nvidia ( NASDAQ:NVDA ), which invested $50 million into its operations. These collaborations aim to streamline drug discovery, making it faster and more cost-effective.
Promising Pipeline: NASDAQ:RXRX boasts a strong lineup of drug candidates, and their technology has already shown promising results. Their merger with Exscientia, another biotech company focused on AI-driven drug discovery, has created a more robust, vertically integrated platform.
Potential for High Returns: While investing in NASDAQ:RXRX involves risks, it also holds the potential for significant returns. The company's innovative approach could transform the healthcare industry, making it a potential "10-bagger" (a stock that increases tenfold in value).
Long-term Vision: RXRX seeks to shorten the drug discovery process from years to months and significantly reduce costs. This long-term vision could lead to substantial growth if successful.

NVIDIA & xAI’s Grok 3: A Game-Changer or Overhyped AI Play?NVIDIA’s stock ( NASDAQ:NVDA ) has been on an unstoppable rally, driven by the AI boom. Now, with Elon Musk’s xAI set to launch Grok 3 —trained on an impressive 100,000 NVIDIA H100 GPUs —the market is buzzing with speculation. Could this be the catalyst that propels NVDA to the next level, or are we approaching an AI-driven valuation bubble?
Key Developments :
Massive GPU Demand : xAI’s Grok 3 will utilize a staggering 100,000 H100 GPUs, reinforcing NVIDIA’s dominance in AI hardware and boosting its market position.
Supercomputer Expansion : Musk’s team is building one of the most powerful AI training clusters in Memphis, Tennessee. This development could significantly increase NVIDIA’s long-term revenue streams, given its key role in powering these systems.
Release Date : Grok 3 is set to launch today, February 17, 2025(4 AM GMT) , with a live demonstration, which may influence sentiment around AI-related stocks, especially NVIDIA.
Market Sentiment & Risks : While these developments seem bullish for NVIDIA, some analysts, including hedge funds like Elliott Investment Management, have raised concerns over the potential for overvaluation as the AI euphoria spreads.
Conclusion: Grok 3’s launch will be a pivotal moment, with NVIDIA at the heart of the AI revolution. Whether this sparks a fresh rally or raises concerns about an AI bubble remains to be seen.
------------------------------------------------------------------------------
Now, let's use Technical Analysis to analyze NVIDIA stock(NVDA) .
In terms of technical analysis, the loss of an Ascending Channel is not good news for any asset and is a sign of weakness in the upward trend . This has happened to the NVIDIA stock(NVDA) .
From the point of view of Classical Technical Analysis , it seems that NVIDIA stock is completing the Rising Wedge Pattern .
Educational tip : The Rising Wedge Pattern is a bearish reversal or continuation pattern characterized by converging upward-sloping trendlines. It signals weakening bullish momentum, often leading to a breakdown below support. A confirmed breakout to the downside indicates a potential price decline.
I expect the launch of Grok 3 Artificial Intelligence(AI) can increase at least +10%+15% of NVIDIA stock(NVDA) . If the upper line of the Rising Wedge Pattern breaks , we can expect a further increase [ the next target can be Yearly Resistance(1=$175.68)(in case of breaking) ].
What’s your take? Drop your thoughts about NVIDIA in the comments! 👇
Be sure to follow the updated ideas.
NVIDIA Analyze (NVDAUSD), Daily time frame.
Do not forget to put Stop loss for your positions (For every position you want to open).
Please follow your strategy; this is just my idea, and I will gladly see your ideas in this post.
Please do not forget the ✅' like '✅ button 🙏😊 & Share it with your friends; thanks, and Trade safe.

Nasdaq and Next Major SupportThe Nasdaq Composite is about to break above what will be it's next major support. When this happens stocks usually fly quite high. Please remember that it will likely want to hit back into this support at some point. So when you get big gains after this happens, do not enter new positions, just ride them. You also might want to trim some off and wait for the pullback into support before adding new positions.
As always, good luck!

My BY Entries for NVIDIAHere are my 2 buy entries for NVIDIA.
Please study my chart and see my reasons.
Entry 1: buy at the current price of $123.5.
Entry 2: wait to retrace back to $120
SL for the two entries: $114.8
TP1 and TP2 : $150
Trade with care

NVDA $141 touchAs per usual beautiful prediction to the gap filler on NVDA. loser to the 141 filler and possible third lower high. Would definitely capitalize on that $3 dollar difference and get out until I see a down movement to retest trendline support or I see a retest to the upside.
It is uncertain now. Wha is not uncertain is we will get that GAP closed.

Nvidia = 4T Market CapNASDAQ:NVDA : Largest Market Cap in the World?!
4 Trillion Market Cap Inbound 🎯
Ever since Nvidia flipped to green on the H5 indicator we have come back to retest it 5 times. In which we bounced and then rallied hard!
Support created and NASDAQ:NVDA is breaking out!
Not financial advice

New highs area +$1,000/share unlocked for NasdaqSeems like 2 months of sideways downtrending (since mid December) is over for Nasdaq.
Unless any surprise political shock news come out (we all know that can be a challenge with Trump) we could see Nasdaq reach $23,000 per share area in drawn upcoming green period.
This would also reflect directly on upward momentum for several bluechip stocks:
Apple Inc. NASDAQ:AAPL
Microsoft Corporation NASDAQ:MSFT
Amazon.com Inc. NASDAQ:AMZN
Alphabet Inc. NASDAQ:GOOGL
Meta Platforms Inc. NASDAQ:META
NVIDIA Corporation NASDAQ:NVDA
Tesla Inc. NASDAQ:TSLA
Intel Corporation NASDAQ:INTC

Nvidia $SERV'd this one! Massive move still on the table!NASDAQ:SERV
NASDAQ:NVDA selling out of this one crushed this name but...
- The CupnHandle is still intact IF this is indeed bottom.
- Volume Shelf and S/R Zone here
- Right at smoothing line which has historically held pretty well.
Only time will tell but if we come back up and break out of this CupnHandle at $24.32 we are going to...
🎯 $42
Not financial advice

Stock Market Forecast | TSLA NVDA AAPL AMZN META GOOGL MSFTStock Market Analysis | SPY QQQ, NQ ES
Mag 7 Analysis | TSLA NVDA AAPL AMZN META GOOGL MSFT

Still long $NVDAThe NASDAQ:NVDA Blackwell architecture is a game-changer, powering next-gen AI chips that giants like NASDAQ:MSFT and NASDAQ:META are scrambling to acquire. The upcoming RTX 50 series (including the RTX 5090) will bring AI-powered capabilities to gamers and creators in 2025. While some analysts project an average price target of 17.86, we're taking more cautious short-term view with a 140 target, following the stock's recent 12% dip.

NVIDIA Bullish Setup!NVIDIA Bullish Setup! 💚
NVIDIA remains in a strong uptrend, respecting its trendline support and showing bullish momentum leading into its earnings report on Feb 26. With buyers stepping in at key levels, a push towards the $150 target looks likely in the short term!
🔹 Current Price: $137
💡 Why bullish?
🔹 Strong long-term uptrend 📈
🔹 Buyers defending higher lows 💪
🔹 Anticipation of earnings momentum 🔥
🎯 My personal target: $150

$INTC Nice Long Base – Ready to Breakout?NASDAQ:INTC oh how the mighty fall from grace. But so much for nostalgia. INTC has been basing since August 2024 for over 6 months. It looks like it has support around $19. It has tried to get moving a few times but no go.
Today it has tested both the longer term and shorter-term downtrend lines (DTL). It is testing today on the news that JD VANCE said AI will be built in the US. I have tried this name before and have been stopped out for a small loss. I have an alert set on the long term DTL. Should that trigger, I will want a convincing close above it. Looks to me, risk is well defined with a stop under $19. At current price that is about an 11% Stop Loss. Too much for me, so I would go to a lower timeframe to see if there is a better Risk Reward stop. All TBD.
I am only posting this because I like the longer base and thought you might want it on your watchlist as well.
This is my idea, if you like it, make it your own to fit “your” trading plan.

Arista Into EarningsANET is still suffering from the NVDA sell off (I would argue completely irrational panic). It's currently ranging right in the middle of major support and major resistance. So it's tricky because we're so far above support, but also lots of room to recover losses. My bet into earnings is Arista breaks above resistance at $141. Arista is trading just under 20X revenue and they have amazing profit margins and sustained growth. The broader Nasdaq Computer Index IXCO is very close to breaking out of this long range it's been so it seems like a fair bet that ANET jumps to the upside along with everything else.
Good Luck!

NVDA LONG WIZARD PREMIUM IDEA 100% SURE
My idea has proven to be 100% successful: the short trade resulted in a precise profit, and the long trade on Nvidia was executed flawlessly, based on the surgical support line I had drawn—despite all the initial criticism. Now, the stock has bounced exactly where I predicted, and the long position is already up 25%. Now, we go in strong!
