$NVDA $TSLA $META $AMZN – Triangle Squeeze Incoming?📊 Symmetrical triangle formations are building across these tech giants — and volatility is compressing.
🔍 What to watch:
📈 Breakout above upper trendline = bullish momentum
📉 Breakdown below lower trendline = bearish confirmation
📉 RSI on NASDAQ:NVDA is at 73.04 = overbought warning
⚠️ NASDAQ:NVDA earnings drop May 28, could be a trigger for resolution
These coils don’t last forever. Price is building pressure — and one strong candle could break the dam.
Stay sharp, and tighten your stops.
This is where risk management matters most.
👇 Which side are you betting on — breakout or breakdown?
NVDA

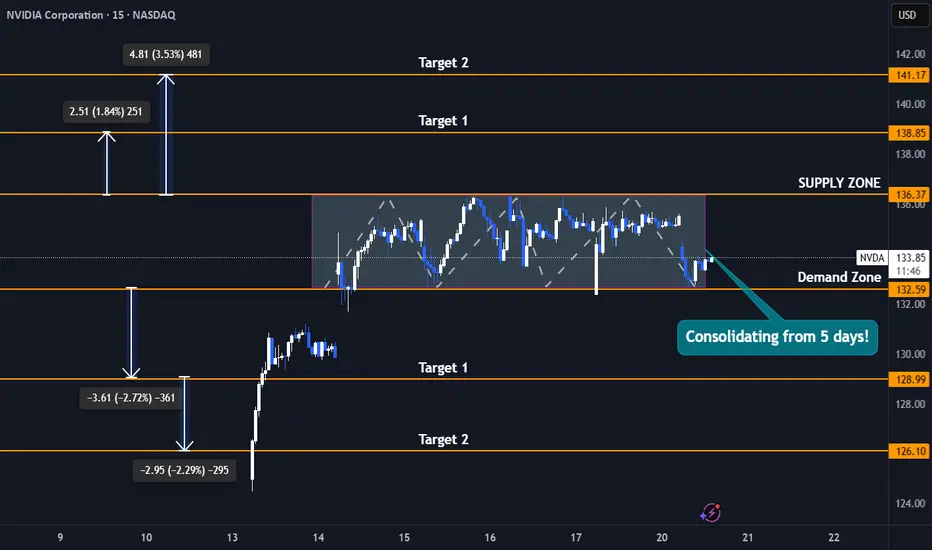
Nvidia Stock 5-Day Consolidation Breakout - Uptrend or Pullback?Trade Duration: Intraday
Trade Type: Breakout
- Nvidia is currently consolidating tightly between $132 and $136, forming a narrow range that reflects a balance between buyers and sellers unwilling to relinquish control. This range-bound action signals indecision, but it won’t last indefinitely.
- Typically, the longer the consolidation, the more significant the subsequent move. As new participants enter the market, a breakout—whether upward or downward—can trigger a powerful surge.
- This move is often amplified by breakout buyers joining in and stop-loss orders of trapped traders being triggered, creating an ideal setup for an intraday breakout trade.
- I plan to initiate either a buy or sell position depending on the breakout direction, capitalizing on the momentum generated by this tight consolidation phase.
Upside Targets : 138$ and 141$
Downside Targets : 128$ and 126$
DOUBLED MONEY in 3 days! $6/share win for $0.50/share stop loss!🔥 +100% in 3 days ✅ $6 to $12 Swing Pick buy on Friday before market close at $6 NASDAQ:ASST
Just 3 days later it's $12 for a mega win!
And to make that much better the risk was only $0.50 per share while going for $6/share win so 1:12 risk/reward ratio

$NVTS is up 125%, but they might not be done yet!NASDAQ:NVTS Could see more upside if...
We close the week above $4.66 Double Bottom Breakout. This would lead us to the following targets...
🎯$6📏$7.76
- Bullish cross on H5_L indicator
- Volume shelf launch with GAP
- NASDAQ:NVDA Partnership
- Small Cap
- High Short Float

SHORT | NVDANASDAQ:NVDA
Key Observations:
Current Price Action:
Price: $131.80
Recent Drop: -2.58 (-1.92%)
Support and Resistance Levels:
Immediate Resistance: $134.70 to $138.83
This red zone represents a strong supply area where the price has historically faced selling pressure.
Immediate Support: $122.74 (Target Price 1)
Further Supports:
Target Price 2: $116.65 (Aligned with 0.5 Fibonacci Retracement)
Target Price 3: $108.38 (Previous structural low)
Trendlines:
Red Uptrend Line: Recently broken, indicating weakening bullish momentum.
Green Downtrend Line: Long-term resistance trendline from the previous Lower Highs (LH) is still intact and respected.
The break below the minor trendline suggests a corrective wave (4) might be in motion.
Fibonacci Levels:
0.382 Fib Retracement: $121.22
0.5 Fib Retracement: $116.22
These levels align with potential targets in a wave (4) corrective phase according to Elliott Wave theory.
Target Prices:
Target Price 1: $122.74
This is the closest demand zone and aligns with the 0.382 retracement—high-probability support.
Target Price 2: $116.65
Aligned with the 0.5 Fibonacci level and previous consolidation.
Target Price 3: $108.38
A major structural support and potential wave (4) bottom if market turns sharply bearish.
Summary:
NVIDIA Corporation (NVDA) is showing early signs of a corrective phase after failing to break through strong resistance in the $134–$138 range. The price rejected the resistance zone and is likely entering wave (4) correction. Key support levels to monitor are $122.74, $116.65, and $108.38, corresponding with Fibonacci retracement levels and historical price structure. A break below the short-term trendline increases the probability of a continued pullback before potentially resuming the uptrend in wave (5).

100% move potential Quantum Computing RGTIRegetti Computing Inc. (RGTI) - Quantum Computing is on the move - Breaking above the 25 day EMA to continue the uptrend. RGTI has the potential to move 100% of the current price. With that potential, when would you sell at 25% , 50%, 75% or 100%? Otherwise, would you hold longterm?

NVDA Still a Monster, But I’m Not Chasing It Just YetNVIDIA is sitting around $135.57 right now, and yeah—fundamentally, it’s crushing it. Revenue growth is off the charts (over 114% YoY) and the data center segment alone pulled in $35B+ last quarter. AI is the fuel, and NVDA is the engine.
That said… we’re getting into overheated territory.
Technically, price is way above its 50/100/200 EMAs, and the RSI is up in the 70s, so we’re clearly in overbought land. Can it push higher? Sure. But I’m not a fan of chasing candles when the chart is screaming “cooldown incoming.”
If we get any weakness or macro jitters (tariffs, earnings nerves, etc.), I’ll be watching for potential entries in the $125–98zone. If we drop into that range with strong volume reaction, I’ll start scaling in.
On the geopolitical front: yeah, the FWB:15B impact from U.S.–China restrictions isn’t nothing—but NVDA’s already moving to offset that with partnerships (like the Saudi AI deal). This isn’t a company sitting still.
📌 Bottom Line:
Long-term, I’m bullish. Short-term, I’m cautious. I’d rather miss a little upside than buy the top and get trapped in a pullback. Let the trade come to you.
Disclaimer: This isn’t financial advice—just sharing my own playbook. Always do your own research and manage risk accordingly.

NVIDIA The 1W MA100 rebound is targeting $225 at least.NVIDIA Corporation (NVDA) broke last week above its 1W MA50 (blue trend-line) for the first time in 2.5 months and all this is generated by April's bottom rebound on the 1W MA100 (green trend-line).
The 1W MA100 has been intact since January 23 2023, so this rebound technically initiates a new Bullish Leg. Since the December 2018 bottom (previous U.S. - China Trade War), the minimum rise on such a Bullish Leg has been +156.11%. As a result, NVIDIA can now target $225 at least before the end of 2025.
-------------------------------------------------------------------------------
** Please LIKE 👍, FOLLOW ✅, SHARE 🙌 and COMMENT ✍ if you enjoy this idea! Also share your ideas and charts in the comments section below! This is best way to keep it relevant, support us, keep the content here free and allow the idea to reach as many people as possible. **
-------------------------------------------------------------------------------
💸💸💸💸💸💸
👇 👇 👇 👇 👇 👇

Vanguard Mega Cap Growth ETF (MGK): FAQ guide before investing🚀 Vanguard Mega Cap Growth ETF (MGK): A Deep Dive into Holdings and Hypothetical Returns
🌟 The Vanguard Mega Cap Growth ETF (MGK) is a popular exchange-traded fund offering investors access to some of the largest and most dynamic growth-oriented companies in the U.S. market. MGK closely tracks the CRSP US Mega Cap Growth Index, emphasizing mega-cap stocks.
🎯 Key Features of MGK
💰 Expense Ratio: 0.07%, a cost-effective choice for investors.
📊 Assets Under Management: Around $25.42 billion.
💵 Dividend Yield: 0.44%, distributed quarterly.
🏆 Top Holdings:
🍎 Apple Inc. (AAPL): 14.34%
🖥️ Microsoft Corp. (MSFT): 11.93%
🎮 NVIDIA Corp. (NVDA): 10.70%
📦 Amazon.com Inc. (AMZN): 7.63%
📱 Meta Platforms Inc. (META): 4.33%
🔌 Broadcom Inc. (AVGO): 3.54%
🚗 Tesla Inc. (TSLA): 3.22%
💊 Eli Lilly and Co. (LLY): 3.20%
💳 Visa Inc. (V): 2.76%
🔍 Alphabet Inc. (GOOGL): 2.31%
📌 Sector Allocation:
💻 Technology: ~52.8%
🛒 Consumer Discretionary: 15.9%
📡 Communication Services: 11.0%
📈 Performance Overview
MGK has consistently demonstrated strong returns:
🗓️ Year-to-Date (YTD): 0.96%
📅 1-Year Return: ~21.09%
📆 3-Year Return: ~23.26%
📊 5-Year Return: ~19.26%
💸 Hypothetical Investment Scenarios
Assuming an average annual return of 19.26%, here's how various investments might grow over five years:
💲 $10,000 Investment:
Year 1: $11,926
Year 2: $14,219
Year 3: $16,951
Year 4: $20,207
Year 5: $24,070
💲 $100,000 Investment:
Year 1: $119,260
Year 2: $142,190
Year 3: $169,510
Year 4: $202,070
Year 5: $240,700
💲 $1,000,000 Investment:
Year 1: $1,192,600
Year 2: $1,421,900
Year 3: $1,695,100
Year 4: $2,020,700
Year 5: $2,407,000
⚠️ Note: These returns are hypothetical and assume consistent annual performance, which may not reflect actual market volatility.
🔑 Considerations for Investors
🎯 Concentration Risk: MGK heavily invests in technology and a few major stocks, tying its success closely to these specific companies.
📉 Market Volatility: Although historically strong, MGK can be highly volatile, particularly during tech-sector downturns.
📈 Long-Term Growth: Ideal for investors seeking significant long-term capital appreciation through prominent U.S. growth firms.
📌 In Summary: MGK provides focused exposure to U.S. mega-cap growth stocks with a strong track record. Investors should consider portfolio diversification carefully due to its sector concentration.

$SPY Daily Chart Taz Plan - May 2025 into June-July Breakdown📉 SPY Daily Chart Trading Plan — May 2025
Thesis:
Price has returned to the exact level ($594.20) where the February impulse breakdown began. This zone is acting as a Lower High rejection within a broader bearish structure. A clean rejection here opens the door to multiple inefficiency fills below.
🔍 Structure Breakdown:
Feb High (ATH): $613.23
Feb Open: $592.67
Feb Close (last green candle before impulse): $594.20
Current Price: $594.20
Marked LH: $592.50
This is a rally back into rejection, not strength.
📉 Key Zones & Gaps:
🔺 Gap Supply: $566.48 – $578.50
🔺 Wick Gap: $558 – $566 → Needs a full-body candle to initiate fill
🟥 FVG (4/22): $528 – $541.52
🧱 Major Support: $481.80
🧠 Trade Plan:
Short Entry 1 (Confirmation-Based):
🔻 Red candle rejection under $592.50 = starter short
🔻 Watch RSI and MACD for momentum fade
Short Entry 2 (Gap Breach):
🔻 If $578 is broken and retested → scale in
🔻 Gap fill expected quickly once triggered
Short Entry 3 (Wick Gap):
🔻 Body close through $558 = last add
🔻 Sets up for final flush to FVG
🎯 Targets:
$578.50 → $566.48 (Gap Fill)
$558 → $541.52 (Wick Gap & FVG Top)
$528 – $530 (FVG Close)
$481.80 (Long-Term Panic Target)
❌ Invalidation:
Daily close > $595.50 = Pause thesis
Weekly close > $600 = Structural shift, short squeeze zone
🧠 Final Thoughts:
This isn’t just a gap fill play — it’s a structural fade from a lower high back into memory. The Feb impulse wave left behind layers of inefficiency, and price just tapped the origin of the breakdown.
Momentum is peaking. If this is a trap, the downside should begin immediately.
Let the chart prove it.

$MSTR Monthly Top Form: “Backwards 4” + Multi-TF RSI DivergenceBefore we begin... trading view is restricting my post for an indicator.. maybe someone reported it... not sure... doesn't seem like a problem... it's a TD Sequential ...
🔍 The Setup — Monthly “Backwards 4” Pattern + Multi-Timeframe Breakdown
We’re now forming the 5th candle in what I call the “Backwards 4” formation, or the upside-down lowercase ‘h’ — a recurring reversal structure I’ve tracked at macro tops.
Structure breakdown:
✅ Strong monthly green candle
2–3. 🔻 Two red candles that retrace the body but don’t break it
✅ A second green candle that re-tests the highs and baits breakout buyers
❌ Final candle closes red → confirms exhaustion → multi-month drawdown begins
We saw this exact setup in early 2021 before MSTR collapsed from $1,000+ to $134. The pattern is now repeating — but this time it’s backed by RSI + MACD divergences on all major timeframes.
📊 Multi-Timeframe Technical Breakdown
📆 Monthly
Inside the “Backwards 4” zone now (candle 5)
RSI Bear Divergence: price made new highs but RSI keeps printing lower highs
MACD flattening after extended expansion
Volume fading for 3 months straight
📌 Momentum is dying while price floats. That’s not strength — that’s late-cycle distribution.
📆 Weekly
TD9 printed this week at the top of a tight 5-month box
RSI rejected at 63.61 — exact same rejection level as last cycle highs
MACD histogram curling while price stayed flat
Range: ~$338–$430 → energy has been spent
📌 This isn’t breakout behavior — it’s a liquidity trap.
📆 Daily
Double top attempt failed at $406
MACD crossed bearish, histogram turning red
RSI Bear Divergence Confirmed:
Price made higher highs from April to May
RSI made lower highs, tagging 66.90 vs. 74.70 earlier this year
📌 Daily has now logged 3 bearish RSI divergence peaks since February.
📋 Trading Plan (as of May 17, 2025)
Position: No current short — stalking ideal entry
Entry Zone: $406–$410 rejection zone (upper box resistance)
Trigger: Daily close under $390 confirms failed breakout
Add Confirmation: Weekly close under $375 = trend shift
Stop: Above $430 monthly high (invalidates breakout fade)
Target 1: $320–$290 (May red close zone)
Target 2: $262 (range midpoint / fib retrace)
Target 3: $240 (prior base support)
Stretch Targets: $175 and $102 if macro breaks down
Waiting for clean structure breakdown before initiating core position. This is a setup worth being early but precise on.
🧠 Final Thoughts:
This is one of my highest conviction macro top setups.
The “Backwards 4” is showing up again with RSI and MACD fading across the board. Price is floating under resistance on weakening momentum, and volume confirms it.
If May closes red, we likely begin a multi-month correction.
I’m watching for the breakdown trigger under $390 to begin building short exposure, targeting sub-$300 by month-end and lower into summer if momentum continues to unwind.
📉📦 Let’s see how it finishes.

Nvidia —Resistance Turns Support Support Confirmed—ATH 260-194This week closes as a full green candle. A rising window or gap was left along the way. This is a bullish development.
The full green candle comes after a rounded bottom and double-bottom long-term. Coming from a resistance level turned strong long-term support.
Keeping it simple, NVDA has been rising and the chart shows potential for additional growth. There can be retraces and corrections; Any retraces and corrections are an opportunity to buy-up, rebuy and reload.
In the case of a strong correction, always, we will end up with a higher low compared to the 7-April weekly session. This session marks the bottom of the correction.
A higher low means the bullish structure remains intact. A bullish structure means a bullish trend. A bullish trend means rising prices which will end up with a new All-Time High in late 2025.
Two new All-Time Highs possible and highly probable in 2025. 194 (mid-term) & 260 (long-term).
Thank you for reading.
Support boost and follow.
Namaste.

Stock Market Forecast | TSLA NVDA AAPL AMZN META MSFTStock Market Forecast | CME_MINI:NQ1! NASDAQ:QQQ AMEX:SPY CME_MINI:ES1!
Mag 7 Forecast | TSLA NVDA AAPL AMZN META MSFT GOOGL

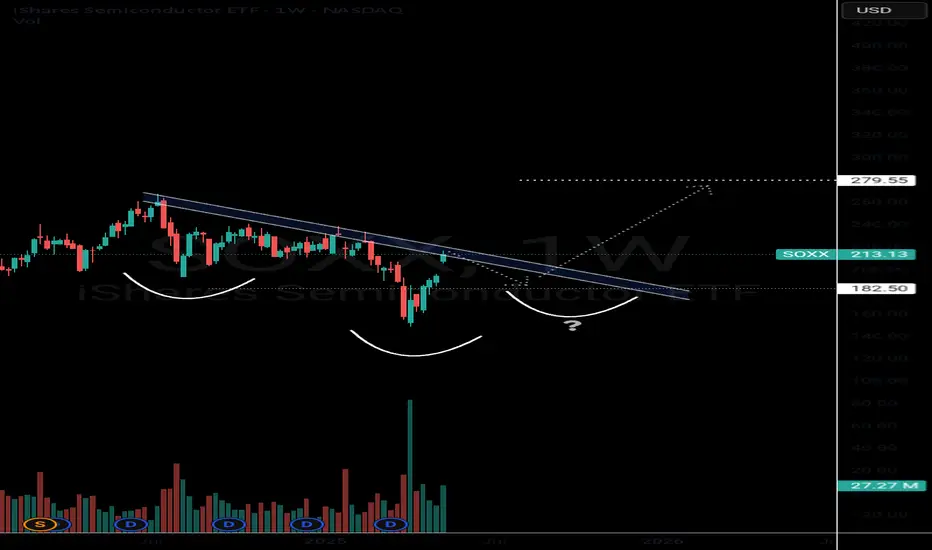
Bullish Semiconductors? SOXX The semiconductors NASDAQ:SOXX definitely tend to lead the market In bull rallies. I still think this saying will hold true for several years.
The NASDAQ:SOXX is flirting with some pretty decent resistance. This would be a perfect spot for sellers to exit and price action to digest recent gains.
If the chart plays out like I think it will, we should have a decent pullback in this area which could create an epic inverse head right shoulder. This pattern would be a very bullish setup that could take us into new All Time Highs in 2026.
This is a weekly pattern so allow the chart some tike to play out.
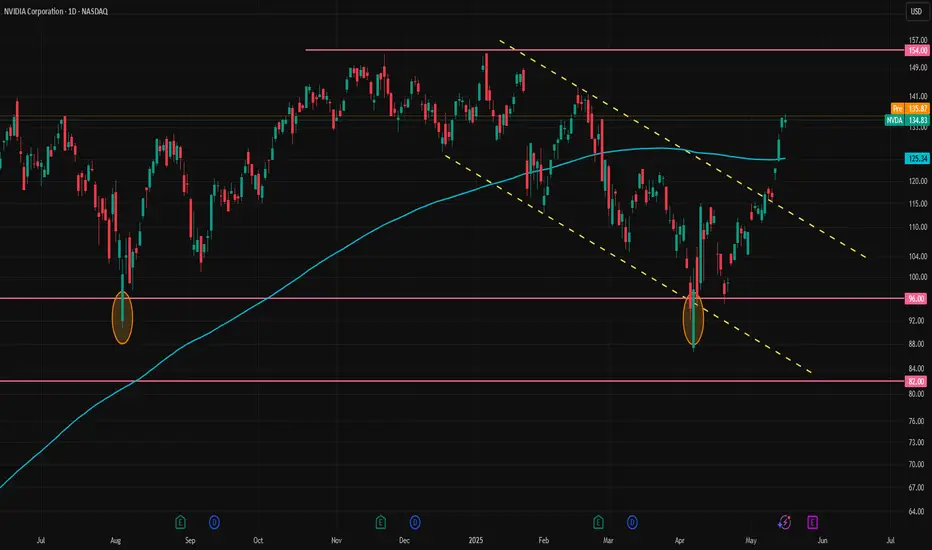
Possible Targets for Nvidia on Both Upside and DownsideNvidia has surged more than 55% since the early April dip and over 40% from the second dip, as expected in our earlier post. This massive rally was supported by a softening in trade policy (Bloomberg trade uncertainty index fell to 7.67 from 16.27), Nvidia's valuation being well below historical averages, and momentum sparked by Trump’s Middle East business trip.
Despite the surge, Nvidia still trades below its historical average based on forward price-to-earnings ratios. The stock has averaged a forward P/E of 32.2x over the past year, 34.2x over the last two years, and 40.2x over the past five years. Its current forward P/E stands at 28.4x. If Nvidia were to return to these averages, the implied price would be:
1-year average (32.2x): $153.04
2-year average (34.2x): $162.20
5-year average (40.2x): $190.79
However, relying on the 5-year average may not be ideal, as Nvidia’s explosive growth potential is no longer at the same trajectory it was five years ago. The 1-year average at $153.04 could be a more realistic near-term target.
Around the 1-year p/e price target, Nvidia has also a notable technical resistance. The stock has an infamous double top at $154 that has capped price advances twice before in November and January. This suggests that a short-term bet on further upside could be risky.
If Nvidia pulls back to around 120 level, however, it may offer a good buying opportunity, with upside potential toward 150 or higher, depending on the broader macroeconomic conditions at the time.
Please also check our earlier post:
$QQQ Over $523.5 for a retest of Highs. Lower High Setup?As you can see on the notes in the chart, several 5 counts lead to sell offs in the last Quarter. Will this trend continue or will we run it to a 9 Count again? 3 Days left. Watch these levels as I have a possible selloff to May open Price. This would effectively follow my 10D chart forecast of new lows in the next 30-40 trading days, if not 20 for significant damage either way. I will continue to update as we go.

NVDIA Don't Miss Out
Overview:
NASDAQ:NVDA is showing strong bullish momentum on the 2-hour chart, trading at $132.34 as of the latest candlestick. After a recovery from the March low of $88, the price is now testing a key resistance at $132.47. A breakout above this level could signal a continuation toward higher targets, supported by positive market sentiment and technical indicators.
Key Levels to Watch:
Resistance: $135.47
Next Target: $139.50 (psychological level and prior resistance)
Support: $116.24 (recent low, key support)
Trade Setup:
Direction: Buy on breakout
Entry: $133.50 (confirmation above resistance)
Profit Target: $139.50
Stop Loss: $125.00 (below recent pullback and 50-period MA)
Risk-Reward Ratio: 2:1 (Risk: $2.50, Reward: $5.00)
Follow for the Best Free AI Signals on the market
Ash.

Nvidia Overtakes Apple as 2nd-Biggest Company. Microsoft Next?Well, well, well — if it isn’t the GPU-maker-turned-global-tech-Goliath lapping the iPhone factory on the market cap leaderboard . Again.
Nvidia NASDAQ:NVDA has officially snatched the second-largest company title from Apple NASDAQ:AAPL , bringing its market cap north of $3.3 trillion, while Apple sat there like a vintage iPod on shuffle at $3.17 trillion — playing the same valuation tune for days.
So, what’s powering this meteoric rise? It’s not just graphics cards for gamers — that’s 2015. And it’s not graphics cards for Big Tech — that’s 2024. It’s graphics cards paid for by Middle Eastern oil money.
😎 Saudi Chips: Not the Potato Kind
Here’s the scoop: Saudi Arabia and the UAE are ready to shell out billions to become AI superpowers. And who’s their go-to guy? Nvidia, of course.
CEO Jensen Huang, who was in Riyadh this week, announced that Nvidia will supply “several hundred thousand” of its most advanced processors to Humain, a state-backed Saudi firm tasked with building AI infrastructure across the desert kingdom. That includes 18,000 units of Nvidia’s cutting-edge GB300 Grace Blackwell chips — the stuff data scientists dream about.
Nvidia calls this initiative “sovereign AI” — governments building and running their own AI on national infrastructure. Think of it as building data sandcastles, except the sand is made of petrodollars and server farms.
The geopolitical context? President Trump’s Middle East tour is clearing regulatory roadblocks, scrapping AI export restrictions drawn up under Biden, and opening the region to top-shelf American tech.
And Wall Street is paying attention.
💪 Trump Dumps Diffusion Rule, Nvidia Pumps
One of the major tailwinds for Nvidia’s latest rally came in the form of a policy reversal. The Biden-era “AI Diffusion Rule,” which aimed to restrict exports of advanced chips, has now been tossed by the Trump administration.
According to the Bureau of Industry & Security, the rule would have “undermined US innovation” and strained diplomatic relations. Translation? Nvidia was about to have its international wings clipped — but now it's free to fly across the Persian Gulf with pallets of GB300s.
The rule reversal instantly boosts Nvidia’s global reach — and opens the floodgates for billions in international chip demand. Naturally, the stock responded positively, climbing 5.4% on Monday, 5.6% on Tuesday, and 4.1% on Wednesday.
🚂 Not Just a Hype Train (But Bring Snacks Anyway)
Nvidia’s rally isn’t just FOMO (but there is some froth every now and then ).
It’s backed by earnings, expansion, and actual demand. Every major AI player — from startups to sovereign nations — needs Nvidia chips. And there’s no clear rival. AMD NASDAQ:AMD is a step behind. Intel NASDAQ:INTC is still trying to remember how to make people excited again.
But at these levels, expectations are sky-high. Even a great quarter that’s not utterly perfect could trigger some profit-taking. After all, trees don’t grow to the sky — but apparently semiconductors are expected to .
👀 Eyes on Microsoft, But Timing Is Key
So what’s next? Can Nvidia dethrone Microsoft NASDAQ:MSFT , currently valued at just about $60 billion more, and become the biggest company in the world?
Easily, especially if Huang’s tech juggernaut keeps this pace and posts another monster earnings beat. Nvidia reports on May 28, and you can bet every institutional desk, Reddit thread, and our very own TradingView community will be glued to their multi-screen setups to get those numbers.
Microsoft still sits at the top with a $3.36 trillion valuation — within striking distance. All it would take is another ~1.8% pop for Nvidia and a sleepy session for Microsoft.
But be warned: Wall Street loves a Cinderella story until the glass slipper misses earnings by two cents.
🧐 Final Thoughts: Watch Out Everyone
Apple may have Siri. But Nvidia has the chips to build a thousand Siris — and a few Skynets while we're at it.
Whether it can overtake Microsoft depends on the next earnings report (or the lead-up hype).
So the question isn’t “Will Nvidia stay #2?” It’s: How long until it’s #1 — and what could possibly stop it?
And if you’ve got it on your watchlist, circle May 28 in red marker and don’t forget to pay attention to the earnings calendar .
Because that earnings print might just rewrite the leaderboard again.
Your move : Are you riding NASDAQ:NVDA to the top? Waiting for a pullback? Or nervously watching from the sidelines with popcorn and regret? Hit the comments with your play.

Magnificent Seven: Still Magnificent? Or Diverging for Good?The Nasdaq 100 has bounced, but under the surface, the “Magnificent Seven” are no longer marching in sync.
And this divergence matters, especially if you’re trading QQQ or using it as a momentum proxy.
⚔️ Leadership Rotation in Real Time
- Nvidia (NVDA): Still a beast. Making fresh highs, clear institutional momentum.
- Microsoft (MSFT): Quiet strength — not flashy, but technically clean.
- Meta, Amazon: Holding up, consolidating after major runs.
- Apple (AAPL) and Tesla (TSLA): Weak links. AAPL can't find a bid. TSLA is stuck below major resistance.
Trading QQQ directly?
Consider weighting your thesis by what’s working under the hood.
- QQQ reclaimed the 200-day MA with the May 12's gap echoing the broader S&P move.
- Look for a retest of the resistance and the previous high of 540
- Play breakouts with confirmation, or mean-reverting pullbacks.
🧠 Final Take
The Magnificent Seven are splitting into two camps: those still driving the rally, and those dragging it.

Nvidia (NVDA) Share Price Jumps Over 5%Nvidia (NVDA) Share Price Jumps Over 5%
Nvidia (NVDA) shares surged to the $130 mark yesterday – a level not seen since late February 2025. This strong rise, marked by a wide bullish candlestick, helped Nvidia reclaim its status as a company valued at over $3 trillion.
Why Nvidia (NVDA) Shares Are Rising
The bullish sentiment has been driven by several factors, including:
→ Price increases on products: Nvidia has raised prices on its graphics cards and data centre chips. The GeForce RTX 5090 has risen by more than 10%, while the RTX 50 series is up by 5–10%.
→ News of a major contract: The company will supply chips to an AI start-up backed by Saudi Arabia. In addition, media reports suggest that the US government is considering a deal allowing the UAE to purchase up to 500,000 Nvidia chips annually until 2027.
All of this could positively impact Nvidia’s revenue, encouraging investors to buy NVDA shares.
Technical Analysis of Nvidia (NVDA) Stock Chart
Yesterday’s sharp rally suggests a breakout from the descending channel (marked in red), which had remained in place since late last year.
The breakout occurred near the $123 level, which had previously acted as resistance. It is therefore possible that if there is a pullback in the NVDA stock price, this level could act as support (“breakout retest” pattern), confirming the breakdown of the descending channel and strengthening the outlook for further growth.
This article represents the opinion of the Companies operating under the FXOpen brand only. It is not to be construed as an offer, solicitation, or recommendation with respect to products and services provided by the Companies operating under the FXOpen brand, nor is it to be considered financial advice.
NVDA Weekly Head and Shoulders There's no main price target in mind, however the company from a risk management perspective has been largely not investible for about a year. Multiple 40-60% moves from top to the bottom of the range. Now with diffusion global competition will eventually eat into Nvidia's earnings/market share.
Without a major wave of monetary inflation in the United States it's very like that the short/medium term top has been put in and AI is a narrative that is played out. AI although impressive has yet to deliver what people see has a true life changer. It will eventually happen but Nvidia will have competition when that occurs.

Trading the Impulse Rally Retracement — Price and Time Symmetry Trend is observed from an impulse run’s lowest/highest point and projected outwards in symmetrical fibonacci retracement via price/time from the first reversal candle to the end of the rally, creating crosshairs. These ‘crosshairs’ visually represent the trending ‘price distribution projection’ in price/time symmetry.
Using this concept, I draw a ‘projection trend line’ from the bottom or top of the impulse run thru the projected 78.6% price/time retracement value, to identify the price distribution structure in a linear form.
Now to introduce my STOP LOSS TRIANGLE.
This is a concept of decaying price and time as an underlying move towards our theoretical projection, where if the underlying enters our built faded cross-section, the SL is triggered to avoid sideways consolidation and decaying contract premiums.
This ‘right’ triangle that is ‘sclene’ by nature is created by taking the furthest projection in price/time symmetry (78.6%) and drawing a vertically placed straight line to the highest/lowest point in the rally previously identified. Here, I create a ‘right triangle’ by turning 90 degrees towards my final point, which is made by the nearest projection in price/time symmetry (38.2%). In its entirety, this forms the stop loss triangle.
Come follow me on X @askHVtobidIV for more!
CHEERS!

NVDA New 2025 All-Time High Explained, 153 Next Followed by 194The NVDA stock just hit its highest price since March. Today it moved above resistance while producing a perfect ascending triangle pattern.
This is a major development because the resistance level that was broken today, 114, rejected growth a total of 4 times. NVDA moving above this level confirms the continuation of the bullish move coming from a technical analysis perspective.
Just to be unbiased, I have to mention that there is still one final level to conquer before the chart truly points to a new All-Time High.
The resistance is not a single price but a range, the resistance zone. This range sits between 114 and 123. Once NVDA closes decisively above 123, say a full daily or weekly candle with really high volume, we have a test of the All-Time High as resistance confirmed.
Depending on how the market reacts once the ATH is challenged we can determine what will happen next.
For example, if the ATH produces a very strong rejection with really high bearish volume, we know that a major correction will follow and even a lower low becomes possible. But, on the other hand, if challenging the ATH results in a mild market reaction, a normal drop/retrace then immediately we know that additional growth will happen after a higher low.
The truth is, Nvidia will move up, fight a little bit at the ATH and then continue growing. Just as we predicted the bottom we can predict what will happen next based on the chart. The chart is saying up long-term and this means a new All-Time High in 2025. Rest easy.
Thank you for reading.
Your support is appreciated.
Namaste.
