NVIDIA Corporation: Bullish ConsolidationThe NVDA stock is facing resistance at the 0.5 Fib. extension level. This resistance was met after a higher low and above 0.618 Fib. While this is a confirmed resistance zone, market conditions are bullish.
The RSI is now above 50. It is at its highest on a rise since late January earlier this year.
Local resistance on the RSI has been broken and this oscillator is trading straight up. This is a positive and strong signal. Here is the chart:
The yellow horizontal line is the local resistance which has been broken. On a drop, this same line would now work as support. A "magic" line I should say. :D
It is magical because it helps us predict the future with a high level of accuracy and certainty; so far so good.
These dynamics: The higher low, the small stop at resistance, the bullish RSI and overall bullish market conditions are all part of a bullish consolidation period.
Let me break it down for you; the market will continue to consolidate for a while, for as long as it needs, before moving higher to hit a new high. The conditions revealed by this chart setup is that the low that was hit 7-April remains the bottom. The market can shake, NVDA can go down, it can go up but this low will never be challenged, you can set your stop-loss below it. Any short-term movements against you is just noise. Wait patiently and eventually it will grow.
If you have any questions leave a comment it will be my pleasure to answer.
Thank you for reading again.
See you tomorrow, or the next day, or yesterday-more again.
Make sure to follow. My main focus is Cryptocurrency but I also do the SPX, NVDA and TSLA. (And sometimes Gold which is bearish now.)
Namaste.
NVDA

Nvidia Shows Signs of Recovery -but the Bearish Channel Remains Over the last five trading sessions, Nvidia’s stock has gained more than 9%, and short-term bullish momentum remains intact as the tech giant appears to benefit from expectations of a potential easing in trade war tariffs. Notably, the company’s CEO, Jensen Huang, recently stated that the Chinese market for artificial intelligence chips could reach $50 billion within the next two years — highlighting the importance of maintaining access to this market. This reinforces the view that a diplomatic resolution to the trade conflict is crucial for Nvidia to sustain a steady recovery.
It’s also important to note that Nvidia is scheduled to release its next earnings report on May 28, with market expectations pointing to earnings of approximately $0.88 per share. Should results meet or exceed projections, this could reignite a bullish sentiment that has been largely absent from the stock over the past several months.
Bearish channel still in play:
Since early January of this year, Nvidia’s stock has formed a steady downward channel, pushing the price even below the $100 mark at times. While a consistent upward correction is underway, it remains insufficient to confirm a definitive breakout, meaning this bearish channel is still the dominant technical structure in the short term.
ADX:
The ADX indicator has been fluctuating below the neutral 20 level, signaling a decline in volatility over the average of the last 14 sessions. As long as this continues, the current phase of price neutrality may persist.
RSI:
The RSI is showing a similar picture, hovering near the 50 level — indicating a balance between buying and selling momentum in recent sessions, and reinforcing the lack of a clear short-term trend.
Key levels to watch:
$113: Current resistance level, aligned with the upper bound of the bearish channel and the 50-period simple moving average. Continued price action in this area may extend the current phase of consolidation.
$125: A critical resistance point tied to the 200-period simple moving average. A breakout toward this level could signal the end of the bearish channel.
$100: A key psychological support level in the short term. A move below this threshold could reinforce the bearish bias and trigger a deeper downtrend within the current price structure.
Written by Julian Pineda, CFA – Market Analyst

$MSFT BEST TRADE EVER? SUB $400 incoming by Mid JuneHey everybody, I hope that rally didn't kick your arses the way it did mine. You know, it's like I'm allergic to taking upside atm due to how bearish the MACRO is. Of course, with time, I'm going to assume I get most of my downside Price Targets in the next several years.
If you refer to the previous 23% Run to the 200DMA from the 50day in 2023 , NASDAQ:MSFT produced a 9 COUNT SELL SIGNAL , RALLIED for a week, and then dropped to new lows. That is what I am expecting here.
NASDAQ:MSFT looks absolutely ripe for the taking. We just rallied 17% and got the 9 COUNT SELL SIGNAL . Mind you, Gaps galore below. The Monthly and the Weekly both have Gaps . Charts do not like that, let me tell ya. I'm excited if you can't tell. NASDAQ:META and NASDAQ:AVGO look great as well. I'm still cautious about a spike out but I figure if we continue higher, i will have opportunity to grab more for cheaper as I am very confident in this move. The price moved above the DEATH CROSS and above the 200DMA . Not ever a healthy move if it moves Vertically from the 50 day and Crosses above both MA's without a stop. Mid June NASDAQ:MSFT should be at new lows.

My buy view for NVIDIA stock explained My buy view for NVDA.
If positive fundamentals continue to outweigh bad news, we are likely to see NVDA push further up towards $120, $130, $140, and then its previous peak of $150.
Trade with care if you are day trading, but this baby is still selling at discount in my view

Stock Market Forecast | TSLA NVDA AAPL AMZN META MSFTStock Market Forecast | CME_MINI:NQ1! CME_MINI:ES1! QQQ SPY SP:SPX
Mag 7 Forecast TSLA NASDAQ:NVDA AAPL AMZN META MSFT

This AI-Backed IPO Is Just Warming Up — Next Stop: 86% Gains?CoreWeave is showing classic IPO 'honeymoon phase' price action, with early liquidity swept and bullish structure forming.
🔍 Price swept the daily sell-side liquidity at $35.70
📈 Now pushing higher — next major buyside targets at $55.04 and $65.22
🤖 Backed by NVIDIA, adding serious momentum and credibility
🧠 Expecting strong continuation as institutions begin to build exposure
If price maintains structure, this could be one of the strongest IPO moves of 2025.

NVIDIA Massive bullish break-out after 4 months of selling.NVIDIA Corporation (NVDA) made a critical bullish break-out yesterday (in the aftermath of Meta's and Microsoft AI capex numbers) as it didn't just break above the 1D MA50 (blue trend-line) that has been intact as a Resistance since February 27 but also above the top of the Channel Down that has been the dominant pattern throughout this correction since the January 07 All Time High (ATH).
The 1D RSI is on an Inverse Head and Shoulders (IH&S) pattern, which is always bullish and if NVDA closes a 1D candle above the 1D MA50 next, then our short-term Target will be 143.50, which is just below Resistance 1 and the 2.0 Fibonacci extension.
-------------------------------------------------------------------------------
** Please LIKE 👍, FOLLOW ✅, SHARE 🙌 and COMMENT ✍ if you enjoy this idea! Also share your ideas and charts in the comments section below! This is best way to keep it relevant, support us, keep the content here free and allow the idea to reach as many people as possible. **
-------------------------------------------------------------------------------
💸💸💸💸💸💸
👇 👇 👇 👇 👇 👇

NVDA Day Trade Plan for 04/29/2025NVDA Day Trade Plan for 04/29/2025
📈 111.90 109.90
📉 105.90 103.90
Thanks to all my followers! Truly appreciate the support!
Please like and share for more ES/NQ levels Tues & Thurs 🤓📈📉🎯💰
*These levels are derived from comprehensive backtesting and research and a quantitative system demonstrating high accuracy. This statistical foundation suggests that price movements are likely to exceed initial estimates.*

If you think the 2025 bottom is in you couldn't be more wrongIf you think the bottom for 2025 is in and it's only up from here let me have what you're smoking.
Just a puff, please!
About 80% of social media retail traders are confidently calling a bottom, that's a major contrarian signal.
Herding equals danger!
If everyone is bullish, most are already positioned long leaving a few buyers to push prices higher.
It's known as "pain trade" where markets often move in the direction that causes the most discomfort.
Many of loudest voices are retail traders influencers chasing engagement, not portfolio managers or data driven strategists.
AMEX:SPY SP:SPX NASDAQ:QQQ AMEX:DIA NASDAQ:META NASDAQ:NVDA NASDAQ:MSFT NASDAQ:GOOG NASDAQ:AAPL NASDAQ:AMZN

NVDA - BullishForecast a break-out up as the price increased by 3.3% in the after hours.
- The price area in a falling wedge, almost a descending channel.
- The MACD indicator in the Weekly frame shows an uptrend after a rare day of oversold (04.04.2025).
The price today (04.30.2025): $108.92.
Price target: $135.00.
Stop loss: $95.00.
IMO, amateur trader.

NVIDIA: Don't turn your back on the A.I. darling yet.NVIDIA has turned neutral on its 1D technical outlook (RSI = 48.902, MACD = -2.040, ADX = 28.815) as it has recovered a portion of the 2 month correction. April's low was exactly on the 1W MA100 just like the Low of the 2024 consolidation phase has been near the 1W MA50. The pattern is recurring and the rallies naturally get weaker each time as we approach the end of the Cycle this year. The 1st rally was +358%, the 2nd +257% so the 3rd one now is expected to be +157%. That gives a $225 target. The next Top will most likely start a new correction (Bear Cycle) for a 3rd Bottom on the 1W MA200.
## If you like our free content follow our profile to get more daily ideas. ##
## Comments and likes are greatly appreciated. ##

REJECTION OF $292Tesla's stock ( NASDAQ:TSLA ) has faced multiple rejections at key resistance levels. To establish a strong upward trend, it may require forming a triple bottom pattern. This would indicate a solid foundation for potential growth. It is anticipated that the stock will retest the $270 and $250 levels before making a decisive move.

April 29, 2025 - Waiting for the Crash or the Miracle?Hello everyone, it’s April 29, 2025. Yesterday’s market session was about as exciting as watching paint dry. After months of Trump-fueled chaos, investors seem almost relieved that… nothing happened. Indices barely moved: TVC:DJI up 0.28%, SP:SPX up a pathetic 0.06%, CME_MINI:NQ1! down 0.10%. In short: we’re falling from a 150-story building, and so far, so good — but we know the real pain comes when we hit the ground.
Markets are clinging to hopes that Trump’s trade war with China might get a Hollywood-style happy ending. He’s calmed down a bit. Stopped slamming Powell, flirted with diplomacy, and softened up on auto tariffs. But with an avalanche of critical economic data coming (Consumer Confidence, GDP, PCE, Jobs) and Magnificent Seven earnings, no one’s taking big bets right now. Everyone’s waiting to see if the economic parachute opens, or if we get pancaked on impact.
Meanwhile, US macro isn’t looking great. Confidence is sinking — 53% of Americans say their finances are worsening, a record since COVID. Consumer spending is stalling, companies like NASDAQ:AAL and NASDAQ:DPZ are canceling forecasts, and the real estate market is coughing. Even hardcore Trump supporters are starting to sweat. The US might still technically be growing, but psychologically, the recession has already started.
OANDA:XAUUSD is holding strong at $3,321, BLACKBULL:WTI is around $61.57, and BINANCE:BTCUSDT is cruising near $94,400. Futures this morning are flailing between -0.6% and +0.2%, dancing to the tune of whatever headline drops next.
On the political front, Trump pulled a classic backpedal on auto tariffs: no double penalties for carmakers, partial refunds on tariffs already paid, and promises of time for US production reshoring. Nice words but rebuilding car factories will take years.
As for NASDAQ:NVDA , it’s under pressure after China banned sales of its H20 chips. Huawei’s Ascend 910D chip is stepping in — good for China, but too slow and too pricey for the rest of the world. Nvidia stays king globally for now, but the tech war is heating up.
Today, eyes are on key numbers: US Consumer Confidence (expected 87.7) and JOLTS job openings (expected 7.49M). Also, a heavy lineup of earnings: NYSE:V , NASDAQ:SBUX , NASDAQ:COKE , NYSE:PFE , NYSE:SNAP , and more.
For now, we’re still in free fall, hoping there’s a giant crash pad waiting at the bottom. Hang tight — it’s going to be another wild one.

Bad News from NVDA and ASML Put Pressure on AI StocksTwo pieces of bad news hit the chip sector in a single day.
First, the U.S. announced new restrictions on Nvidia, blocking the sale of its H20 chip to China. H20 was the only AI chip Nvidia could legally sell to China under existing regulations. The company stated the new restrictions could cost up to $5.5 billion.
The second blow came from ASML’s earnings report. ASML is the sole producer of EUV machines, which are critical for manufacturing advanced chips, including those used in AI. ASML's revenue miss, combined with the Nvidia news, weighed heavily on technology stocks. However, there is a silver lining: the revenue miss was due to weaker DUV machine sales, which are used for more basic chips. EUV sales actually beat market expectations by 33.54%, indicating that investment in AI infrastructure remains strong.
Nvidia shares are down more than 6% in premarket trading. This downward pressure may continue after the market opens. If the price drops below 100, it could present a buying opportunity for medium- to long-term investors. AI investment continues globally, and countries outside the U.S. are likely to accelerate their efforts to catch up. Despite the recent negative sentiment, there is no major change in the long-term outlook for the sector.

$SPX Sell in May, Go Away, $5k, Dead Cat to $5.3k, $4.8k by EOMAlrighty. My forecast is as follows. I made a video explaining just a quick thought and here's the video in a written version for the most part. Basically, I'm a pattern chart trader and I spend the majority of my days looking for specific candlestick patterns that match candle for candle. I cannot find anything remotely close to today's Price Action besides October 2001. I have been and will continue to be doubted and that's okay. I am not here for anyone except myself and anyone that wants to gain a fresh unbiased perspective. People have called me a Permabear but that only pertains to my personality, which is that of a realist. I do not believe investing for the next 20-50 Years will work for everyone. You'd have to do it well and continuously contribute even during the down days. Either way. This is the analog I will be following. Fib is Extended way beyond Blow Off Top measurements imo. The market gained 50% in One Year and Three Months. I'd like to think that the uncertainty being priced in will cause these Deeper Fib Retracements. We already crashed down to the 1.61 GOLDEN POCKET from above and now bounce back to Secon Golden Pocket at 2.61. Based on the past behavior, now we move back to 2.0 for a move to the original extension of the 1.00 Fib. If we lose this, we start moving back to the 1.27 near $4.74k on SPX where I will then be looking for one final dead cat to $5300 by mid August, Every July dip being grabbed up ... Final Sell in August for an End of Year Crash to Mark 2025 as one of the worst years ever in Life as far as the Market goes. Good Luck everyone. Tips always welcome.

Was this the best buying opportunity since 2011?Sure, here's a rewritten version of your text in an engaging tone:
"Have you ever heard of the Zweig Breadth Thrust? Well, let me tell you, it’s an incredible metric that can really shed some light on the current market situation!
So, what would it take for me to believe that this bounce isn't just another bear market rally? My first step would be to dive into the breadth indicators and look for signs of that elusive breadth thrust.
Think of a breadth thrust like a rocket taking off. You need a strong initial boost to break free of gravity's grip. If the thrust is weak, the rocket can’t escape, and the same applies to stock market reversals. When we see a robust breadth thrust, that's a signal that a significant reversal is underway. Without it, we could be facing another false bounce.
Now, let’s talk numbers! As of Friday, April 25th, the SPX has surged an impressive 14.2% from its recent lows, and while that’s quite a leap, it’s essential to keep it in perspective. Just think back—this index was down 21.35% from its all-time high earlier in February during the panic sell-off. Now, with the recent strength, it’s only 10.75% off its peak.
The Zweig Breadth Thrust is calculated based on the 10-day EMA of NYSE Advances divided by the sum of Advances and Declines. A bullish signal pops up when the ZBT shifts from below 0.40 to above 0.615 within just ten days or less. Keep an eye on that—it might just help us navigate these choppy waters!"
On the monthly chart, it’s clear that what we’ve been seeing in the broader economy (you know, Main Street) is actually showing us some bearish divergence—a concept I've mentioned in my previous ideas.
Since 2009, we've had four notable instances on the Monthly chart where the ZBT dipped below 0.40, only to bounce back up past the 0.6 mark. Remember back in November 2011? That was when we got a significant signal with a low reading of 0.31, which climbed back to 0.62 by February 2013. That surge sparked a bull run that peaked in February 2020!
So, the takeaway here is that this breadth thrust is generating the positive momentum we need to reach new stock market highs this year. Exciting times ahead!

MAGS SUPER STRUCTURE FORMING CAUTION!We have MEGA superstructures forming everywhere. H&S Eiffel Towers, etc.. None will be more devastating to 401ks and people's portfolios than the MAGS breaking down from this mammoth structure.
Last chance to GTFO forming.
CAUTION is in order!
Click Boost, Follow, Subscribe. Let's get to 5,000 followers ))

𝗧𝗲𝘀𝗹𝗮 𝗕𝗿𝗲𝗮𝗱𝗸𝗼𝘄𝗻: Priced for perfectionPriced for perfection in an imperfect market
NASDAQ:TSLA nearly hit its 200dma and key resistance area (~288–292) after a roughly 20% post-earnings squeeze, and as long as it stays below that level, it risks retesting the long-term uptrend line that has marked major lows twice since COVID.
𝘛𝘢𝘳𝘪𝘧𝘧 𝘢𝘯𝘥 𝘴𝘶𝘱𝘱𝘭𝘺-𝘤𝘩𝘢𝘪𝘯 𝘳𝘪𝘴𝘬: Tesla depends heavily on Chinese-made battery and electronic components now hit by reciprocal U.S. tariffs, while over 60% of global neodymium and dysprosium—vital for its EV motors—are mined and processed only in China, creating a critical bottleneck that could sharply elevate its input costs.
𝘔𝘢𝘳𝘨𝘪𝘯 𝘱𝘳𝘦𝘴𝘴𝘶𝘳𝘦 𝘷𝘴. 𝘭𝘰𝘧𝘵𝘺 𝘷𝘢𝘭𝘶𝘢𝘵𝘪𝘰𝘯: Q1 price cuts of up to 20% on core models drove Tesla’s auto gross margin to its lowest since 2020, calling into question the sustainability of its >70× forward P/E multiple, which assumes exceptionally high profits from future ventures like robotics and autonomous fleets.
$NQ_F NASDAQ:NDX NASDAQ:QQQ NASDAQ:AMZN NASDAQ:META NASDAQ:NVDA NASDAQ:SOX $ES_F AMEX:SPY SP:SPX TVC:DXY NASDAQ:TLT TVC:TNX TVC:VIX #Stocks #TrumpTariffs 🇺🇸 #ChinaTariffs 🇨🇳

$NVDA one more leg lower $58-76 targetNASDAQ:NVDA bounced off the lows at $86 but is now finding resistance, I think it's likely that we turn lower next week and start falling towards the targets below.
I think it's very likely that we make it down to the lower supports at $63-58 before we see a sustainable bounce form.
Let's see how it plays out over the coming weeks.

Nvidia Prepares For New All-Time High, Last Chance To Buy Low!The market always gives as second chance. This is a phrase that I love to share and it is true, it is confirmed here on this very chart.
The action for NVDA moved back down to produce a higher low —your second and last chance. This higher low is happening within a very strong buy-zone and this can mean the difference between massive profits or an opportunity that is lost. From here on, Nvidia will grow long-term set to produce a new All-Time High in the coming months.
The minimum target and price level for this rise stands around ~150 within 1-3 months. Then a correction and then higher, much higher... Up, up and up go we.
I can entertain you with tons of details I have the ability but I will not do so. I will go straight to the point.
» The next All-Time High and main target for this wave is 194, this can take a little more, or less, than 6 months.
What will happen next, we will have to wait to ask the chart.
It is my pleasure to write for you again.
Make sure to boost if you would like more updates.
If you boost and comment, we can move to daily updates as the market grow.
Go in, go now, buy-in and go LONG!
Nvidia is going up! Together with Bitcoin and the Altcoins.
Thanks a lot for your continued support.
Namaste.

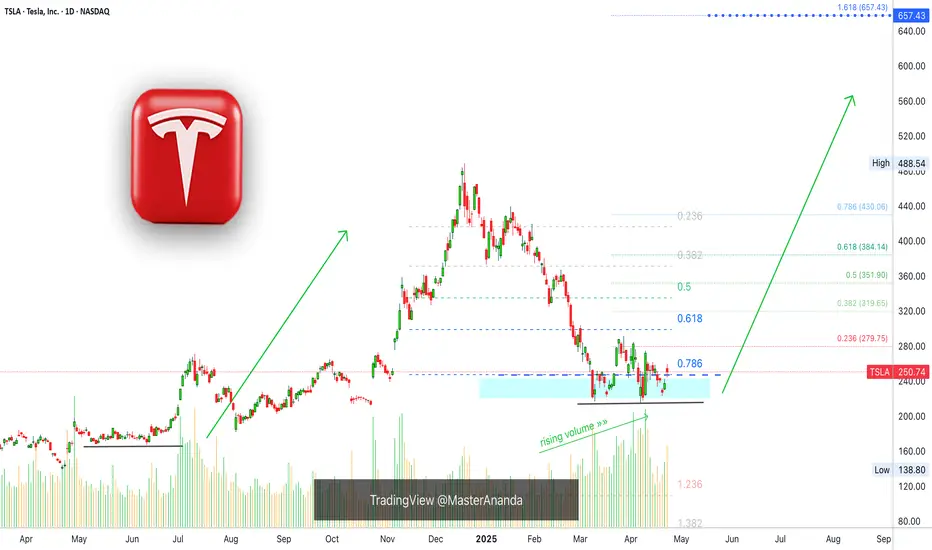
Tesla Finds Support, 657 Next Easy High & All-Time HighTesla is looking pretty good right now, support has been found. The correction amounted to -55.5%. It started in mid December 2024 and the first low was hit in March 2025.
Since March TSLA has been in the process of forming a bottom.
The action moved below 0.786 Fib. retracement level in relation to the last bullish wave. The action is back above this level now and this is pretty good. As long as the action happens above the magic blue dashed line, Tesla is good and set to grow.
This signal, perfect symmetry, is supported by rising volume.
Buy volume is rising massively as TSLA moves into a long-term support zone.
(Smart people, smart money and smart traders buy when prices are low —this volume signal reveals the highest buying in years as TSLA hits support.)
The most revealing fact from a logical standpoint is the size of the correction, a 55% correction is a lot by any standard. When a market goes through such a strong correction, it tends to reverse and produce next a new move. It moves in waves. It goes up and down, up and down. We are seeing the end of the down-move and this will automatically lead to an up-wave.
When the bottom was hit, last month, the action goes flat. Tesla was clearly moving lower but as support was found the bottom stays flat. This is another revealing signal for the logical mind. No longer a downtrend but a consolidation phase, which is part of a transition period.
» So the market was bullish and from bullish turned bearish, from bearish it went sideways and from sideways it will grow.
This is an easy buy.
Thanks a lot for your comment and continued support.
Namaste.
NVDA Recovery in Motion — Bullish Setup BrewingNVDA 6H TECHNICAL ANALYSIS 📈
OVERALL TREND
📈 UPTREND — The chart confirms an early-stage recovery from a key pivot low (April 22), with moderate confidence (4.8%). The structure is forming higher lows, and price is currently above several critical short-term MAs. Trend Score sits at +0.10.
📉RESISTANCE ZONE
🔴 153.1300 — SELL STOPLOSS | PIVOT HIGH
🔴 149.8423 — SELL ORDER 2
🔴 143.18875 — SELL ORDER 1
🎯ENTRIES & TARGETS
🎯 139.8280 — EXIT BUY & TP 4
🎯 127.7263 — BUY ORDER & TP 3
🎯 119.8750 — BUY ORDER & TP 2 | MID PIVOT
🎯 108.5705 — BUY ORDER & TP 1
📈SUPPORT ZONE
🟢 97.0121 — BUY ORDER 1
🟢 89.9455 — BUY ORDER 2
🟢 86.6200 — BUY STOPLOSS | PIVOT LOW
✍️STRUCTURAL NOTES
Recent bounce from 86.62 pivot low signals strong bullish interest
Key reentry occurred above 97.01, aligning with short-term moving averages
All major short-term and mid-range MAs (10–100) are BUY-rated
Oscillators mixed: MACD and Ultimate Oscillator lean bullish, while Momentum and Williams %R flash caution
Ichimoku Base Line neutral — awaiting trend confirmation
Hull MA diverges from other MAs — short-term caution on overheated price
📉TRADE OUTLOOK
📈 Bullish bias toward TP3 @ 127.72 and TP4 @ 139.82
📉 Short-term pullback likely at 108.57 or 119.87 — use dips as potential reentry
🔍 Watch for rejection near 143.18–153.13 to reassess continuation vs correction
🧪STRATEGY RECOMMENDATION
CONSERVATIVE TREND FOLLOW:
— Entry: 97.01
— TP: 108.57 / 119.87 / 127.72 / 139.82
— SL: Below 86.62
AGGRESSIVE REVERSAL:
— Entry: 86.62 (Pivot Low Defense)
— TP: 97.01 / 108.57
— SL: Below 83.00
“Discipline | Consistency | PAY-tience™”

$PLTR Trade: Buy $90.86 , Target $101.35Beep Beep. Hope everyone is taking care of their trading accounts during this volatile phase in the markets. I noticed an identical setup on the weekly from back in August 24' and I'm looking to take advantage. We have a trend reversal on the Tom Demark sequential that helps identify trend exhaustion through a 9 Count. Currently on a 2 Count, we're testing the gap while simultaneously testing the 10WMA at 90.86.There is also a weekly gap at 101.35 ... Entry would be the 10WMA. Target the weekly Gap. Trade is as follows:
Trade Idea - Swing NASDAQ:PLTR $95 Calls 4/25
Entry - 10 WMA @ $90.86
Target - Gap on Weekly at $101.35
