Chips Down: What Shadows Loom Over Nvidia's Path?While Nvidia remains a dominant force in the AI revolution, its stellar trajectory faces mounting geopolitical and supply chain pressures. Recent US export restrictions targeting its advanced H20 AI chip sales to China have resulted in a significant $5.5 billion charge and curtailed access to a crucial market. This action, stemming from national security concerns within the escalating US-China tech rivalry, highlights the direct financial and strategic risks confronting the semiconductor giant.
In response to this volatile environment, Nvidia is initiating a strategic diversification of its manufacturing footprint. The company is spearheading a massive investment initiative, potentially reaching $500 billion, to build AI infrastructure and chip production capabilities within the United States. This involves critical collaborations with partners like TSMC in Arizona, Foxconn in Texas, and other key players, aiming to enhance supply chain resilience and navigate the complexities of trade tensions and potential tariffs.
Despite these proactive steps, Nvidia's core operations remain heavily dependent on Taiwan Semiconductor Manufacturing Co. (TSMC) for producing its most advanced chips, primarily in Taiwan. This concentration exposes Nvidia to significant risk, particularly given the island's geopolitical sensitivity. A potential conflict disrupting TSMC's Taiwanese fabs could trigger a catastrophic global semiconductor shortage, halting Nvidia's production and causing severe economic repercussions worldwide, estimated in the trillions of dollars. Successfully navigating these intertwined market, supply chain, and geopolitical risks is the critical challenge defining Nvidia's path forward.
NVDA

NVDA Weekly Options Trade Plan 2025-04-15NVDA Weekly Analysis Summary (2025-04-15)
NASDAQ:NVDA
Below is a synthesized, step‐by‐step quant analysis of NVDA’s weekly options environment based on all model reports and the provided options data:
─────────────────────────────
SUMMARY OF MODEL KEY POINTS
▪ Grok/xAI Report – Price is trading tightly in a range near $112.20 with short‐term oscillation between support (~$111.95) and resistance (~$112.35). – Very mixed short‐term indicators (5‑minute MACD bearish but daily MACD bullish) and overall neutral technicals. – High option volume and open interest around $110 (max pain) and $115, but the report concludes with “no trade recommendation” given the mixed signals.
▪ Llama/Meta Report – Confirms NVDA is at $112.20 and finds 5‑minute charts “neutral/consolidating” while noting the daily chart shows some bullish recovery. – Despite daily technical hints of a potential bullish reversal, overall bias is assessed as moderately bearish. – Recommends a put option trade—specifically a $109 strike put with an ask premium of $0.84—citing a moderately bearish view and a 70% confidence level.
▪ Gemini/Google Report – Acknowledges that while the daily chart is bullish (strong momentum above keys like the 10‑day EMA) short‑term M5 charts show consolidation and the negative news (export restrictions and a possible $5.5B charge) adds significant uncertainty. – Notes that the max pain level is at $110 (below the current price) and that although pre‑market action appears firm, the conflicting signals create high risk. – Concludes strongly to “NO TRADE” at the open given the mixed and conflicting signals (confidence around 30%).
▪ DeepSeek Report – Points out that although NVDA is trading above some key EMAs, the negative news and heavy put open interest (especially near the $110 level) weigh on sentiment. – Using max pain logic and a moderately bearish bias (targeting a move toward $110), recommends buying a $110 strike put at a $1.10 premium with a 68% confidence level. – Provides detailed entry, profit target, and stop‐loss conditions (though the premium is notably above an “ideal” range of $0.30–$0.60).
───────────────────────────── 2. AREAS OF AGREEMENT AND DISAGREEMENT
Agreement: – All models acknowledge that the negative news (export restrictions, potential $5.5B charge) introduces strong bearish pressure. – There is a common observation that options open interest clusters around the $110 level (max pain) with heavy activity on both calls and puts, signaling sensitivities near that price. – Technical indicators in the very short term (5‑minute charts) show consolidation, even though the daily charts lean more bullish in some cases.
Disagreement: – Grok/xAI and Gemini conclude that the mixed signals (technical consolidation with bearish news drag) warrant no immediate trade at open. – Llama/Meta and DeepSeek tilt toward a moderately bearish view and recommend a put trade—though they differ on the exact strike (Llama selects ~$109, DeepSeek prefers $110) and premium levels. – Confidence levels differ substantially (from 0% and 30% up to 68–70%), reflecting uncertainty about whether the news or bullish technicals will dominate intraday.
───────────────────────────── 3. CONCLUSION & RECOMMENDED TRADE
Overall Market Direction Consensus: The environment remains ambiguous. Although the daily charts show some bullish resilience, the weight of recent negative news, the gravitational pull of $110 max pain, and heavy put volumes lean toward a modestly bearish bias. Still, the signals are mixed and the immediate post‑open direction is highly uncertain.
Recommended Trade (if you choose to be opportunistic): Based on Llama/Meta and DeepSeek—if you’re willing to take a moderately bearish bet at open—a put trade might be considered. However, note that Gemini and Grok/xAI advocate waiting for a clearer signal given the uncertainty.
For traders who prefer to have a trade based on a bias toward a downside reaction, one possible trade would be: • BUY a single‑leg, naked weekly PUT option. • Strike: $109.00 (ask premium of $0.84 is close enough given liquidity and moderate bearish distance). • Expiration: April 17, 2025 • Entry: at market open • Rationale: With a moderately bearish tilt from the negative news and max pain considerations, a $109 put offers a risk/reward profile in a premium region slightly above the ideal range (but acceptable given the high-impact catalysts). • Confidence Level: ~70% • Key risks: A continued short‑term consolidation or a “bounce” in price (especially if NVDA moves toward the max pain level and finds support) would hurt a put position. Also, any unexpected bullish catalyst could quickly overturn the bearish bias.
That said, because of the significant conflicting factors and the risk that the negative news may already be priced in, one could also justify sitting on the sidelines (as recommended by two of the models).
───────────────────────────── 4. FINAL RECOMMENDATION
In our view, the market is too conflicted for a high‑confidence directional bet. However, if you are inclined to act on the moderately bearish view—and you accept the risk of an early move against your position—the put side is the only candidate for a single‑leg trade. With that said, given the discord among the models (with two models advising “no trade”), a conservative trader might well decide to wait for clearer price action at the open.
───────────────────────────── TRADE DETAILS (JSON Format)
{ "instrument": null, "direction": null, "strike": null, "expiry": null, "confidence": null, "profit_target": null, "stop_loss": null, "size": null, "entry_price": null, "entry_timing": null }
───────────────────────────── FINAL NOTE: While there is some support for a moderately bearish put trade (for example, buying a $109 put at $0.84), the divergent signals from the models (including strong advice from two reports to avoid trading today) mean that risk management is paramount. Many quant practitioners would prefer to wait until post‑open confirmation before jumping in.
Disclaimer: This newsletter is not trading or investment advice but for general informational purposes only. This newsletter represents my personal opinions based on proprietary research which I am sharing publicly as my personal blog. Futures, stocks, and options trading of any kind involves a lot of risk. No guarantee of any profit whatsoever is made. In fact, you may lose everything you have. So be very careful. I guarantee no profit whatsoever, You assume the entire cost and risk of any trading or investing activities you choose to undertake. You are solely responsible for making your own investment decisions. Owners/authors of this newsletter, its representatives, its principals, its moderators, and its members, are NOT registered as securities broker-dealers or investment advisors either with the U.S. Securities and Exchange Commission, CFTC, or with any other securities/regulatory authority. Consult with a registered investment advisor, broker-dealer, and/or financial advisor. By reading and using this newsletter or any of my publications, you are agreeing to these terms. Any screenshots used here are courtesy of TradingView. I am just an end user with no affiliations with them. Information and quotes shared in this blog can be 100% wrong. Markets are risky and can go to 0 at any time. Furthermore, you will not share or copy any content in this blog as it is the authors' IP. By reading this blog, you accept these terms of conditions and acknowledge I am sharing this blog as my personal trading journal, nothing more.

Nightly $SPY / $SPX Scenarios for April 16, 2025🔮 🔮
🌍 Market-Moving News 🌍:
🗣️ Federal Reserve Speeches: Federal Reserve Chair Jerome Powell is scheduled to speak at 1:30 PM ET, providing insights into the economic outlook and potential monetary policy adjustments. Additionally, Cleveland Fed President Loretta Mester will speak at 12:00 PM ET, and Kansas City Fed President Jeffrey Schmid and Dallas Fed President Lorie Logan will speak at 7:00 PM ET.
📊 Key Data Releases 📊
📅 Wednesday, April 16:
🛍️ Retail Sales (8:30 AM ET):
Forecast: +1.2%
Previous: +0.2%
Measures the total receipts of retail stores, reflecting consumer spending trends.
🏭 Industrial Production (9:15 AM ET):
Forecast: -0.1%
Previous: +0.7%
Indicates the output of the nation's factories, mines, and utilities.
🏠 Homebuilder Confidence Index (10:00 AM ET):
Forecast: 37
Previous: 39
Assesses the confidence of homebuilders in the market for newly built single-family homes.
⚠️ Disclaimer: This information is for educational and informational purposes only and should not be construed as financial advice. Always consult a licensed financial advisor before making investment decisions.
📌 #trading #stockmarket #economy #news #trendtao #charting #technicalanalysis

April 15th Trade Journal & Stock Market AnalysisEOD accountability report: +940
Sleep: 8 hour, Overall health: Good
**Daily Trade Recap based on VX Algo System **
9:30 AM Market Structure flipped bullish on VX Algo X3! - easy money
10:10 AM VXAlgo ES X1 Sell Signal - easy money
1:02 PM Market Structure flipped bearish on VX Algo X3! - easy money
1:40 PM VXAlgo ES X1 Buy signal (triple signal) -a bit tuff but still work out
3:30 PM VXAlgo ES X1 Sell Signal (double signal) - a bit tuff but still work out
**Wed plan: ** Watch for 48M support or 195M support to tag around 5200-5300s.

US President Says All Necessary Permits Will Be Given to NVDAIn shocking turn of events today, US President Donald Trump said "All necessary permits will be expedited delivered to Nvidia."
The asset however, fail to play according to the rhythm of the fundamental, up by 1.51% as of the time of writing with the RSI at 56.27. Nvidia has also been plaque by Trump's tariff rate increment that saw the shares lose about 29% in market value for the past 3 weeks.
For Nvidia Shares ( NASDAQ:NVDA ), a break above the $150 resistant could pave way for a bullish course. Similarly, failure to break pass the resistant point could resort to a bearish reversal bringing it back to the support point.
Analyst Forecast
According to 43 analysts, the average rating for NVDA stock is "Strong Buy." The 12-month stock price forecast is $172.76, which is an increase of 53.68% from the latest price.

FREE Day Trade Setup 15April: $NVDA🚨 FREE Day Trade Setup: NASDAQ:NVDA 🚨
🚀 Bullish Scenario:
Entry: Break above $111.88 (S/R Area)
🎯 Targets: 10% / $112.70, $114.05, PDH
📈 Instruments:
Options: April 18th $112 Calls
🚪 Exit: Close below H5 on chosen timeframe (2m / 5m / 15m)
📉 Bearish Scenario:
Entry: Break below PDL at $109.07
🎯 Targets: 10% / $108.01, $106.92, $105.77
📉 Instruments:
Options: April 18th $109 Puts
🚪 Exit: Close below H5 on chosen timeframe (2m / 5m / 15m)
Not Financial Advice

$NVDA — Powering Ahead Amid Market VolatilityNVIDIA ( NASDAQ:NVDA ) is this week’s standout pick. AI models forecast up to +14.46% upside by April 25. Key support: $100.31 | Resistance: $128.04. AI strength, semis resilience, and rising demand in AI & cloud make NASDAQ:NVDA a top trade.

NVIDIA ---> The jorney TO ---> 90s and 80s (UPDATED) PART 2Okay guys. Here is my UPDATED idea (just dont know how to insert an updated chart in the previous exsiting idea).
I think it could be usful, CAUSE many guys burning for bullish.
I was straight bearish in the first part of idea, but here is some corrections cause of Trump canceled the additonal tarrifs for import from China, for critical technologies such as semiconductors, chips, smartphones and laptops.
So I assume the price can go first up to 113 and go down or even touch 117 and then the "Journey" at least to 90s and even 80s. As we see the lines of resistance in that areas on the chart.
The dead line for the price reversal is Tuesday, April 15
(in my opinion).
My technical analysis telling me this.
Let's watch what will happen.

NVIDIA ---> The jorney TO ---> 90s and 80s According to my technical analysis + Political causes of US trade policies and tarrifs uncertanties, which brought to losing in trust of partners and invesors to the current US administration, due to Trump's market manipulations.
My thoughts: it is should happen within next 1-3 days.
Buckle up! :)

Quantum's NVDA Trading Guide 4/13/25Sentiment: Neutral. AI chip dominance drives optimism, but tariff risks and valuation concerns temper enthusiasm. Chatter posts split—bulls see growth, bears eye correction.
Outlook: Neutral, slightly bearish. Options pin $110, with $105 puts active. ICT/SMT eyes $108-$110 buys to $115 if $108 holds. Bearish below $108 risks $105.
Influential News:
Federal Reserve: Two 2025 cuts support growth stocks, positive for $NVDA.
Earnings: Q1 due May; no update today.
Chatter: Debates AI growth vs. tariff/supply chain risks.
Mergers and Acquisitions (M&A): No confirmed NASDAQ:NVDA M&A; AI chip partnerships rumored.
Other: Tariff volatility hit NASDAQ:NVDA ; stock swung (April 3-9).
Indicators:
Weekly:
RSI: ~50 (neutral).
Stochastic: ~45 (neutral).
MFI: ~40 (neutral).
SMAs: 10-day ~$112 (below, bearish), 20-day ~$115 (below, bearish).
Interpretation: Neutral, bearish SMAs signal weakness.
Daily:
RSI: ~48 (neutral).
Stochastic: ~50 (neutral).
MFI: ~45 (neutral).
SMAs: 10-day ~$112 (below, bearish), 20-day ~$115 (below, bearish).
Interpretation: Neutral, bearish SMAs suggest pullback.
Hourly:
RSI: ~45 (neutral).
Stochastic: ~55 (neutral).
MFI: ~50 (neutral).
SMAs: 10-day ~$112 (below, bearish), 20-day ~$115 (below, bearish).
Interpretation: Neutral, stabilizing.
Price Context: $110.93 (April 11), 1M: -9%, 1Y: +28%. Range $105-$120, testing $110 support.
Options Positioning (May 2025):
Volume:
Calls: $115 (12,000, 60% ask), $120 (10,000, 55% ask). Mild bullish bets.
Puts: $105 (8,000, 70% bid), $108 (6,000, 65% bid). Put selling supports $108.
Open Interest:
Calls: $115 (35,000, +6,000), $120 (25,000, +5,000). Bullish interest.
Puts: $105 (20,000, flat), $108 (22,000, +3,000). Hedging. Put-call ~1.0.
IV Skew:
Calls: $115 (40%), $120 (42%, up 3%). $120 IV rise shows upside hope.
Puts: $105 (35%, down 2%), $108 (36%). Falling $105 IV supports floor.
Probability: 60% $105-$120, 20% <$105.
Karsan’s Interpretation:
Vanna: Neutral (~300k shares/1% IV). IV drop could pressure $110.
Charm: Neutral (~150k shares/day). Pins $110.
GEX: +60,000. Stabilizes range.
DEX: +8M shares, neutral.
Karsan view: GEX holds $105-$120; tariff news key.
ICT/SMT Analysis:
Weekly: Neutral, $105 support, $120 resistance. No $NVDA/ NASDAQ:AMD divergence.
Daily: Bullish at $110 FVG, targets $115. Bearish < $108.
1-Hour: Bullish >$110, $115 target. MSS at $108.
10-Minute: OTE ($109-$111, $110) for buys, NY AM.
Trade Idea:
Bullish: 50%. ICT/SMT buys $108-$110 to $115. Options show $115 calls. Fed cuts aid.
Neutral: 35%. RSI (~50), SMAs (bearish), $105-$120 range.
Bearish: 15%. Below $105 possible with tariffs. $105 put volume grows

Is Stock Market Bottom Here or Continue Crashing?Stock Market Analysis | NASDAQ:QQQ AMEX:SPY
Mag 7 Analysis | NASDAQ:TSLA NASDAQ:NVDA AAPL AMZN META GOOGL MSFT

Margin Meltdown & the Golden Surge: How Tech Cracks Fueled Gold?Margin Meltdown & the Golden Surge: How Tech Cracks Fueled Gold’s Breakout in April 2025
Fear-Driven Flight to Gold is Real
If margin calls continue and top stocks like Microsoft and NVIDIA keep showing weakness:
• Expect more bond market stress
• A persistently weak dollar
• And a sustained gold rally
Gold is the cleanest beneficiary of the current chaos. Every chart, every data point, every political move validates it.
////////=====////////
What’s Happening in the Stock Market and Trump’s Tariffs – Simple Summary (Updated & Validated)
1. Margin Loans:
Many investors borrowed money using their stock portfolios as collateral. For example, if someone owns $100,000 in Microsoft stock (now trading at $388.45), they could borrow up to 90% of that value — $90,000 — and use it to buy other stocks like NVIDIA ($110.93).
2. Margin Calls:
When the market fell earlier this month, Microsoft and NVIDIA dropped sharply. Brokers issued margin calls, forcing investors to either deposit more funds or sell off assets to cover their positions.
3. Forced Selling:
As stocks fell further, more investors were forced to liquidate. This increased selling pressure pushed prices down even harder.
4. Vicious Cycle:
The deeper the drop, the more margin calls got triggered, which led to even more forced sales — a self-perpetuating loop of destruction.
5. Bond Selling Instead of Stocks:
Some investors didn’t want to sell their stock positions and instead began selling bonds to raise cash — including even U.S. Treasuries.
6. Bond Market Shock:
This rare, broad-scale bond selloff shook up the entire fixed-income market — everything from corporate to government bonds dumped.
7. Rising Yields:
As bond prices fell, yields spiked. But this wasn’t due to strong growth — it was pure fear-driven liquidation.
8. Unexpected Dollar Weakness:
Usually, during times of crisis, the dollar strengthens. But not this time. The U.S. dollar fell, while currencies like the euro and Swiss franc gained. The Chinese yuan stayed weak under its own pressures.
9. Trump’s Reaction:
In response to the chaos, Trump’s administration paused tariffs for 90 days — a political move under pressure. But the damage to market psychology was already done.
10. Tax-Loss Harvesting by Smart Investors:
During the crash, savvy investors sold declining stocks like Microsoft to lock in tax deductions, then bought similar alternatives like NVIDIA to stay in the market while writing off losses.
Impact on Gold (XAU/USD) – Real-Time Validation
As of April 12, 2025, Gold (XAU/USD) is trading at:
$3,235.91 (+$60.13 for the day | +12.02% over the past month)
Let’s validate the theory with what actually happened:
1. Gold vs. Stocks and Bonds:
While Microsoft and NVIDIA were collapsing earlier this month, gold surged. This shift confirms a flight to safety — gold became the preferred hedge during equity and bond volatility.
2. Falling Dollar = Bullish for Gold:
With the dollar under pressure, gold became cheaper in foreign currencies — driving international demand and pushing prices even higher.
3. Rising Yields – But Driven by Panic:
Normally, higher yields compete with gold. But this time, yields rose because bonds were being dumped, not because of economic strength. That fear drove even more capital into gold.
4. Policy Uncertainty:
Trump’s late response and inconsistent trade policies fueled further market unease. That pushed more investors toward gold as a non-political store of value.
5. Liquidity Crunch Risk:
Some gold may have been sold during the panic to raise quick cash, but overall, the trend shows that gold held firm and then broke out even harder — a textbook crisis hedge move.
Real Example: Microsoft and NVIDIA Margin Trap
Let’s walk through the actual setup:
• An investor owns $100,000 in Microsoft (MSFT at $388.45).
• They take a $90,000 margin loan to buy NVIDIA (NVDA at $110.93).
• Early April:
• MSFT dropped below $320.
• NVDA fell under $100.
This triggers:
• Margin calls.
• Forced selling of both positions.
• Possibly even bond liquidation.
• And systemic panic across portfolios.
Result?
• Tech sold off.
• Bonds dropped.
• Yields rose.
• Dollar weakened.
• Gold exploded.
///////======//////
Impact on Gold (XAU/USD): Real Events, Real Movement
• Microsoft & NVIDIA Down: Confirmed panic in tech.
• Bond Selloff = Higher Yields: But from fear, not confidence.
• Weaker Dollar: Confirmed.
• Gold Breakout: Real.
• RSI above 70
• ADX shows trend strength
• Volume surging
• Price broke $3,200 and held
Gold moved exactly how a textbook safe haven asset should behave in this
//////======///////
XAUUSD market behavior and trader mindset:
1. Monday: Continuation After Breakout (Euphoria Phase)
Psychological Insight:
Traders and institutions are chasing momentum. After a clean breakout, FOMO kicks in, especially for those who missed the first leg. They buy pullbacks aggressively, creating a bullish Monday.
Projection: Bullish continuation
Range: 3,230 – 3,270
Bias: Buy dips
Reason: Momentum from last week’s breakout still pushing higher. RSI >70 but not topping, and no reversal pattern on daily chart. Weak USD persists.
2. Tuesday: Pullback from Overextension (Reality Check)
Psychological Insight:
Once price pushes too far, short-term traders start locking profits. This creates a dip. But smart money (institutions) sees the pullback as cheap entry — especially with no bearish reversal confirmation.
This is textbook reaccumulation psychology.
Projection: Intraday pullback, then bounce
Range: 3,250 – 3,280
Bias: Buy on VWAP pullback
Reason: Small retracement likely due to overextension. Support at VWAP (~3,219). Bullish engulfing pattern might trigger dip-buyers.
3. Wednesday: Retest / Breakout (Conviction Phase)
Psychological Insight:
After a healthy pullback and hold, traders regain confidence in the trend. Breakout traders load in here — and weak shorts get squeezed. This is where bullish conviction peaks, triggering high-volume moves.
Projection: Breakout attempt
Range: 3,265 – 3,310
Bias: Scalpers can long breakout
Reason: If momentum holds, this is likely the day gold retests highs and pushes through short-term resistance (~3,300 psychological + fib extension zone).
4. Thursday: Sideways Chop (Indecision / Distribution)
Psychological Insight:
Market participants are split. Some want to hold into the weekend; others fear a Friday sell-off.
You see hesitation, tighter ranges, and volume drop-off — classic signs of short-term indecision and distribution by early buyers.
Projection: Consolidation / Sideways
Range: 3,280 – 3,310
Bias: Neutral-to-bullish
Reason: After a breakout, price typically stalls for distribution/re-accumulation. Expect reduced volatility unless triggered by macro news (watch bond yields).
5. Friday: Final Move (Greed vs. Fear Showdown)
Psychological Insight:
End-of-week decisions are all about book-squaring. If the week was strong and the narrative holds, we get greedy breakouts into the weekend.
If uncertainty creeps in (e.g. Fed noise, geopolitical tension), profit-taking overrides conviction, leading to a dip.
Projection: Second leg breakout or profit-taking
Range: 3,270 – 3,330
Bias: Depends on Thursday’s behavior
Scenario 1: If Thursday consolidates tightly, breakout possible.
Scenario 2: If extended already, profit-taking dip possible into close.
/////=====/////
Weekly Summary:
• High probability: Gold hits $3,300 – $3,330 this week
• Support zones: $3,219 (VWAP), $3,175 (previous breakout zone)
• Resistance zones: $3,298 (fib cluster), $3,330 (round number magnet)
This projection isn’t just TA — it’s behavioral trading at its core, based on how traders actually react:
• FOMO,
• profit-protection,
• fear of reversal,
• and end-of-week positioning.
Every day’s move is driven by human emotion wrapped around market structure.

Nvidia (NASDAQ: $NVDA) Shares Rally Amid AI Sector OptimismShares of Nvidia Corporation (NASDAQ: NASDAQ:NVDA ) have gained over 3% on Friday 11th April. The positive results come after U.S. markets rallied on tariff news. President Trump announced a 90-day pause on new tariffs. Reciprocal tariffs for most countries dropped to 10%, sparking investor optimism.
Major U.S. indices rose sharply following the announcement after being under pressure from rising trade tensions. The pause was seen as a welcome shift toward calmer negotiations.
However, Trump excluded China from this relief. Instead, he stated that tariffs on Chinese goods would increase to 125%. This came after China announced new retaliatory tariffs on U.S. imports. The tough stance toward China contrasted with the softened approach to other countries.
Despite the relief, market uncertainty remains. Investors are unsure whether the rally will last. Ongoing trade disputes, especially with China, could disrupt momentum.
Nvidia's price rose to $110.78, gaining $14.99 on Friday's session. The stock reached an intraday high of $111.53 and a low of $107.48. The current resistance sits at $153.13 high.
Technical Analysis
Nvidia bounced sharply off the $92 support zone, highlighted by strong buying pressure. The RSI sits at 49, indicating neutral momentum. A clear resistance lies near $153.13 high. If Nvidia breaks this level, a move toward $180 is likely. If it fails, price may revisit the $92 zone. Two scenarios are possible. The stock could either continue upward to $180 or face rejection and fall back. Watch the $153 level closely for confirmation.

Support Zone: 106.19
Hello, traders.
If you "Follow", you can always get new information quickly.
Please click "Boost" as well.
Have a nice day today.
-------------------------------------
(NVDA Chart)
The HA-Low indicator on the 1D chart was formed at 106.19.
Therefore, the key is whether it can receive support and rise near 106.19.
-
(30m chart)
If it falls below 106.19,
1st: M-Signal indicator on 1M chart
2nd: HA-Low indicator on 30m chart
You need to check if it is supported near the 1st and 2nd above.
In order to continue the uptrend, the price must be maintained above the M-Signal indicator on the 1M chart.
-
(1D chart)
Since the HA-Low indicator on the 1D chart has been newly created, the key is whether it can be supported near this area and rise above the M-Signal indicator on the 1D chart.
If so, it is expected to turn into a short-term uptrend.
If not, there is a possibility of a stepwise downtrend, so the current position is an important section.
-
Thank you for reading to the end.
I hope your transaction will be successful.
--------------------------------------------------

PEG @ 0.22 DEBT/ASSET @ 0.09 NVIDIA LOOKS CHEAP WITH SELL-OFFFundamental metrics favour NVIDIA and with the company's return on equity (ROE) stands above 119%, NVDA stock price looks irresistible below 105.
N.B!
- NVDA price might not follow the drawn lines . Actual price movements may likely differ from the forecast.
- Let emotions and sentiments work for you
- ALWAYS Use Proper Risk Management In Your Trades
#nvda
#nasdaq
#nyse

NVIDIA (NVDA): Oversold or Start of a Larger Correction?Overview & Market Context
NVIDIA just saw a major sell-off, dropping around 7% in a single session and slicing below key support levels. This abrupt move has raised questions: Is NVDA oversold enough for a bounce, or are we at the onset of a broader bearish trend? High trading volume suggests significant institutional distribution, so caution is warranted for both bulls and bears.
1. Price Action & Volume
* NVDA closed near the $94.31 mark after the sharp decline.
* Volume spiked (~532M), confirming that large players have been active—often a sign of heightened volatility and potential trend changes.
2. Moving Averages
* The 200-day SMA sits near $127.07, which NVDA fell below decisively. Historically, losing the 200-day often signals a medium-term bearish bias, making it a key level to watch on any rebound attempts.
3. RSI & Momentum
* The RSI on the daily timeframe is hovering around the high-20s, indicating oversold conditions. While this can lead to a short-term bounce, oversold can remain oversold if negative momentum persists.
Key Levels to Watch
Immediate Resistance:
* $96–$100 Range: Minor overhead supply; if price rallies here, watch to see if it rolls over again.
* $105–$110: This region aligns with prior support-turned-resistance. A strong push above $110 would challenge the bearish thesis.
Primary Support Targets
* $90 (Psychological Marker): Could be the first zone for a pause or bounce.
* $82.89 (“Half 1 Short” from algorithmic levels): A logical next stop if the sell-off continues.
* $76 Area: Deep support from earlier consolidation zones; if selling intensifies, the stock may reach these levels.
Potential Trade Setups
1. Bearish Continuation (Short)
Entry:
* On a weak bounce into the $96–$100 zone, or
* A breakdown below $94 on strong volume.
Stop Loss:
* Conservative approach: Above $105–$110, where a bullish reversal could invalidate the short setup.
Profit Targets:
* $90 (near-term psychological level),
* $82.89 (algorithmic short target),
* $76 (longer-term support).
2. Contrarian Bounce (Long)
* Entry: Around $90 or upon a clear intraday reversal signal (e.g., a bullish engulfing candle on strong volume).
* Stop Loss: Below $88 to reduce risk of a deeper flush.
* Profit Targets:
* $96–$100 (short-term push),
* Extended target near $105–$110 if momentum sharply reverses.
Thought Process & Strategy
* The extreme volume and steep decline reflect a high-conviction move. Usually, when you see volume spikes on a breakdown, it suggests institutional selling, meaning rallies may be met with further supply.
* However, the oversold reading (RSI in the high-20s) hints that a bounce might come soon—though it could be short-lived unless macro or fundamental conditions shift.
* Clearly defining both bullish and bearish scenarios—along with exact stop-loss levels—removes emotion and helps avoid “decision paralysis.” Trading is about probabilities, not certainties.
Final Notes
* Risk Management: Always size positions so that a single trade does not jeopardize your account.
* Emotional Control: These levels are algorithmically defined, aiming to reduce subjective bias. Watch how price reacts at each support/resistance zone.
* Stay Vigilant: With elevated volatility, rapid intraday swings are possible. Monitor real-time price action for confirmation.
Disclaimer: This is not financial advice. Perform your own due diligence, and trade responsibly.

Microsoft Regains Top Spot as Most Valuable Company Microsoft Corp. (NASDAQ: NASDAQ:MSFT ) has reclaimed its place as the world’s most valuable public company. The tech giant now holds a market capitalization of $2.64 trillion, surpassing Apple Inc. (NASDAQ: NASDAQ:AAPL ), which fell to $2.59 trillion.
Apple’s sharp decline followed a major 23% sell-off over four days. This came after President Trump announced sweeping new tariffs. These tariffs hit countries like China, India, Vietnam, and Brazil. Apple’s heavy reliance on these regions for manufacturing intensified investor concerns.
Meanwhile, Microsoft appears less exposed to tariff risks. Analysts say the company remains a stable large-cap stock during ongoing market volatility. Microsoft previously held the top spot briefly last year but was overtaken by Apple and Nvidia (NASDAQ: NASDAQ:NVDA ), now ranked third at $2.35 trillion.
Technical Analysis
Microsoft’s stock is trading at $383.15, up 8.06%, with a high of $387.07 so far today. The price rebounded sharply from the support level near $345. This zone had previously acted as resistance in late 2021 and early 2022. It now serves as strong support. The volume spike confirms buyer interest at this level.
The projected path shows a potential bounce toward $468, the recent high. If the trend holds, Microsoft may attempt a new all-time high.

NVIDIA: Still has a long way to go.NVIDIA turned from oversold to neutral on its 1D technical outlook (RSI = 48.969, MACD = 44.021, ADX = 44.021) and is about to do the same on 1W too, as today's 90-day tariff pause announcement is giving the market an aggressive comeback. Technically though that doesn't seem enough to restore the tremendous bullish sentiment of 2023 and 1st half of 2024 as the trend is currently restricted by not only the 1D MA50 and MA200 but a LH trendline also coming straight from the ATH.
The same kind of LH kept NVDA at bay on its last main correction to the August 5th 2024 bottom. This started a +44.46% rally that got rejected on the LH trendline. If we apply that today we get a projected 1D MA200 test just under the LH trendline. A TP = 125.00 fits perfectly on the short term, but long term we still have a long way to go.
## If you like our free content follow our profile to get more daily ideas. ##
## Comments and likes are greatly appreciated. ##

We’ve seen a solid correction in NVDA - Bullish?We’ve seen a solid correction in NVDA following its rally since early 2024. The stock has broken through key levels and managed to hold within the resistance zone between $80 and $90. We will most likely enter a sideways movement until the situation regarding tariffs becomes clearer. This could extend into June, after which we might expect an upward move toward the $132.95 zone. By early 2026, we are likely to see a new all-time high, especially if the trade tensions and tariffs between China and the US are resolved and overall uncertainty decreases.

NVDA TO $176 BY JUNE THEN $1000 END OF YEARNVDA to $176 by June Then $1000 End of Year: A Bold Thesis
Key Points
It seems likely that NVDA could reach $176 by June 2025, supported by strong AI market trends and upcoming earnings, but reaching $1000 by year-end is highly speculative and controversial.
Research suggests Elliott Wave analysis shows a potential bullish trend, but specific price targets like $1000 lack broad analyst support.
The evidence leans toward significant growth potential due to NVDA's leadership in AI and new product launches, yet such aggressive targets involve high uncertainty.
Current Price and Market Context
As of April 9, 2025, NVDA's closing price on April 8 was $96.30, with pre-market trading at $98.22. This reflects recent volatility, with a 52-week range from $75.61 to $153.13. The stock's performance is tied to its dominance in AI and GPU markets, which are experiencing robust growth.
Analysis for $176 by June
Reaching $176 by June 2025, an 83% increase from $96.30, is ambitious but plausible. Upcoming earnings on May 28, 2025, estimate an EPS of $0.93 and revenue of $43.34 billion, with potential beats driving price surges. Elliott Wave analysis suggests NVDA may be completing a corrective phase, with a falling wedge pattern indicating a possible upward breakout, supporting short-term targets around $176.
Analysis for $1000 by Year-End
The prediction of $1000 by December 2025, a 940% increase, is highly speculative. While some analyses, like a Forbes article, suggest NVDA could see a tenfold rise by 2026 due to the Blackwell architecture, most analyst targets range from $170 to $235. This target lacks broad support and involves significant market and fundamental risks.
Unexpected Detail: Stock Split Impact
An unexpected factor is NVDA's 10-for-1 stock split in June 2024, adjusting prices from over $1,000 to current levels, making historical comparisons complex. This split aligns the $1000 target with post-split valuations, but achieving it requires unprecedented growth.
Survey Note: Detailed Analysis of NVDA's Potential Price Surge to $176 by June and $1000 by Year-End
Introduction
NVIDIA Corporation (NVDA), a leader in graphics processing units (GPUs) and artificial intelligence (AI), is currently trading at approximately $96.30 as of April 9, 2025, based on the closing price from April 8, with pre-market activity showing a slight uptick to $98.22. This analysis explores the feasibility of NVDA reaching $176 by June 2025 and an ambitious $1000 by the end of the year, leveraging Elliott Wave theory and other validated analytical methods. Given the stock's recent performance and market context, we examine technical patterns, fundamental catalysts, and long-term growth potential.
Current Market Position and Historical Context
NVDA's stock has shown volatility, with a 52-week range from $75.61 to $153.13, and a year-to-date change of -11.36% over the past week and -12.23% over the past month, per recent data. The all-time high was $153.13 on January 6, 2025, indicating significant upside potential from current levels. The market capitalization stands at $2.35 trillion, with a beta of 2.40, reflecting high volatility. Key financial metrics include an EBITDA of $83.32 billion and an EBITDA margin of 63.85%, underscoring strong profitability.
A critical context is the 10-for-1 stock split in June 2024, which adjusted share prices from over $1,000 to current levels, making historical comparisons complex. This split, detailed in a CNBC article (Nvidia announces 10-for-1 stock split), was aimed at making ownership more accessible, aligning with the user's post-split price targets of $176 and $1000.
Metric Value
Closing Price (Apr 8) $96.30 USD
Pre-Market Price (Apr 9) $98.22 USD
52-Week Range $75.61 - $153.13 USD
Market Cap $2.35T USD
Beta (1Y) 2.40
Earnings Next Report May 28, 2025, EPS Estimate $0.93, Revenue Estimate $43.34B USD
Last Quarter EPS $0.89 (estimated $0.85, +4.96% surprise)
Dividend Yield (TTM) 0.04%
Elliott Wave Analysis: Technical Insights
Elliott Wave theory, a method identifying market psychology through wave patterns, suggests NVDA may be in a corrective phase, potentially completing wave (4) of a larger five-wave structure. Recent analyses, such as those on TradingView (NVIDIA Stock Chart), indicate a falling wedge or ending diagonal formation, often signaling a reversal and start of an upward trend. This could support a move to $176 by June, as wave (5) projections often extend to 1.618 times wave (1), potentially aligning with such targets.
Specific Elliott Wave analyses, like those from ElliottWave-Forecast (Elliott Wave Expects New All Time High), suggest NVDA has completed corrections and is resuming higher, with wave counts indicating impulsive rallies. However, these analyses lack explicit price targets reaching $1000, focusing more on trend continuations.
Short-Term Target: $176 by June 2025
Reaching $176 by June 2025, an 83% increase from $96.30, is ambitious but supported by several factors. The earnings report on May 28, 2025, is a critical catalyst, with estimates for EPS at $0.93 and revenue at $43.34 billion. Given NVDA's history of beating estimates, as seen in the last quarter with EPS of $0.89 against an estimate of $0.85, a strong report could drive significant price appreciation.
Technical indicators, such as a breakout from the falling wedge, align with this target. Analyst price targets, ranging from $125 to $220 with an average of $177.19 per Zacks (NVIDIA Price Target), also support the possibility, with some forecasts reaching $235.92 (NVDA Forecast). However, achieving this in two months requires sustained bullish momentum and favorable market conditions.
Long-Term Target: $1000 by Year-End 2025
The prediction of $1000 by December 2025, a 940% increase from current levels, is highly speculative. Most analyst forecasts, such as those from MarketBeat (NVIDIA Stock Forecast) and TipRanks (Nvidia Stock Forecast), range from $170 to $235, far below $1000. However, a Forbes article from May 25, 2024 (Nvidia Stock Tops $1,000), suggests NVDA could see a tenfold rise by 2026 due to the Blackwell architecture, potentially supporting a $1000 target by late 2025 if growth accelerates.
Blackwell, a new GPU architecture, is expected to enhance NVDA's AI and data center offerings, potentially driving revenue growth. CoinCodex forecasts a high of $260.32 by December 2025 (NVIDIA Stock Forecast), still below $1000, indicating the target is outlier and involves significant risk. Market volatility, competition, and macroeconomic factors, such as tariff impacts noted in CNN reports (NVDA Stock Quote), add uncertainty.
Fundamental Catalysts and Risks
NVDA's fundamentals are strong, with consistent revenue growth and high EBITDA margins. The company's expansion into AI, autonomous systems, and supercomputers, as noted in LiteFinance (Nvidia Stock Price Prediction), supports long-term growth. However, short-term corrections due to overvaluation or market sentiment, especially around tariff concerns, pose risks.
X posts, such as one from @1000xStocks (X post), highlight NVDA's EPS growth reflecting AI monetization, suggesting bullish sentiment, but lack specific $1000 targets. Another from @ravisRealm (X post) notes adding positions at lower prices, indicating confidence but not supporting the $1000 target.
Conclusion
While reaching $176 by June 2025 is plausible with strong earnings and technical breakouts, the $1000 target by year-end is highly speculative, lacking broad analyst support and requiring unprecedented growth. Investors should monitor earnings reports, product launches like Blackwell, and market trends, while employing risk management strategies given the high uncertainty.

TSLA Best Level to BUY/HOLD 100% bounce🔸Hello traders, today let's review daily chart for TSLA. we are
looking at a 67% correction, almost complete now, another 67%
recent correction presented on the right.
🔸Most of the bad news already price in and we are getting
oversold, expecting a bottom in weeks now not months.
🔸Recommended strategy bulls: BUY/HOLD once 67% correction
completes at/near strong horizontal S/R 140/150 USD, TP bulls
is 280/300 USD, which is 100% unleveraged gain.
**Tesla (TSLA) Market Update – April 9, 2025**
📉 **Stock Decline:** TSLA closed at $221.86, down 4.9%, amid new tariffs and CEO Elon Musk's political involvement
**Analyst Downgrades:*
Wedbush's Dan Ives cut the price target by 43% to $315, citing a "brand crisis"
Wells Fargo's Colin Langan set a target at $130, anticipating a potential 50% drop
📊 **Delivery Shortfall:** Q1 deliveries fell 13% year-over-year to 336,000 vehicles, missing expectations by about 40,000 unis.
🌍 **Tariff Impact:** President Trump's new tariffs are expected to increase costs and disrupt Tesla's supply chain, especially concerning Chinese operatins.
💡 **Investor Sentiment:** Analysts express concern over Musk's political ties affecting Tesla's brand and sales, particularly in China.

NVIDIA: Time for a Graphic Comeback?🔍Analysis:
Following up from a previous breakdown, NVIDIA has now tapped into a high-probability Weekly Order Block (OB) just above the sell-side liquidity zone at $88.97. This level also aligns with a structural area of support, making it a prime zone for a potential bullish reversal.
Key signs:
Price is showing early signs of displacement from the OB.
If this zone holds, we could be looking at a 77% move back up to the buyside liquidity at $157.92.
Watch for a strong weekly candle close above $96.30 to confirm the bounce.
🛑 Invalidation:
If price fails to hold this OB and breaks below $88.97, expect a deeper move into the $76.06 zone.
💡 Summary:
Patience is key. We’re sitting on a solid base for a potential bullish push — now it’s all about the confirmation candle. 📊
DYOR — Don't just HODL, study the chart!

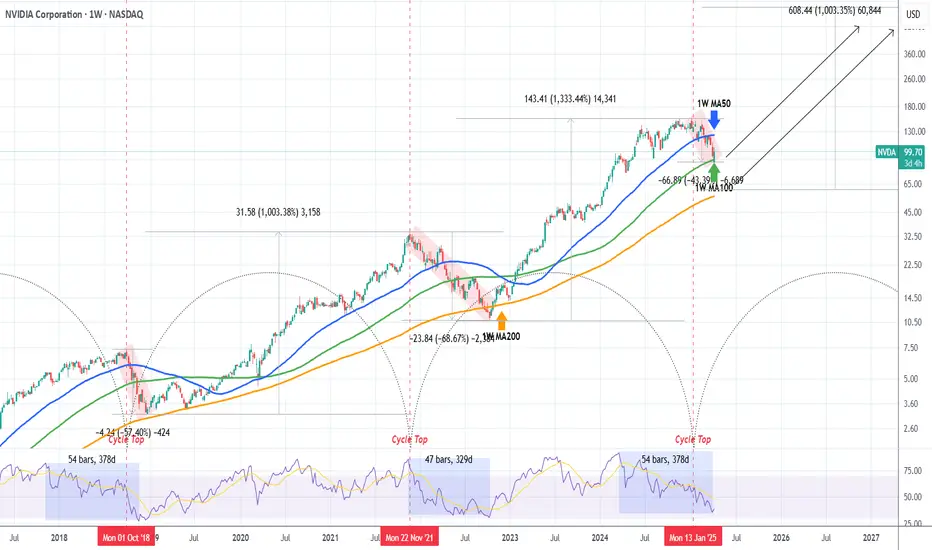
NVIDIA on Bear Market territory. Will the 1W MA100 save the day?NVIDIA Corporation (NVDA) has officially entered Bear Market territory as it has declined by almost -45% from the January 2025 All Time High (ATH) and just hit its 1W MA100 (green trend-line) for the first time since the week of January 30 2023.
This is the strongest correction the stock has seen since the 2022 Inflation Crisis and based on the Time Cycle Indicator of the last two Cycle Tops, the week of Jan 06 2025 falls indeed on the third count. This high degree of symmetry isn't only present on the price action but on the 1W RSI sequence itself as the current time range from the RSI High (March 18 2024) to today's Low is fairly consistent (54 weeks, 378 days) with the top-to-bottom range of the previous two Bear Markets, 2022 and 2018 (red Channel Down patterns).
So far the current correction looks similar to the September - December 2018 as not only their RSI counts are similar but both are more aggressive and fast than the 2022 Inflation Crisis. The 2018 correction though didn't top on the 1W MA100 but almost reached the 1W MA200 (orange trend-line) before making a bottom, but it did so in less than 2 months and declined by -57.40%. The current correction is already running for 3 months.
So what remains to be seen is if the 1W MA100 will manage to hold and kick-start a bullish reversal on its own, despite this correction being 'only' -43.39%. The 1W RSI dropped close enough to 30.00 (the oversold limit) though, which has historically been a very reliable indicator for a long-term buy on NVDA.
If those work in favor of the 1W MA100 holding, expect to see a strong rebound, that will confirm the new Bull Cycle with a break above the 1W MA50 (blue trend-line) and can technically aim for at least a +1000% rise from the bottom, as both previous Bull Cycles did.
If the 1W MA100 fails, we expect a bottom by the end of June 2025 around the 1W MA200 between $65-60. Again a +1000% rise from that level is technically plausible, potentially giving a Target estimate of at least $660.
-------------------------------------------------------------------------------
** Please LIKE 👍, FOLLOW ✅, SHARE 🙌 and COMMENT ✍ if you enjoy this idea! Also share your ideas and charts in the comments section below! This is best way to keep it relevant, support us, keep the content here free and allow the idea to reach as many people as possible. **
-------------------------------------------------------------------------------
💸💸💸💸💸💸
👇 👇 👇 👇 👇 👇