Nvidia Long Off Support? NVIDIA
Short Term - We look to Buy at 211.77 (stop at 202.40)
Preferred trade is to buy on dips. We are trading at oversold extremes. We look for a temporary move higher. Although the anticipated move higher is corrective, it does offer ample risk/reward today.
Our profit targets will be 240.26 and 284.00
Resistance: 250.00 / 300.00 / 340.00
Support: 210.00 / 190.00 / 160.00
Disclaimer – Saxo Bank Group. Please be reminded – you alone are responsible for your trading – both gains and losses. There is a very high degree of risk involved in trading. The technical analysis, like any and all indicators, strategies, columns, articles and other features accessible on/though this site (including those from Signal Centre) are for informational purposes only and should not be construed as investment advice by you. Such technical analysis are believed to be obtained from sources believed to be reliable, but not warrant their respective completeness or accuracy, or warrant any results from the use of the information. Your use of the technical analysis, as would also your use of any and all mentioned indicators, strategies, columns, articles and all other features, is entirely at your own risk and it is your sole responsibility to evaluate the accuracy, completeness and usefulness (including suitability) of the information. You should assess the risk of any trade with your financial adviser and make your own independent decision(s) regarding any tradable products which may be the subject matter of the technical analysis or any of the said indicators, strategies, columns, articles and all other features.
Please also be reminded that if despite the above, any of the said technical analysis (or any of the said indicators, strategies, columns, articles and other features accessible on/through this site) is found to be advisory or a recommendation; and not merely informational in nature, the same is in any event provided with the intention of being for general circulation and availability only. As such it is not intended to and does not form part of any offer or recommendation directed at you specifically, or have any regard to the investment objectives, financial situation or needs of yourself or any other specific person. Before committing to a trade or investment therefore, please seek advice from a financial or other professional adviser regarding the suitability of the product for you and (where available) read the relevant product offer/description documents, including the risk disclosures. If you do not wish to seek such financial advice, please still exercise your mind and consider carefully whether the product is suitable for you because you alone remain responsible for your trading – both gains and losses.
Nvda_analysis

$NVDA**$NVDA** off the 4hr chart we are looking like another super banger. I will look to take position here after we pop in the am sometime 264.84... So if you have DT capabilities you can start with a quick scalp from the current position and grab this 4-5pt move. Then grab the some short action into a possible swing for one of those high percentage performers! Target 248 and then possible runners at 240 and 230.
LONG TO SHORT OR JUST WAIT FOR THE SHORT

NVDA triple bottom on the 1hrNVDA with a massive triple bottom on the 1hr , also the last time the MACD was this low and about to cross we jumped from 210ish to 270 in 7 days.
Both RSI and Stoch are heavily oversold and are about to fly back to the upside. Assuming we are beginning to consolidate while using a fib ext we could see a bounce up to the 300 to 320 mark in the coming days, weeks, to say the least I am super bullish on NVDA right now. With ongoing semi conductor shortages clogging up the market I only see prices on things like gpus to rise, this will reflect very well on the balance sheet and will allow a lot more industry volume to funnel right into the hands of the giants like NVDA...

NVDA, We are moving in up trendHello guys
According to the chart you can see the price is moving downward trend and it has need more correction to have good R/r then we have permission to take short position until the target.
You should take signal at first then dont forget use stop loss and observe to your capital management.
Take a look on volume guys dont forget to check it, And dont forget to risk free and manage your position.
Everything is shown on chart, If you have question send us messages
Good Luck
Abtin

Longs on $NVDA over $270!Huge resistance test coming up here on NVDA. Earnings will likely be the catalyst for either direction
Plan is to take longs on a hold over $270, every $10 up will be profit taking levels

NVDA Breakout!Looks like we finally have a nice breakout on NVDA. Today we broke trend resistance with above average volume and held over the 200SMA
Being one of the strongest stocks in the market NVDA could see some serious upside if the market decides to rally.
Every $10 will be key levels to wait for a dip and start buying. We could see upwards of $280

All $NVDA Targets hit! We posted prior about this nice NVDA breakout.
We mentioned we saw resistance every $10 in order to buy dips and that has pretty much played out as we thought.
Next large level is $300 but we'll be waiting for a larger dip to size in again

NVDA levels 3/29Looking at chip leader tomorrow for sure. I have levels here for upside and where it needs to protect to the downside. Looks like we are headed to that $300 number.

NVDA Giant Sideways Cup and HandleGiant structure on the weekly chart for Nvidia
200MA touched early in the cups formation and late in the handles formation
Price since this formation has long gone up, the trend on timeframes like these is your friends, NVDA is very bullish

NVDA Buy area got Filled If you haven`t seen my last article about the Buy Area:
Then you should know that Nvidia and Intel might join forces to end Chip Shortage!
In this case, my sell area for NVDA is above the $307 resistance!
Looking forward to read your opinion about it.

NVDA Wick RejectionChart Event: Wick Rejection of 38.2% Fib Retracement Level
Confluence: NVDA is sitting on top of a volume shelf with strong bullish order flow. Strong bullish divergence on lower timeframes.
Trade Idea: Above $272 I see continued upside, first target would be 50% fib level at $276.48 and second would be 61.8% fib level at $293. Below $260 I believe we should see a retracement to $246. I lean bearish on this stock in the short term despite the order flow and the wick rejection because there is deeply bearish order flow on the major indices, which are also experiencing hidden bearish divergence. Long term I am very bullish on NVDA, but I do not believe the price action can continue an upward trend without a slight pullback.
Contract Idea:
+65m break of $272: 4/1/22 275C. Currently at $5.25 but will be more by the time the call level triggers.
+65m break of $260: 4/1/22 250P. Currently at $4.00.

SOXL and NVDA: Trade of the Week Coming?SOXL and NVDA, if timed right, could be a monster play for options traders this week. Watch the video for possible levels and possible ideas!

NVDA: Descending Triangle Break NVIDIA - Short Term - We look to Sell at 206.22 (stop at 217.69)
Further downside is expected, however, due to the strong support below we prefer to sell a break of 210.00, which will confirm the bearish sentiment. Closed below the 20-day EMA. Short term oscillators have turned negative. Follow through bearish momentum from 346.00 resulted in net losses.
Our profit targets will be 165.54 and 137.15
Resistance: 250.00 / 270.00 / 285.00
Support: 210.00 / 200.00 / 190.00
Disclaimer – Saxo Bank Group. Please be reminded – you alone are responsible for your trading – both gains and losses. There is a very high degree of risk involved in trading. The technical analysis, like any and all indicators, strategies, columns, articles and other features accessible on/though this site (including those from Signal Centre) are for informational purposes only and should not be construed as investment advice by you. Such technical analysis are believed to be obtained from sources believed to be reliable, but not warrant their respective completeness or accuracy, or warrant any results from the use of the information. Your use of the technical analysis, as would also your use of any and all mentioned indicators, strategies, columns, articles and all other features, is entirely at your own risk and it is your sole responsibility to evaluate the accuracy, completeness and usefulness (including suitability) of the information. You should assess the risk of any trade with your financial adviser and make your own independent decision(s) regarding any tradable products which may be the subject matter of the technical analysis or any of the said indicators, strategies, columns, articles and all other features.
Please also be reminded that if despite the above, any of the said technical analysis (or any of the said indicators, strategies, columns, articles and other features accessible on/through this site) is found to be advisory or a recommendation; and not merely informational in nature, the same is in any event provided with the intention of being for general circulation and availability only. As such it is not intended to and does not form part of any offer or recommendation directed at you specifically, or have any regard to the investment objectives, financial situation or needs of yourself or any other specific person. Before committing to a trade or investment therefore, please seek advice from a financial or other professional adviser regarding the suitability of the product for you and (where available) read the relevant product offer/description documents, including the risk disclosures. If you do not wish to seek such financial advice, please still exercise your mind and consider carefully whether the product is suitable for you because you alone remain responsible for your trading – both gains and losses.

NVDA downtrending to complete elliotEntry: 153
Target: 250
Invalidation: 128 ( I will not be putting invalidation level on my trade, since it's a strong company we should see a gain in price in a long term)
Pattern: 1-5 Elliot wave and full ABC correction, now we are wating for market to complete Elliot wave downwards and complete wxy combination. We should break the head and shoulders pattern, break in the right shoulder and retrace upwards to it and go back down to our demand zone where is our entry point.
Aroon: Shows gain in bearish momentum
Macd: Shows gain in bearish momentum
Fib zone: We are waiting for price to retrace to 61.8% fib zone (Reversal zone) and retrace to 50% fib zone (Target zone)

NVDA Short at Resistance SetupNVIDIA - Short Term - We look to Sell at 251.38 (stop at 266.57)
We look to sell rallies. 50 1day EMA is at 248.00. Trend line resistance is located at 252.00. Short term oscillators have turned negative. The daily chart technicals suggests further upside before the downtrend returns. Further downside is expected although we prefer to set shorts at our bespoke resistance levels at 250.00, resulting in improved risk/reward.
Our profit targets will be 210.70 and 201.15
Resistance: 250.00 / 270.00 / 285.00
Support: 210.00 / 200.00 / 190.00
Disclaimer – Saxo Bank Group. Please be reminded – you alone are responsible for your trading – both gains and losses. There is a very high degree of risk involved in trading. The technical analysis, like any and all indicators, strategies, columns, articles and other features accessible on/though this site (including those from Signal Centre) are for informational purposes only and should not be construed as investment advice by you. Such technical analysis are believed to be obtained from sources believed to be reliable, but not warrant their respective completeness or accuracy, or warrant any results from the use of the information. Your use of the technical analysis, as would also your use of any and all mentioned indicators, strategies, columns, articles and all other features, is entirely at your own risk and it is your sole responsibility to evaluate the accuracy, completeness and usefulness (including suitability) of the information. You should assess the risk of any trade with your financial adviser and make your own independent decision(s) regarding any tradable products which may be the subject matter of the technical analysis or any of the said indicators, strategies, columns, articles and all other features.
Please also be reminded that if despite the above, any of the said technical analysis (or any of the said indicators, strategies, columns, articles and other features accessible on/through this site) is found to be advisory or a recommendation; and not merely informational in nature, the same is in any event provided with the intention of being for general circulation and availability only. As such it is not intended to and does not form part of any offer or recommendation directed at you specifically, or have any regard to the investment objectives, financial situation or needs of yourself or any other specific person. Before committing to a trade or investment therefore, please seek advice from a financial or other professional adviser regarding the suitability of the product for you and (where available) read the relevant product offer/description documents, including the risk disclosures. If you do not wish to seek such financial advice, please still exercise your mind and consider carefully whether the product is suitable for you because you alone remain responsible for your trading – both gains and losses.

NVDA: Down to 200 then BOOMNVDA is finishing up the final leg of its correction. 200 will be an attractive place to go long before NVDA begins its ascent back to new ATHs.

NVDA Buy AreaI`ve noticed that from time to time NVDA does some intraday retracements from which it recovers.
If you want to buy the sell-off wicks, you can put buy orders between $198 and $215.
In this choppy market there are chances for NVDA to hit the support areas more often before going up again.
Looking forward to read your opinion about it.

NVIDIA to Sell-off? NVIDIA - Short Term - We look to Sell at 269.00 (stop at 291.43)
We look to sell rallies. Previous resistance located at 270.00. Previous support located at 210.00. Trading within a Bearish Channel formation. The daily chart technicals suggests further upside before the downtrend returns. Further downside is expected although we prefer to set shorts at our bespoke resistance levels at 270.00, resulting in improved risk/reward.
Our profit targets will be 211.24 and 201.15
Resistance: 270.00 / 285.00 / 330.00
Support: 210.00 / 200.00 / 190.00
Disclaimer – Saxo Bank Group. Please be reminded – you alone are responsible for your trading – both gains and losses. There is a very high degree of risk involved in trading. The technical analysis, like any and all indicators, strategies, columns, articles and other features accessible on/though this site (including those from Signal Centre) are for informational purposes only and should not be construed as investment advice by you. Such technical analysis are believed to be obtained from sources believed to be reliable, but not warrant their respective completeness or accuracy, or warrant any results from the use of the information. Your use of the technical analysis, as would also your use of any and all mentioned indicators, strategies, columns, articles and all other features, is entirely at your own risk and it is your sole responsibility to evaluate the accuracy, completeness and usefulness (including suitability) of the information. You should assess the risk of any trade with your financial adviser and make your own independent decision(s) regarding any tradable products which may be the subject matter of the technical analysis or any of the said indicators, strategies, columns, articles and all other features.
Please also be reminded that if despite the above, any of the said technical analysis (or any of the said indicators, strategies, columns, articles and other features accessible on/through this site) is found to be advisory or a recommendation; and not merely informational in nature, the same is in any event provided with the intention of being for general circulation and availability only. As such it is not intended to and does not form part of any offer or recommendation directed at you specifically, or have any regard to the investment objectives, financial situation or needs of yourself or any other specific person. Before committing to a trade or investment therefore, please seek advice from a financial or other professional adviser regarding the suitability of the product for you and (where available) read the relevant product offer/description documents, including the risk disclosures. If you do not wish to seek such financial advice, please still exercise your mind and consider carefully whether the product is suitable for you because you alone remain responsible for your trading – both gains and losses.

$NVDA Watching closelyWe are in a different market now. We, as traders, must adapt in order to keep our business running. Brace yourself for a new era & a new beginning.
PUT thesis 💰 made me good money.
I still have a little bias that this would fail around this area. With Russia-Ukraine war, I don’t think NATO wouldn’t just sit there and look. It's going to be a headline driven market
Looking at VIX. Above 29-30+ = PUT
Below it would be choppy
below 27 I will enter long position.
Give the trade a time, 2-3 weeks out so theta wouldn’t eat your premiums.

NVDA PUT ThesisWith a close & hold above 274 we will see upside and possible NATHs. But with the current market right now: the Russia - Ukraine conflict, the inflation, and March right around the corner, I don't see the upside. But I see more reason for MMs and short to ride this with the media, on the downside.
Below 230, I see downside to 200
What are your thoughts?

NVIDA: Heading to 200Hello friends, here is a fresh NVDA update. The structure has become quite clear. NVDA should be heading to the 190-210 region. I find it most probable that it will bottom at 200, because that is where the .5 fib retracement lies from this larger degree move. After this, it should move towards 400+ through the rest of the year. Good luck traders :)

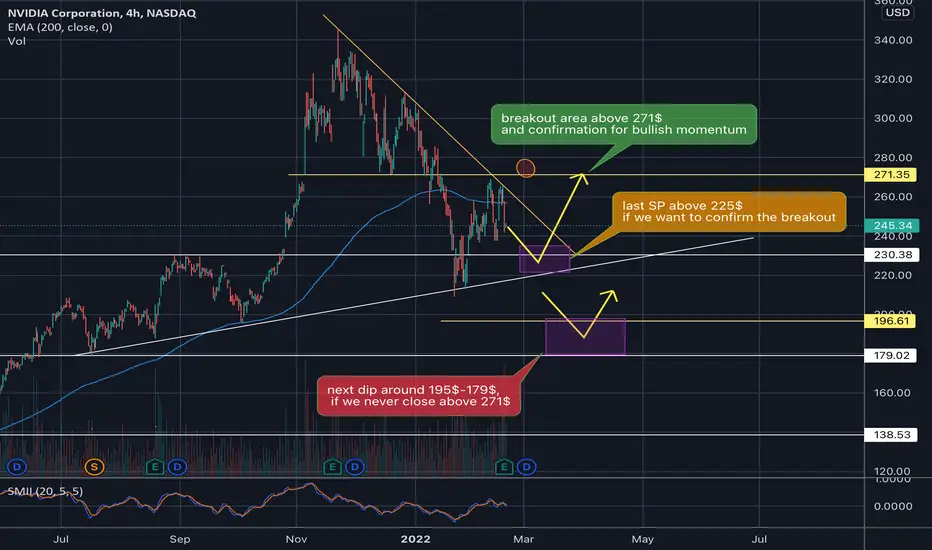
$NVDA price breakout targetwe will see a turning point for our price action , when we close 1h candle this time above 271$, other wise we will see the price drop to accumulate above the 225$, and hold above this support then retest the 271$ , to see a break out above the 300$.
if we didn't hold above our support this time above the 225$, we going to see a price going down near our next support above the 179$.
a bonus in TradingView coins (up to 30$)
tiny.one
NVDA: Back up the truck at 230The structure for NVDA is becoming more clear. It looks like we have one final low to make to about the 230 region to fill the gap. At that juncture, I will "back up the truck". Very bullish setup moving forward.
