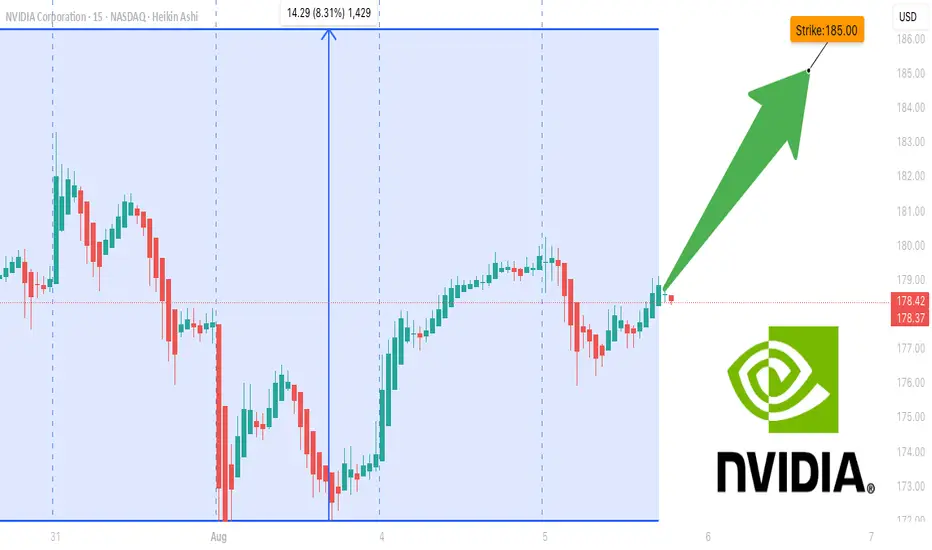
NVDA Don’t Miss Out## ⚡ NVDA Swing Setup (2025-08-08) ⚡
**Bias:** 📈 **Moderate Bullish** — RSI hot (67), trend up, low VIX, but volume still meh.
**🎯 Trade Plan**
* **Ticker:** \ NASDAQ:NVDA
* **Type:** CALL (LONG)
* **Strike:** \$185.00
* **Entry:** \$3.15 (near open)
* **Profit Target:** \$4.65 (+48%)
* **Stop Loss:** \$2.13 (-30%)
* **Expiry:** 2025-08-22 (14DTE)
* **Size:** 1 contract
* **Confidence:** 75%
**📊 Key Notes**
* RSI strong = momentum on your side ✅
* VIX favorable for calls ✅
* Weak volume & neutral flow = confirm before adding size ⚠️
* Watch breakout above **\$183.88** for momentum kick
**💡 Play Idea:**
Ride momentum to \$195+, take 50% profits at \$4.65, trail stops to lock gains.
Nvdaprediction

Nvidia - This is clearly not the end!📐Nvidia ( NASDAQ:NVDA ) will confirm the breakout:
🔎Analysis summary:
Over the past couple of months, Nvidia managed to rally about +100%, reaching top 1 of total market cap. Most of the time such bullish momentum just continues and new all time highs will follow. But in order for that to happen, Nvidia has to confirm the all time high breakout now.
📝Levels to watch:
$150
🙏🏻#LONGTERMVISION
SwingTraderPhil

NVDA Don't Miss Out !!!!
**NVDA \$185C Weekly Momentum Surge ⚡ All Models Aligned – 75% Confidence Setup 🔥**
---
### 📊 **Post Body (Optimized for TradingView):**
**NVDA Weekly Call Play — Aug 8 Expiry (3 DTE) 🔥**
📈 **Momentum Snapshot:**
* **Weekly RSI:** 🔼 Above 50 and climbing
* **Daily RSI:** 🔻 Falling — short-term caution
* **Volume:** 1.2x previous week (🟢 Institutional flow)
* **Volatility (VIX):** <22 — favorable setup
* **Gamma Risk:** 🟠 Moderate
---
🧠 **Model Scorecard Summary:**
* **Grok / xAI:** 4/5 Bullish 🟢
* **Gemini (Google):** 3/5 Bullish with 80% confidence 🟢
* **Claude (Anthropic):** 5/5 Bullish 💯
* **LLaMA (Meta):** 4/5 Bullish 💪
* **DeepSeek:** 5/5 Bullish 🚀
✅ **Consensus:** Strong Bullish 🔥
---
### 💡 **Trade Setup:**
* 🎯 **Strategy:** Long CALL
* 🟢 **Strike:** \$185
* 📅 **Expiry:** Aug 8, 2025
* 💵 **Entry Price:** \$0.96
* 📈 **Target Exit:** \$1.90 (100% gain)
* 🛑 **Stop Loss:** \$0.48 (50% risk cap)
* 📏 **Size:** 1 contract
* ⏰ **Timing:** Market Open
* 📊 **Confidence Level:** 75%
---
⚠️ **Key Risks to Watch:**
* Time decay – Only 3 DTE ⏳
* Daily RSI divergence 😬
* Gamma risk & market volatility (track \ TVC:VIX )
---
### 🧾 **Auto-Logger JSON (for tracking):**
```json
{
"instrument": "NVDA",
"direction": "call",
"strike": 185.00,
"expiry": "2025-08-08",
"confidence": 0.75,
"profit_target": 1.90,
"stop_loss": 0.48,
"size": 1,
"entry_price": 0.96,
"entry_timing": "open",
"signal_publish_time": "2025-08-05 09:43:22 UTC-04:00"
}
```
---
### 🏷️ **Suggested Hashtags (TradingView Style):**
`#NVDA #OptionsTrading #WeeklyOptions #CallOptions #MomentumStocks #AIStocks #TechLeaders #TradingSetup #RSISignal #GammaSqueeze #NVIDIA #OptionAlert #HighConviction #TradeIdeas #TechBreakout`
Nvidia - This is clearly not the end!📐Nvidia ( NASDAQ:NVDA ) will simply rally more:
🔎Analysis summary:
Yes, over the past couple of months, Nvidia has been rallying another +100%. But looking at the higher timeframe, this is still not the end of the unbelievable bullrun. Following the rising channel pattern, Nvidia can rally another +20% before we might see a potential retracement.
📝Levels to watch:
$250
SwingTraderPhil
SwingTrading.Simplified. | Investing.Simplified. | #LONGTERMVISION

NVDA Weekly Trade Setup (2025-08-02)
### 🟢 NVDA Weekly Trade Setup (2025-08-02)
🚀 **BULLISH CONSENSUS** across 5 top-tier models
📉 Daily RSI: Weak — but weekly trend is STRONG
💼 Institutional Volume: Confirmed accumulation
📊 Options Flow: Call/Put leaning bullish
---
### 🎯 TRADE SETUP
**💥 Direction:** CALL (LONG)
**📍 Strike:** \$182.50
**📅 Expiry:** 2025-08-08
**💵 Entry:** \$0.73
**🎯 Target:** \$1.46 (100% gain)
**🛑 Stop:** \$0.36 (50% risk cap)
**✅ Confidence:** 75%
**🕒 Entry Timing:** At market open
---
### 🧠 Model Breakdown:
✅ **Grok/xAI:** Weekly bullish, 4/5 signals green
✅ **DeepSeek:** Volume confirms; cautious on daily RSI
✅ **Google/Gemini:** Bullish weekly > bearish daily
✅ **Claude:** Weekly momentum + rising options flow
✅ **Meta/Llama:** All signals aligned for \$182.50 call
---
### ⚠️ Risk Watch:
* Falling Daily RSI = short-term drag risk
* Key Support: Watch for \$178 breakdown
* Earnings/events could spike volatility
---
### 📦 TRADE JSON (for tracking):
```json
{
"instrument": "NVDA",
"direction": "call",
"strike": 182.50,
"expiry": "2025-08-08",
"confidence": 0.75,
"profit_target": 1.46,
"stop_loss": 0.36,
"size": 1,
"entry_price": 0.73,
"entry_timing": "open",
"signal_publish_time": "2025-08-03 00:54:05 UTC-04:00"
}
```
---
🔥 *“Smart money is circling. Ride the wave, not the noise.”*
💬 Drop your thoughts below. Will NVDA break \$185 next week?

NVDA Bullish Weekly Trade Setup** – 2025-07-29
📈 **NVDA Bullish Weekly Trade Setup** – 2025-07-29
🚀 *"Momentum meets money flow!"*
### 🔍 Market Snapshot:
* 💥 **Call/Put Ratio**: 2.47 → Bullish sentiment confirmed
* 🧠 **RSI**: Rising on Daily & Weekly → Momentum building
* 🔕 **Low VIX**: Favors call strategies (cheap premiums)
* ⚠️ **Caution**: Light volume = soft institutional backing
---
### 🔧 Recommended Options Trade:
**🟢 NVDA \$182.50 CALL (Exp: Aug 1)**
💰 *Entry*: \~\$0.53 (Mid)
📈 *Profit Target*: \$0.69 – \$1.06
🛑 *Stop Loss*: \$0.32
📆 *DTE*: 3 days
🔄 *Entry Timing*: Market Open
✅ *Confidence*: 75%
🔥 *Theta & Gamma Risk*: Elevated — manage position size!
---
### 💡 Why This Trade?
✅ RSI Strength across timeframes
✅ Flow favors upside
✅ Cheap premium in a low-volatility regime
🟡 Just watch that volume…
---
📊 **TRADE SNAPSHOT (JSON):**
```json
{
"instrument": "NVDA",
"direction": "call",
"strike": 182.50,
"expiry": "2025-08-01",
"confidence": 0.75,
"profit_target": 1.06,
"stop_loss": 0.32,
"size": 10,
"entry_price": 0.53,
"entry_timing": "open",
"signal_publish_time": "2025-07-29 11:59:10 UTC-04:00"
}
```
---
📣 **Taglines for Sharing:**
* "NVDA setup is 🔥—momentum + flow = GO!"
* "Gamma risk is real—but so is this profit window 💸"
* "Short-term sprint or fade? This call has range."

NVDA 0DTE TRADE SIGNAL – JULY 25, 2025
⚡ NVDA 0DTE TRADE SIGNAL – JULY 25, 2025 ⚡
🚀 Strong Bullish Momentum – But Friday Expiration = Gamma Trap?
⸻
📊 Market Stats:
• 💰 Call Volume: Strong
• 🔻 Weak Volume Overall
• ⚖️ Call/Put Ratio: Bullish
• 📈 RSI: Overbought but still pushing
• ⏳ Time Decay: Accelerating
• ☠️ Gamma Risk: 🔥 MAX today (0DTE)
⸻
🧠 Model Summary:
• Grok/xAI: 🔒 NO TRADE today – wait for Monday
• Claude: 🛑 Caution – avoid entries today
• DeepSeek: ⏸️ 4/5 Bullish, wait for cleaner setup
• Gemini: 💡 Suggests $180C next week
• Llama: ✅ Bullish bias, but gamma risk = no go for Friday
⸻
📌 TRADE IDEA: Wait for Monday
📍 Strike: $175 Call
📆 Expiry: Today (0DTE)
💵 Entry Price: $0.56
🎯 Target: $0.95
🛑 Stop: $0.30
📈 Confidence: 65%
🕒 Entry Timing: Monday open IF support holds
⸻
⚠️ Key Warning:
Don’t get trapped by 0DTE gamma swings. Momentum says yes, time decay says no…
✅ Best move? Watch NVDA closely, then strike on Monday if volume confirms.
⸻
👍 Like & save if you’re tracking NVDA.
🔁 Repost if you’re waiting for the perfect Monday setup!
#NVDA #OptionsTrading #0DTE #GammaRisk #BullishSetup #TradingView #TechStocks #WeeklyOptions

$NVDA WEEKLY TRADE IDEA – JULY 21, 2025
💥 NASDAQ:NVDA WEEKLY TRADE IDEA – JULY 21, 2025 💥
🔥 Bullish Options Flow + Weekly RSI Strength = Controlled Momentum Play
⸻
📊 Trade Details
🔹 Type: Long Call
🎯 Strike: $180.00
📆 Expiry: July 25, 2025 (4DTE)
💰 Entry: $0.51
🎯 Target: $1.02 (💯% Gain)
🛑 Stop: $0.20 (~40% Risk)
📈 Confidence: 65%
🕰️ Timing: Monday Open
📦 Size: 1 Contract (Adjust based on risk tolerance)
⸻
📈 Why This Trade?
✅ Call/Put Ratio = 1.48 → Bullish bias confirmed
📈 Weekly RSI = 77.0 → Strong momentum
🔻 Daily RSI = 80.8 (falling) → Short-term pullback risk
📉 Volume = flat (1.0x) → Weak confirmation = tighter risk mgmt
🧠 Strike Clustering: $177.50 & $180 = strong OI zones
🌬️ VIX = 16.7 → Favorable for long premium plays
⸻
⚠️ Risks & Strategy Notes
❗ Daily RSI = caution: short-term exhaustion possible
📉 Weak volume = lack of institutional chase
⏳ Exit before Friday – avoid IV crush and gamma slam
🔐 Set alerts at $178.75 and $179.80 – pre-breakout signals
⸻
🎯 Plan:
• Enter Monday open
• Scale partials if price hits +30–50%
• Full exit by Thursday unless price is breaking through $180 early with strong volume
⸻
🏁 Quick Verdict:
This is a momentum continuation setup, not a fresh breakout.
Play the trend, respect RSI signals, and cut fast if flow dries up.
NASDAQ:NVDA 180C — Risk $0.20 to Target $1.02
Let the call ride… just don’t overstay.
⸻
#NVDA #OptionsTrading #CallOption #WeeklyPlay #MomentumTrade #FlowBasedSetup #TradingViewIdeas #GammaPlay #BullishBias #NVIDIA

NVIDIA Robbery Plan: Bullish Swing Trade to Millions!🔥 NVIDIA (NVDA) Stock Heist Blueprint: Unlock Bullish Profits with Thief Trading Style! 🚀💰
🌟 Greetings, Wealth Warriors! 🌟
Hello, Ciao, Salaam, Bonjour, Hola, and Hallo to all you savvy traders and market masterminds! 🤑💸 Get ready to execute a high-octane trading plan with our Thief Trading Style—a bold fusion of technical precision and fundamental insights designed to crack the NVIDIA (NVDA) stock market vault! 💥📈
📝 The NVIDIA Heist Plan: Swing & Day Trading Mastery 🏆
Based on our proprietary Thief Trading Style, this plan targets NVIDIA (NVDA), currently riding a bullish wave fueled by strong fundamentals and technical setups. Follow the strategy outlined below to navigate the high-risk Red Zone—where overbought conditions, consolidation, and potential trend reversals create opportunities for sharp traders. 💪 Stay alert, as bearish players may set traps at key levels! 🕵️♂️
Entry Strategy: Crack the 🙂Vault! 🏦
Go long with confidence! The market is primed for a bullish breakout. Enter at current prices or set buy limit orders near recent swing lows/highs on the 15-minute or 30-minute timeframe. 📅
Pro Tip: Set price alerts on your chart to catch the optimal entry. Timing is everything in this heist! ⏰
Swing Traders: Look for pullbacks to key support levels for safer entries.
Scalpers: Focus on quick long-side trades with tight stops to maximize gains. 💨
Stop Loss: Protect Your Loot! 🔒
Place your stop loss (SL) below the recent swing low on the 30-minute timeframe (e.g., $162.00 for swing trades).
Adjust your SL based on your risk tolerance, position size, and number of orders. For larger accounts, consider tighter stops to lock in gains early. 🛡️
Scalpers: Use a trailing stop to secure profits while riding short-term momentum.
Take Profit Target: Cash Out Big! 💰
Aim for $191.00 as the primary target, or exit early if momentum slows.
Swing Traders: Hold for the full target if the trend remains strong.
Scalpers: Grab quick profits on smaller price spikes and re-enter on dips.
Pro Move: Use a trailing stop to let profits run while safeguarding gains. 🚀
📌Key Levels & Risk Management
Entry Zone: Market price or swing low – ideal for long positions. 📈
Stop Loss: $162.00 – based on 30m timeframe swing low. 🛑
Take Profit Target: $191.00 – primary target for swing/day trades. 🎯
Risky Red Zone: Overbought levels – watch for consolidation or reversal traps. ⚠️
💡 Why NVIDIA? The Bullish Case 📡
NVIDIA (NVDA) is powering through a bullish phase, driven by:
Fundamentals: Strong demand for AI, gaming, and data center chips. 📊
Macro Factors: Positive market sentiment and tech sector momentum. 🌍
COT Data (Latest Friday Update, UTC+1): Large speculators are increasing bullish positions, signaling confidence in NVDA’s upside (data sourced from reliable platforms). 📅
Geopolitical & News: Monitor upcoming earnings and industry developments for catalysts. 📰
Intermarket Analysis: Tech-heavy indices like the NASDAQ are trending higher, supporting NVDA’s rally. 📈
For a deeper dive, check fundamental reports, COT data, and sentiment analysis to align your trades with the bigger picture. 🔍
⚠️ Trading Alert: Navigate News & Volatility 🗞️
News releases can spark sharp price swings. To protect your capital:
Avoid new trades during major news events (e.g., earnings or Fed announcements). 🚫
Use trailing stops to lock in profits and limit downside risk. 🔐
Stay updated with real-time market developments to adjust your strategy dynamically. 📡
🚀 Boost the Heist! Support the Thief Trading Community 🤝
Love this plan? Hit the Boost Button to amplify our Thief Trading Style and empower our community to conquer the markets! 💥 Every like and share fuels our mission to make money with precision and style. 💪 Join us daily to unlock more high-profit heist plans! 🏴☠️
📌 Important Disclaimer
This analysis is for educational purposes only and not personalized investment advice. Always conduct your own research, assess your risk tolerance, and verify market conditions before trading. Markets move fast—stay sharp and adapt! ⚡
🌟 Stay tuned for the next heist plan, traders! Let’s keep stealing profits together! 🤑🐱👤🎉

$NVDA - $270 PT in BULL ChannelThe stock is currently bouncing off of the lower channel line of the rising Bull Channel. Price action has created a Cup and Handle. The projected Price Objective sits at around $270. Remember, the height of the cup is the project target which from current stock price extends to around $270.

Nvidia - New all time highs!Nvidia - NASDAQ:NVDA - breaks out now:
(click chart above to see the in depth analysis👆🏻)
Within two and a half months, Nvidia rallied more than +70%. Following this recent bullish strength, a retest of the previous highs was totally expected. But this does not seem to be the end at all. There is a much higher chance that we will see new all time highs soon.
Levels to watch: $150
Keep your long term vision🙏🙏
Philip (BasicTrading)

NVDA Analysis To 164?Quick breakdown of NVDA
Appears we hit our corrected level, we could go deeper possibly or hold at this level and drive up to 164
This is looking like a nice little setup long indeed
Trade Smarter Live Better
Kris/Mindbloome Exchange

My buy view for NVDAMy buy view for NVDA.
Nvidia has made a significant push up after the meltdown following the new US tariff news.
The push-up is likely cooling off for this baby.
If the current consolidation continues to be sustained by the support zone (TL) in this zone, we are likely to see NVDA rally to $149 and $152 as TP1 and TP2, respectively.
My SL will be around $128.9 zone for both.
RR of 1:4 and 1:4.8
Trade with care

Is NVDA Building Strength Before a Breakout?After cooling off from its $150 highs, NVIDIA (NVDA) is consolidating in the $140–$145 zone. While some traders fear the AI hype has peaked, others see this as the calm before another rally. With solid fundamentals, continued leadership in AI, and strong institutional backing, NVDA remains a name to watch closely.
🎯 Trade Setup:
Entry Points
✅ $142 – Current price zone (speculative buy)
✅ $135–$130 – Strong support (ideal swing entry)
✅ $125 (only if market-wide pullback occurs)
Profit Targets
📈 TP1: $149 – All-time high retest
🚀 TP2: $160 – Extension target
💰 TP3: $175+ – Long-term bullish scenario if momentum returns
💡 Strategy: This is a “buy-the-dip, trade-the-breakout” setup. Wait for confirmation above $146 if you're conservative, or accumulate gradually into weakness with a clear risk plan.
📌 Disclaimer: This is not financial advice. Always do your own research and use proper risk management. I'm sharing my personal view for educational purposes.

Fundamental and technical analysis on NVDA (Chicken Nugget) soonFundamental Analysis
NVIDIA Corporation (NVDA) remains a key player in the tech sector, benefiting from the rise of artificial intelligence, data centers, and gaming. With sustained growth, constant innovation, and strong demand for its graphics chips, the company continues to deliver solid financial results.
Recent reports indicate revenue growth and expansion in key markets. Product diversification, particularly in supercomputers and embedded systems, strengthens NVDA’s position against competitors. Investor interest in the semiconductor industry helps maintain the stock’s positive momentum.
Technical Analysis
The chart analysis highlights key technical levels for investors:
- Key Resistance: $150 USD – This level must be broken to confirm a strong bullish trend. A breakout with volume could signal a gradual rise toward higher targets.
- Support Level: $131.50 USD – Strong demand and low supply are identified at this level, making it an excellent entry point for investors looking for buying opportunities before a potential rebound.
Targets & Strategy
- Short-term target (late June/early July): The target range of $170-$175 USD is possible if the bullish trend is confirmed. This level aligns with technical extensions and favorable market dynamics.
- July buyback (-5% to -10%): A moderate correction could occur, offering another buying opportunity before an upward recovery.
- Selling target (September to November): The next selling target is between $200-$240 USD, depending on market developments and investor sentiment.
Conclusion
NVDA stock presents interesting prospects, with well-defined technical levels and a strong fundamental outlook. Investors should monitor these thresholds to adjust their strategy based on market fluctuations.
If you want to refine this analysis or explore other scenarios, I'm here to dive deeper into key points! 🚀 Subscribe! TSXGanG
I hold a CCVM and MNC (Certificate of Competence to become a securities broker anywhere in Canada) and have been working as a trader for five years.
It’s a pleasure for me to help people optimize their trading strategies and make informed financial market decisions.

NVDA Weekly Options Outlook — June 1, 2025📉 NVDA Weekly Options Outlook — June 1, 2025
🚨 AI Model Consensus: Lean Bearish Into 6/6 Expiry
🧠 Model Breakdown
🔹 Grok (xAI)
Bias: Short-term bullish (above 10/50 EMA on M5), but below 200 EMA.
Indicators: RSI ~63, MACD weakening on daily.
Sentiment: Falling VIX + AI buzz, but $133 max pain caps upside.
Trade: Buy $141C @ ~$0.94 → Target +50%, SL 50%
Confidence: 70%
🔹 Claude (Anthropic)
Bias: Slightly bullish.
Indicators: Price above 10EMA, below 200EMA; MACD weak, RSI neutral.
Sentiment: Call/put OI split, max pain $133.
Trade: Buy $140C @ $0.96 → Target +55–75%, SL $0.50
Confidence: 72%
🔹 Gemini (Google)
Bias: Bearish.
Indicators: Bearish MACD crossover; upper Bollinger rejection.
Sentiment: Positive news priced in.
Trade: Buy $128P @ $0.73 → Target +75–100%, SL 50%
Confidence: 65%
🔹 Llama (Meta)
Bias: Moderately bearish.
Indicators: MACD fading; under EMAs on M5.
Trade: Buy $133P → Target +50%, SL above $136.35
Confidence: 70%
🔹 DeepSeek
Bias: Bearish.
Indicators: MACD bearish crossover; momentum fading.
Trade: Buy $132P @ $1.65 → Target +100%, SL 50%
Confidence: 65%
✅ Consensus Takeaways
🎯 Max Pain: $133 is the focal level across all models.
🟢 VIX down; sentiment positive, but momentum fading.
📉 Daily MACD across models turning bearish.
⚠️ Bullish calls (Grok/Claude) vs. bearish puts (Gemini/Llama/DeepSeek).
🔍 Recommended Trade This Week
💡 Bearish Play: NVDA Weekly Put (Exp: 2025-06-06)
💵 Entry: $1.66
🎯 Target: $2.49 (+50%)
🛑 Stop: $0.83 (−50%)
🔢 Size: 1 contract
⏰ Entry Timing: Market open (Monday)
📈 Confidence: 65%
⚠️ Risks to Watch
🚀 AI catalyst could reverse thesis and rally price fast
⏳ Time decay will eat premium—move needed early
🕳️ Opening gaps could get filled fast—use limit orders
🔄 Max pain ≠ magnetic level—watch price action around $133 closely
📊 TRADE DETAILS (JSON)
json
Copy
Edit
{
"instrument": "NVDA",
"direction": "put",
"strike": 132.0,
"expiry": "2025-06-06",
"confidence": 0.65,
"profit_target": 2.49,
"stop_loss": 0.83,
"size": 1,
"entry_price": 1.66,
"entry_timing": "open",
"signal_publish_time": "2025-06-02 09:30:00 UTC-04:00"
}

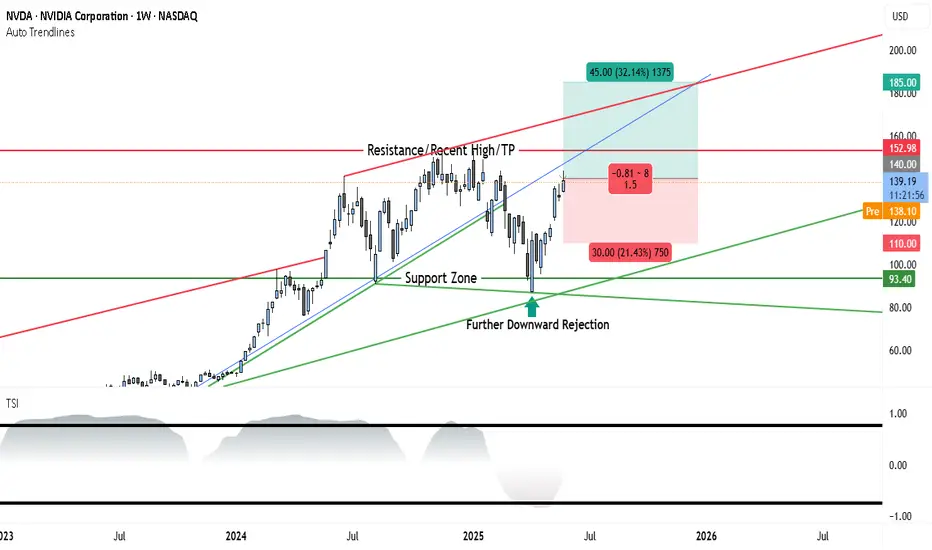
NVIDIA Stock Weekly Outlook: Support Holds Strong as $185 TargetThe weekly chart of NVDA shows a strong continuation pattern forming after a period of consolidation and a healthy pullback. The recent price action confirms a bullish stance, with a fresh bounce off support and momentum gradually shifting in favor of the bulls.
________________________________________
Long-Term Uptrend Confirmed
The blue ascending trendline drawn from early 2023 remains intact, showing that the overall trend is still bullish. NVDA has respected this trendline multiple times, with each touch followed by a renewed upward move. This week, the price rebounded once again near this trendline, confirming its role as dynamic support and signaling renewed buying interest.
________________________________________
Resistance and Breakout Potential
The key resistance level is marked at $152.98, which represents the recent weekly high and a psychological barrier. This level has acted as a ceiling in past attempts, but the current structure and momentum suggest a potential breakout if volume confirms. Above this level, there's clear air up to $185, where the next major resistance sits, and which also acts as the projected target in this trade setup.
________________________________________
Support Holding Strong
A strong support zone around $93.40 is clearly defined and has already triggered multiple rejections. NVDA recently saw a sharp bounce from this zone after a downward rejection, signaling that institutional buyers may be active here. This area is the foundation of the current bullish case.
________________________________________
Momentum Turning Favorably
The True Strength Index (TSI), shown at the bottom of the chart, is emerging from a low region. While not yet fully bullish, the indicator is starting to turn upward, suggesting early signs of momentum building. If TSI crosses above the midline in coming weeks, it could confirm the start of a sustained upward move.
________________________________________
Trade Setup
• Entry Zone: $138 to $140 (current price range)
• Stop-Loss: $110 (beneath the last significant swing low)
• Target: $185 (aligns with the next major resistance and top of risk-reward box)
• Risk-Reward Ratio: Approximately 1.5:1
• Setup Bias: Swing to mid-term bullish continuation
________________________________________
Conclusion
NVIDIA’s weekly chart is aligning in favor of the bulls after a healthy consolidation and support retest. The price remains within a strong uptrend channel, and momentum is gradually improving. A breakout above $152.98 would likely attract more volume and set the stage for a rally toward $185. The risk-reward setup is favorable, making this a strong candidate for bullish swing positioning heading into Q3 2025.
NVDA Weekly Options Trade Plan 2025-05-25NVDA Weekly Analysis Summary (2025-05-25)
Model Summaries Grok/xAI: Mixed technical signals—bullish on daily, bearish on 5-minute; neutral overall; no trade recommended (55% confidence). Claude/Anthropic: Moderately bearish; recommends buying the $128 put at ~$3.60 for a 50–100% profit target; confidence 72%. Llama/Meta: Moderately bearish but views premium/risk as unfavorable for buying; instead suggests selling the $130 put; confidence 70%. Gemini/Google: Strong intraday bearish technicals and negative sentiment; recommends buying the $120 put at ~$1.24 as a day trade; confidence 65%. DeepSeek: Moderately bearish but sees premiums >$1 as too rich; no trade recommended (55% confidence). Areas of Agreement and Disagreement Agreement: • Overall moderately bearish bias for NVDA into weekly expiry. • Rising VIX, max-pain near $126, and negative news support downside. Disagreement: • Trade/no-trade: Grok and DeepSeek pass, Claude, Gemini and Llama propose trades. • Strike selection: Claude prefers $128 put; Gemini $120 put; Llama sells $130 put. • Strategy type: All bearish ideas are buy puts except Llama, which suggests naked put selling. Conclusion Overall Market Direction: Moderately Bearish for the week ending 2025-05-30. Recommended Trade: Buy a weekly put to capture the expected pull toward the $126 max-pain level. • Instrument: NVDA 2025-05-30 $128 Put • Entry Timing: At market open • Entry Price: $3.65 (ask) • Profit Target: $5.48 (≈50% gain ⇒ midpoint sell or scale) • Stop Loss: $2.56 (≈30% loss) • Size: 1 contract Confidence Level: 70% Key Risks and Considerations: • Intraday oversold conditions could trigger a short-term bounce. • Theta decay accelerates late in the week—need timely exit. • Holiday-shortened week may damp momentum. • Liquidity is good at the $128 strike but bid-ask spread and slippage can impact execution.
TRADE_DETAILS (JSON Format)
{ "instrument": "NVDA", "direction": "put", "strike": 128.0, "expiry": "2025-05-30", "confidence": 0.70, "profit_target": 5.48, "stop_loss": 2.56, "size": 1, "entry_price": 3.65, "entry_timing": "open", "signal_publish_time": "2025-05-25 10:57:51 UTC-04:00" } 📊 TRADE DETAILS 📊 🎯 Instrument: NVDA 🔀 Direction: PUT (SHORT) 🎯 Strike: 128.00 💵 Entry Price: 3.65 🎯 Profit Target: 5.48 🛑 Stop Loss: 2.56 📅 Expiry: 2025-05-30 📏 Size: 1 📈 Confidence: 70% ⏰ Entry Timing: open 🕒 Signal Time: 2025-05-25 10:58:05 EDT
Disclaimer: This newsletter is not trading or investment advice but for general informational purposes only. This newsletter represents my personal opinions based on proprietary research which I am sharing publicly as my personal blog. Futures, stocks, and options trading of any kind involves a lot of risk. No guarantee of any profit whatsoever is made. In fact, you may lose everything you have. So be very careful. I guarantee no profit whatsoever, You assume the entire cost and risk of any trading or investing activities you choose to undertake. You are solely responsible for making your own investment decisions. Owners/authors of this newsletter, its representatives, its principals, its moderators, and its members, are NOT registered as securities broker-dealers or investment advisors either with the U.S. Securities and Exchange Commission, CFTC, or with any other securities/regulatory authority. Consult with a registered investment advisor, broker-dealer, and/or financial advisor. By reading and using this newsletter or any of my publications, you are agreeing to these terms. Any screenshots used here are courtesy of TradingView. I am just an end user with no affiliations with them. Information and quotes shared in this blog can be 100% wrong. Markets are risky and can go to 0 at any time. Furthermore, you will not share or copy any content in this blog as it is the authors' IP. By reading this blog, you accept these terms of conditions and acknowledge I am sharing this blog as my personal trading journal, nothing more.

NVDA Still a Monster, But I’m Not Chasing It Just YetNVIDIA is sitting around $135.57 right now, and yeah—fundamentally, it’s crushing it. Revenue growth is off the charts (over 114% YoY) and the data center segment alone pulled in $35B+ last quarter. AI is the fuel, and NVDA is the engine.
That said… we’re getting into overheated territory.
Technically, price is way above its 50/100/200 EMAs, and the RSI is up in the 70s, so we’re clearly in overbought land. Can it push higher? Sure. But I’m not a fan of chasing candles when the chart is screaming “cooldown incoming.”
If we get any weakness or macro jitters (tariffs, earnings nerves, etc.), I’ll be watching for potential entries in the $125–98zone. If we drop into that range with strong volume reaction, I’ll start scaling in.
On the geopolitical front: yeah, the FWB:15B impact from U.S.–China restrictions isn’t nothing—but NVDA’s already moving to offset that with partnerships (like the Saudi AI deal). This isn’t a company sitting still.
📌 Bottom Line:
Long-term, I’m bullish. Short-term, I’m cautious. I’d rather miss a little upside than buy the top and get trapped in a pullback. Let the trade come to you.
Disclaimer: This isn’t financial advice—just sharing my own playbook. Always do your own research and manage risk accordingly.

$NVDA: Full on Bull mode. 170 $ before end of Summer Happy Monday. A new week, new trade for you guys. How does the largest AI stock looks like today with US-China Tariff pause for 90 days behave? Today the stock NASDAQ:NVDA broke the 1.0 Upward sloping Fib retracement channel with which we have been working for months now. The stock opened @ 122 % which is the 1.0 Fib retracement level. If we extend the channel and extrapolate then we see the next levels and the resistance levels.
In our Fib Chart here the next level is 1.6 Level which is @ 137 $. In my opinion with RSI at 50 and NASDAQ:NVDA having some high level of short interest. 1.12 % of the float is short which is high going back to 2021 bear market. So, this helps have violent short covering rally in the short term. Bullish before we turn bearish. RSI may top out at 85 in this bull rally phase. This cycle bull r un can take it to 170$ before end of Summer 2025.
Verdict : NASDAQ:NVDA next levels : 135 $ ; cycle top @ 170 $.

NVDA Trade Setup Eyeing the Bounce After the PullbackNVIDIA (NVDA) is currently trading around $117.06, pulling back from its recent highs of $153.13. With volatility kicking in and macro pressure (including renewed tariff talk from the Trump camp), NVDA is setting up for what could be a powerful rebound opportunity.
Here’s how I’m looking at it:
📥 Buy Zones (Scaling In):
$104 – Technical support zone where buyers may start stepping in.
$95 – Key psychological and chart-based support.
$90–$80 – Deep correction zone for high-conviction entries.
🎯 Profit Targets:
TP1: $125 – Strong short-term resistance.
TP2: $145 – Reclaiming mid-term momentum.
TP3: $153+ – All-time high retest if sentiment recovers.
💡 Why It Matters:
NVIDIA’s fundamentals are on fire: strong revenue, record margins, and leadership in AI and data center growth. Add in $25B+ in cash and minimal debt, and you've got a long-term juggernaut. Yes, it's volatile. Yes, it's overvalued on paper. But growth like this doesn’t come cheap.
📊 Risk Management:
Always use stops—especially in this kind of market. I’m keeping an eye on $90 as a make-or-break level and adjusting sizing to weather volatility.
Disclaimer: This is not financial advice. All trading involves risk. Do your own research or speak to a licensed financial advisor before making any financial decisions.

My buy view for NVDAMy buy view for NVDA.
If positive fundamentals continue to outweigh bad news, we are likely to see NVDA push further up towards $120, $130, $140, and then its previous peak of $150.
Trade with care if you are day trading, but this baby is still selling at discount in my view

NVDA Weekly Options Trade Plan 2025-05-07NVDA Weekly Analysis Summary (2025-05-07)
Model Summaries
Grok/xAI Report
Technicals: Price $117.06 above all key EMAs; bullish MACD on 5-min and daily; RSI overbought short-term (75) but neutral daily (59); trading near upper Bollinger Bands. Sentiment: VIX elevated at 24.76; mixed news (AI rally vs. supply delays); max pain at $111 suggests some bearish undertone. Direction: Moderately bullish with caution for pullback. Trade: Buy naked $113 put (premium $0.59) anticipating pullback, stop if $119 breach, target 25–50% gain, 65% confidence.
Claude/Anthropic Report
Technicals: Strong intraday uptrend; bullish MACD and RSI neutral daily; immediate resistance at $117.68. Sentiment: Sector tailwinds, positive news, but VIX elevated and max pain at $111. Direction: Moderately bullish. Trade: Buy $121 call at $0.75, profit target 100% ($1.50), stop-loss 40% ($0.45), 65% confidence.
Llama/Meta Report
Technicals: Bullish MACD, overbought short-term RSI, mixed reversal risk. Sentiment: Mixed news; VIX rising; max pain theory. Direction: Moderately bullish but immediate entry risky—overbought, mixed signals. Trade: No trade recommended at open (confidence <60%).
DeepSeek Report
Technicals: Bullish breakout, expanding bands, RSI overbought M5 but room on daily. Sentiment: Positive AI policy news; VIX manageable; max pain unlikely to derail strong technicals. Direction: Strongly bullish (70% confidence). Trade: Buy $122 call at $0.56, target $1.12, stop if $115.86 break, size 3–5% of capital.
Gemini/Google Report
Technicals: Strong uptrend but very overbought short-term. Sentiment: Mixed news with supply concerns; VIX rising; max pain $111 adds caution. Direction: Neutral/unclear for immediate trade (confidence <60%). Trade: No trade recommended at market open. Areas of Agreement and Disagreement
Agreements
All models see a strong intraday and daily uptrend with price above key EMAs and bullish MACD. Short-term RSI is overbought, suggesting potential for pullback or consolidation. VIX is elevated (~24.8), signaling caution. Max pain at $111 introduces a bearish tether toward expiration.
Disagreements
Trade selection: Grok favors a bearish put; Claude, DeepSeek favor bullish calls; Llama and Gemini hold off. Confidence: DeepSeek is most bullish (70%), Grok and Claude are moderately bullish (65%), Llama and Gemini see too many conflicting signals for immediate action. Strike selection varies widely: $113 put, $121 call, $122 call, or no trade. Conclusion
Overall Market Direction Consensus: Moderately bullish for the week, with elevated short-term risk of pullback.
Recommended Trade
Strategy: Single-leg naked call Instrument: NVDA weekly options (expiry 2025-05-09) Strike: $122.00 Call Premium: ~ $0.56 Entry Timing: At market open Profit Target: $1.12 (100% gain) Stop-Loss: $0.34 (40% loss) Confidence: 70%
Key Risks and Considerations
M5 RSI overbought (75) risks a short-term pullback. Elevated/rising VIX may induce whipsaws. Max pain suggests potential downward drift into expiration. Monitor any fresh supply-chain or sector news at open.
TRADE_DETAILS (JSON Format)
{ "instrument": "NVDA", "direction": "call", "strike": 122.0, "expiry": "2025-05-09", "confidence": 0.70, "profit_target": 1.12, "stop_loss": 0.34, "size": 1, "entry_price": 0.56, "entry_timing": "open", "signal_publish_time": "2025-05-07 20:16:47 UTC-04:00" }
Disclaimer: This newsletter is not trading or investment advice but for general informational purposes only. This newsletter represents my personal opinions based on proprietary research which I am sharing publicly as my personal blog. Futures, stocks, and options trading of any kind involves a lot of risk. No guarantee of any profit whatsoever is made. In fact, you may lose everything you have. So be very careful. I guarantee no profit whatsoever, You assume the entire cost and risk of any trading or investing activities you choose to undertake. You are solely responsible for making your own investment decisions. Owners/authors of this newsletter, its representatives, its principals, its moderators, and its members, are NOT registered as securities broker-dealers or investment advisors either with the U.S. Securities and Exchange Commission, CFTC, or with any other securities/regulatory authority. Consult with a registered investment advisor, broker-dealer, and/or financial advisor. By reading and using this newsletter or any of my publications, you are agreeing to these terms. Any screenshots used here are courtesy of TradingView. I am just an end user with no affiliations with them. Information and quotes shared in this blog can be 100% wrong. Markets are risky and can go to 0 at any time. Furthermore, you will not share or copy any content in this blog as it is the authors' IP. By reading this blog, you accept these terms of conditions and acknowledge I am sharing this blog as my personal trading journal, nothing more.
