NVIDIA Robbery Plan: Bullish Swing Trade to Millions!🔥 NVIDIA (NVDA) Stock Heist Blueprint: Unlock Bullish Profits with Thief Trading Style! 🚀💰
🌟 Greetings, Wealth Warriors! 🌟
Hello, Ciao, Salaam, Bonjour, Hola, and Hallo to all you savvy traders and market masterminds! 🤑💸 Get ready to execute a high-octane trading plan with our Thief Trading Style—a bold fusion of technical precision and fundamental insights designed to crack the NVIDIA (NVDA) stock market vault! 💥📈
📝 The NVIDIA Heist Plan: Swing & Day Trading Mastery 🏆
Based on our proprietary Thief Trading Style, this plan targets NVIDIA (NVDA), currently riding a bullish wave fueled by strong fundamentals and technical setups. Follow the strategy outlined below to navigate the high-risk Red Zone—where overbought conditions, consolidation, and potential trend reversals create opportunities for sharp traders. 💪 Stay alert, as bearish players may set traps at key levels! 🕵️♂️
Entry Strategy: Crack the 🙂Vault! 🏦
Go long with confidence! The market is primed for a bullish breakout. Enter at current prices or set buy limit orders near recent swing lows/highs on the 15-minute or 30-minute timeframe. 📅
Pro Tip: Set price alerts on your chart to catch the optimal entry. Timing is everything in this heist! ⏰
Swing Traders: Look for pullbacks to key support levels for safer entries.
Scalpers: Focus on quick long-side trades with tight stops to maximize gains. 💨
Stop Loss: Protect Your Loot! 🔒
Place your stop loss (SL) below the recent swing low on the 30-minute timeframe (e.g., $162.00 for swing trades).
Adjust your SL based on your risk tolerance, position size, and number of orders. For larger accounts, consider tighter stops to lock in gains early. 🛡️
Scalpers: Use a trailing stop to secure profits while riding short-term momentum.
Take Profit Target: Cash Out Big! 💰
Aim for $191.00 as the primary target, or exit early if momentum slows.
Swing Traders: Hold for the full target if the trend remains strong.
Scalpers: Grab quick profits on smaller price spikes and re-enter on dips.
Pro Move: Use a trailing stop to let profits run while safeguarding gains. 🚀
📌Key Levels & Risk Management
Entry Zone: Market price or swing low – ideal for long positions. 📈
Stop Loss: $162.00 – based on 30m timeframe swing low. 🛑
Take Profit Target: $191.00 – primary target for swing/day trades. 🎯
Risky Red Zone: Overbought levels – watch for consolidation or reversal traps. ⚠️
💡 Why NVIDIA? The Bullish Case 📡
NVIDIA (NVDA) is powering through a bullish phase, driven by:
Fundamentals: Strong demand for AI, gaming, and data center chips. 📊
Macro Factors: Positive market sentiment and tech sector momentum. 🌍
COT Data (Latest Friday Update, UTC+1): Large speculators are increasing bullish positions, signaling confidence in NVDA’s upside (data sourced from reliable platforms). 📅
Geopolitical & News: Monitor upcoming earnings and industry developments for catalysts. 📰
Intermarket Analysis: Tech-heavy indices like the NASDAQ are trending higher, supporting NVDA’s rally. 📈
For a deeper dive, check fundamental reports, COT data, and sentiment analysis to align your trades with the bigger picture. 🔍
⚠️ Trading Alert: Navigate News & Volatility 🗞️
News releases can spark sharp price swings. To protect your capital:
Avoid new trades during major news events (e.g., earnings or Fed announcements). 🚫
Use trailing stops to lock in profits and limit downside risk. 🔐
Stay updated with real-time market developments to adjust your strategy dynamically. 📡
🚀 Boost the Heist! Support the Thief Trading Community 🤝
Love this plan? Hit the Boost Button to amplify our Thief Trading Style and empower our community to conquer the markets! 💥 Every like and share fuels our mission to make money with precision and style. 💪 Join us daily to unlock more high-profit heist plans! 🏴☠️
📌 Important Disclaimer
This analysis is for educational purposes only and not personalized investment advice. Always conduct your own research, assess your risk tolerance, and verify market conditions before trading. Markets move fast—stay sharp and adapt! ⚡
🌟 Stay tuned for the next heist plan, traders! Let’s keep stealing profits together! 🤑🐱👤🎉
Nvdatrading

Nvidia (NVDA) Share Price Surges Above $170Nvidia (NVDA) Share Price Surges Above $170
Yesterday, Nvidia’s (NVDA) share price rose by more than 4%, with the following developments:
→ It surpassed the psychological level of $170 per share;
→ Reached another all-time high;
→ Gained more than 9% since the beginning of the month.
The bullish sentiment is driven by Nvidia CEO Jensen Huang’s visit to China shortly after meeting with US President Trump. At the same time:
→ US Secretary of Commerce Howard Lutnick stated that the planned resumption of sales of Nvidia H20 AI chips in China is part of the US negotiations on rare earth metals.
→ The head of Nvidia stated that he was assured licences would be granted very quickly, and that a large number of orders for H20 chip deliveries had already been received from Chinese companies.
Market participants are viewing the situation with strong optimism, and analysts are raising their valuations for NVDA shares:
→ Morningstar analysts raised their fair value estimate for Nvidia shares from $140 to $170.
→ Oppenheimer analysts increased their target price from $170 to $200.
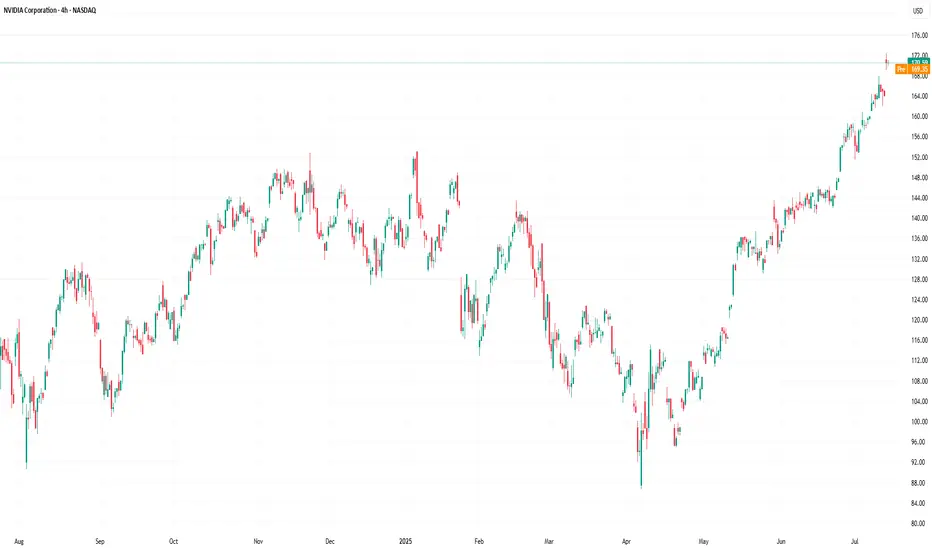
Technical Analysis of the NVDA Chart
The price trajectory of NVDA shares fully reflects the exceptionally strong demand:
→ The price is moving within an ascending channel with a steep growth angle;
→ Since early May, the RSI indicator on the 4-hour chart has not fallen below the 50 level;
→ Yesterday’s trading session opened with a large bullish gap.
The chart also shows the formation of a stable bullish market structure (shown with a purple broken line), expressed through a sequence of higher highs and higher lows.
Given the above, it is difficult to imagine what might cause a sharp shift from positive to negative sentiment. If a correction begins (for example, with a test of the $160 level), traders should watch for signs of its completion — this could present an opportunity to join the emerging rally.
This article represents the opinion of the Companies operating under the FXOpen brand only. It is not to be construed as an offer, solicitation, or recommendation with respect to products and services provided by the Companies operating under the FXOpen brand, nor is it to be considered financial advice.
NVIDIA(NVDA) Jackpot – Thief Trading Blueprint for Fast Profits!🚀 NVDA Stock Heist: The Ultimate AI Gold Rush (Scalping/Day Trade Plan)
🌟 Hey there, Market Pirates! 🏴☠️💰
Thieves, Traders, and Money Makers—gather around! Based on the 🔥Thief Trading Style🔥, here’s our master blueprint to loot NVIDIA’s AI-fueled rally. Follow the strategy on the chart—long entry is LIVE! Our escape? Near the high-risk Resistance Zone. Overbought? Consolidation? Reversal trap? Bears are lurking, but we’re stealing profits first! 🎯💸
🎯 Entry (The Vault is Open!)
"Swipe the AI gold at any price—the heist is ON!"
Pro Tip: Use buy limits within 15-30min near swing lows/highs for pullback entries.
🛑 Stop Loss (Thief’s Escape Route)
SL at recent swing low (4H timeframe)—adjust based on your risk & lot size.
Scalpers/Day Traders: Tighten SL if stacking multiple orders.
🏆 Target 🎯: 165.00 (The AI Jackpot!)
📈 Why NVDA?
Bullish momentum from AI dominance, earnings hype, and institutional FOMO.
Tech sector strength + chip demand = THIEF’S PARADISE.
📰 Fundamental Heist Intel
Need macro trends, sentiment, and intermarket analysis? 🔗 Check our bioo for the full robbery toolkit.
⚠️ Trading Alert: News & Position Control
Avoid new trades during earnings/news—volatility kills heists!
Trailing SLs = Locked profits. Don’t get greedy!
💥 Boost This Heist!
👊 Hit "Like" & "Boost" to fuel our next raid. Every click = More stolen profits! 🚀💰
🤑 Stay tuned—more heists coming! NVIDIA today… what’s next? 🤫🐱👤

Fundamental and technical analysis on NVDA (Chicken Nugget) soonFundamental Analysis
NVIDIA Corporation (NVDA) remains a key player in the tech sector, benefiting from the rise of artificial intelligence, data centers, and gaming. With sustained growth, constant innovation, and strong demand for its graphics chips, the company continues to deliver solid financial results.
Recent reports indicate revenue growth and expansion in key markets. Product diversification, particularly in supercomputers and embedded systems, strengthens NVDA’s position against competitors. Investor interest in the semiconductor industry helps maintain the stock’s positive momentum.
Technical Analysis
The chart analysis highlights key technical levels for investors:
- Key Resistance: $150 USD – This level must be broken to confirm a strong bullish trend. A breakout with volume could signal a gradual rise toward higher targets.
- Support Level: $131.50 USD – Strong demand and low supply are identified at this level, making it an excellent entry point for investors looking for buying opportunities before a potential rebound.
Targets & Strategy
- Short-term target (late June/early July): The target range of $170-$175 USD is possible if the bullish trend is confirmed. This level aligns with technical extensions and favorable market dynamics.
- July buyback (-5% to -10%): A moderate correction could occur, offering another buying opportunity before an upward recovery.
- Selling target (September to November): The next selling target is between $200-$240 USD, depending on market developments and investor sentiment.
Conclusion
NVDA stock presents interesting prospects, with well-defined technical levels and a strong fundamental outlook. Investors should monitor these thresholds to adjust their strategy based on market fluctuations.
If you want to refine this analysis or explore other scenarios, I'm here to dive deeper into key points! 🚀 Subscribe! TSXGanG
I hold a CCVM and MNC (Certificate of Competence to become a securities broker anywhere in Canada) and have been working as a trader for five years.
It’s a pleasure for me to help people optimize their trading strategies and make informed financial market decisions.

NVDA’s Wild Crash Alert: I’m Braced for a Heart-Stopping Drop!NVDA’s like a rocket losing altitude, and I’m on edge! It’s at $95.99, but I’m seeing it tumble to $90, maybe $88.95, then $83.59 if the bears go wild. If that breaks, whoa—$77.48 could hit hard! I’m glued to $90 for the first clue—big selling there, and it’s game on for a slide.
Kris/Mindbloome Exchange
Trade Smarter Live Better

NVDA to 151? Morning Trading Fam
Currently this is what I am seeing with NVDA, looks like we have decent support around 118 if that level holds I can see us driving up to 144 then 151 from here. However if we break through the 118 support: we could possibly see a massive breakdown down to 87-88 dollar range.
Kris/ Mindbloome Exchange
Trade Smarter Live Better

NVIDIA: last accumulation before $260 rally.NVIDIA is neutral on its 1D technical outlook (RSI = 49.723, MACD = -1.780, ADX = 32.427) as the price is accumulating in preparation for the 2025 rally. We are on a 1D MA50-100 squeeze that looks very much like November 6th 2023. The 1D RSI patterns among those two Bull Flags are also identical and what followed this squeeze was a +150% rally from the last bottom. The trade is long (TP = 260.00) aiming for a full +150% extension.
See how our prior idea has worked out:
## If you like our free content follow our profile to get more daily ideas. ##
## Comments and likes are greatly appreciated. ##

NVDA's Next Big Moves: Targeting 190, 175, 170! NVDA's on a wild ride, and here's where we might be heading. We're eying some exciting highs with targets at 190, 175, and 170 if we can break through 147. But, keep your seatbelts on because if the market doesn't hold up, we could be looking at a drop all the way down to 110, or even 98. Let's keep our fingers crossed for the highs but prepare for any dips.
Trade Smarter/ Live Better
Kris/ Mindbloome Exchange

What’s Next for NVDA: $142 or $123?Good morning Trading Family
Here’s the game plan: if NVDA moves above $133.50, we could see it climb to $134.50, then correct back down to $123. If it breaks $129.33, it might drop to the $123 range. But if it pushes past $137, we could see it head toward $142.
This Sunday, I’m hosting a webinar on how emotions can hurt your trading and how to take control of your mindset for better results.
Send me a message or check out my profile for details. If this added value to your trading, like, comment, and share it with someone who needs it.
Kris/Mindbloome Exchange
Trade What You See

NVIDIA (NVDA): Will $142 or $133.92 Break First?Morning Trading Family
NVIDIA is sitting at a key point, and what happens next could lead to a big move. Let’s break it down in simple terms so it’s easy to follow.
If NVDA Breaks Above $142
Things could get exciting for the bulls. Here’s what to expect:
Breaking above $142 could kick off a solid bull run.
We’d likely see momentum push the price higher from there.
If NVDA Breaks Below $133.92
The bears might take over, and these levels could show up next:
$129: The first stop where some buyers might try to step in.
$114: A bigger drop, which would be an important level to watch for support.
Here’s the Plan
-Watch $142 and $133.92—these are the key levels.
-Be ready for a breakout or breakdown, but only trade when it’s confirmed.
-Always manage your risk. Use stop-losses and don’t risk more than you’re comfortable losing.
If you enjoyed this breakdown, give it a like or follow. Have questions about NVIDIA or any other chart? Send me a DM, and I’ll help you out.
Feeling stressed or burned out from trading? You’re not alone. Let’s chat about ways to build a balanced trading mindset that helps you stay in the game for the long term. You’ve got this!
Kris/Mindbloome Exchange
Trade What You See

NVIDIA (NVDA): Breakout Levels in Sight!Good morning, trading family!
NVIDIA ( NASDAQ:NVDA ) is getting close to a key resistance level at $141.87. Here’s what could happen:
If the price breaks $141.87: We might see it move up to $150 and even $158 if the momentum stays strong.
This is an exciting setup, so keep an eye on how the price reacts. Let’s stay focused and trade smart!
Wellness Tip of the Day: Start your morning with a healthy breakfast. A mix of protein (like eggs or yogurt), healthy fats (like nuts or avocado), and slow carbs (like oatmeal or whole-grain bread) will give you steady energy and help you make sharp decisions all day.
Comment, like, follow, or send me a message if you’d like more details about this trade!
Kris/Mindbloome Exchange
Trade What You See

Is NVIDIA Ready to Break Out or Break Down?Good morning, trading family!
How’s everyone feeling today? Got your coffee? Charts ready? It’s time to dive in and see what the market has in store for us.
Here’s the vibe: NVIDIA’s setting up for something big—are we aiming for $142 or sliding to $119? It’s like a game of tug-of-war, and the market’s holding the rope.
Quick Tip: Remember, trading is about patience and discipline. If you’re feeling stuck, step away, take a breath, and come back with a clear head. The market’s not going anywhere.
If you want a closer look at these setups or other ideas I’m watching, feel free to check out my profile or send me a DM—I’m always happy to share insights or answer questions. Let’s make it a great day!
Kris /Mindbloome Exchange
Trade What You See

NVIDIA’s Next Move: Are We Headed to $160 or Dropping to $118?Good morning, trading family.
NVIDIA just hit a big level, and now we’re seeing it pull back. Here’s what I’m watching:
1️⃣ First stop looks like $134.75.
2️⃣ From there, it could go one of two ways:
We get a bounce, and NVIDIA pushes back up to the $160s.
Or, it keeps sliding to $128-$130.
If those levels don’t hold, we could see it drop even further to $118.
This is one of those times where it’s all about watching the levels and letting the chart tell us the next move. Trade what you see.
What do you think—are we bouncing or dropping lower? Let me know your take below, and hit like and follow if this breakdown helps.
Kris/ Mindbloome Exchange

NVDA Set to Make Waves: Big Levels Ahead!Update:
Good morning, trading family. Here to break this down nice and easy for you. Let’s ride the NVDA waves together:
1️⃣ First scenario: NVDA climbs to $154–$156. From there, it could either break higher or pull back to $150, maybe lower. Watch for a bounce if it dips.
2️⃣ Second scenario: A move to $168 is on the table, but expect a pullback to $164 before the next push higher. If the pullback goes deeper, it’s just a chance to reset.
3️⃣ Third scenario: If NVDA powers through all those levels, $179 is next, with a potential correction back to $168 along the way.
Mindbloome Trading/ Kris
Trade What You See

NVDA Weekly to Four Hour In Depth Analysis Where Are We Going Good evening Traders
So in this video I go into the weekly and down to the four hour and 30 minute identifying key levels to look out for and where the market is going.
Currently where we are I really thought we were going to have a shorter correction and punch back up but hey I dont assume and I only trade what the market gives me.
What is currently happening is if we can break and close above 140.65 to me that would be a great entry for this bull run up to 150's
However we can correct back into the zone of 138.40 and then go back into the full bull swing of things
And Lastly we are sinking further to the 129.64 level looking for a entry on another bull run up, if we break lower then I dont know what to tell you other than our bull run maybe over ???
If you like the video: please share, boost, and follow or comment: give me feedback on what you currently see and why.
Hope you have a great day trading
Mindbloome Trading
Trade What You See

NVDA Great ROI Trade Bullish to 145+ Hi Trading Family
Here is an update for you: a potential finish of our correction down from the analysis we currently did today. Massive ROI and break up potential, if your looking for a great trade with low risk ie put your stop below the low and let it run to 145 this could be the trade your after
Hope this helps
Mindbloome Trader

NIVIDIA 4 HR: Correcting back to 130.70 or We Pushing Higher UP Morning Traders
Quick update here, currently if we make a break above the 132.70 range the 137.30 is our goal and target however their are a couple hurdles along the way.
We can possibly still correct down to the 130.70 level
I go over the market from 4 hour to 30 minute giving you some levels to look for in today's trading day
Happy Trading
MB Trader

NVDIA: Neutral but ready to breakout aggressively to the upside.NVDIA is neutral on its 1D technical outlook (RSI = 49.101, MACD = -0.300, ADX = 35.106) as it is trading exactly on its 1D MA50. The long term pattern has been a Channel Up for the past two years and having touched its bottom on the August low, we expect the price to have broken upwards within 3 weeks. The early signal for that will be the RSI crossing overs its LH trendline. TP = $230.00
## If you like our free content follow our profile to get more daily ideas. ##
## Comments and likes are greatly appreciated. ##
