NVIDIA – From Thesis to Profits: How Fundamentals & Technicals 📚💡 NVIDIA – From Thesis to Profits: How Fundamentals & Technicals Aligned 🚀🧠
This isn’t just a trade —it’s a lesson in how conviction, timing, and structure come together when you truly understand what you're investing in.
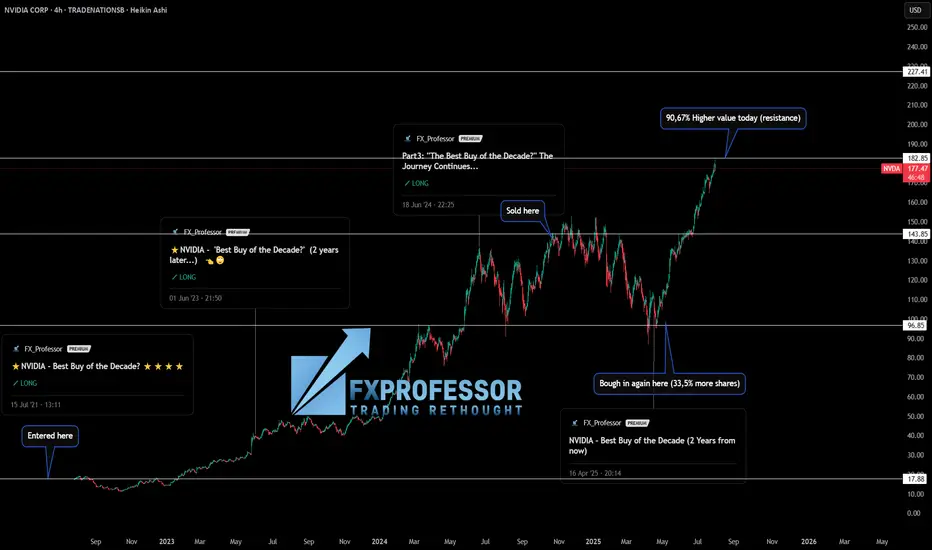
I’ve been publicly calling NASDAQ:NVDA the “Best Buy of the Decade” since July 2021 when the price was around $18. Why? Because I’m a gamer, I understand chips, and I knew exactly what NVIDIA was building long before AI became a buzzword. From graphics cards to data centers and AI compute, the fundamentals were solid.
But let me be clear: I’m not a holder forever. I use technical analysis to manage entries and exits. And that’s where the real edge comes in. 🎯
Here’s how the trade evolved:
✅ Initial entry: $17.88 (2021)
✅ First target hit: $143.85 → Took profits
✅ Re-entry: $96.85 → Got 33.5% more shares for the same money
✅ Today’s value (July 31st): Up +90.67% in just 100 days
📅 That’s from April 23rd to today.
(and it was ALL publicly posted here, for You!)
This is what happens when macro conviction meets micro execution.
🧠 The key takeaways:
Fundamentals gave me the why.
Technicals gave me the when.
And risk management gave me more shares for free.
That’s not luck —it’s structure, patience, and doing the work. If you’re just “HODLing” and hoping, consider learning how to work the chart instead of letting the chart work you.
Let me know in the comments—did you catch this move? Are you in, or waiting for the next entry?
One Love,
The FX PROFESSOR 💙
ps. in this case i did not sell many shares today i hedged with a short on SP500. Nvidia might correct a bit
Disclosure: I am happy to be part of the Trade Nation's Influencer program and receive a monthly fee for using their TradingView charts in my analysis. Awesome broker, where the trader really comes first! 🌟🤝📈
Nvidia
Broadcom Middle of Range RisksI like Broadcom if it gets down to $178. Right now it's still floating from the AAPL news. I wouldn't be inclined to sell here, but if looking to buy (like myself) I'd wait in hopes for $178.
Target (Potential Next Support) $302.
Good luck!

Nvidia - This is clearly not the end!📐Nvidia ( NASDAQ:NVDA ) will confirm the breakout:
🔎Analysis summary:
Over the past couple of months, Nvidia managed to rally about +100%, reaching top 1 of total market cap. Most of the time such bullish momentum just continues and new all time highs will follow. But in order for that to happen, Nvidia has to confirm the all time high breakout now.
📝Levels to watch:
$150
🙏🏻#LONGTERMVISION
SwingTraderPhil

Nvidia Just Under Major SupportNvidia seems to have been pulled down by the Dow just like Apple as both are just under major support. I'm sorry for my previous Nvidia chart that drew support near 140, I recognize where I screwed up, but this chart should be good. Fortunately actual 117 support wasn't that far below and my NVDA isn't too in the red.
NVDA has the lowest revenue multiple in years right now. I know it's well off it's long term trend line, but it's growth rate is unlike anything it's ever been so expecting a steeper trend line to appear makes a lot of sense. Eventually I would imagine we'll get back to that trend line, but not anytime soon.
The Dow hitting major support should finally lift NVDA and the others that have been dragged down like AAPL and AMZN.
Good luck!

99% of people buying $NVDA don't understand this:🚨99% of people buying NASDAQ:NVDA don't understand this:
NASDAQ:GOOGL : “We’re boosting AI capex by $10B.”
Wall Street: “Cool, that’s like $1B or 0.06 per share for $NVDA.”
So from $170.50 at the time of news to $170.56 right?
No.
NASDAQ:NVDA trades at 98× earnings. So that $0.06? Turns into $6.00
Why?
Because people are expecting that to be happening every single year for 98 years and they're paying All of it Today in Full amount.
So NASDAQ:NVDA will get $1B more per year. But NASDAQ:NVDA price per share already increased by $100B in past 2 days 😂
Then it crashes 40% and everyone is wondering why.

Wall Street takes off: 5 secret growth engines for #S&P500 Record closes for the indices on July 21 came from a powerful combo: a surge in #Google , a strong start to the earnings season, gains in #Apple (+0.6%), #Amazon (+1.4%), plus #Microsoft, #Meta Platforms, and #Nvidia . This momentum, coupled with market bets on imminent Fed rate cuts and hopes for a softening US-EU tariff conflict, pushed #S&P500 and #NQ100 to new all-time highs.
5 mega drivers that could keep #S&P500 and #NQ100 on the runway through 2025:
• AI capex and monetization: Top cloud providers are ramping up spending in computing clusters and generative AI solutions. The growing lineup of paid AI products (Google Gemini, Microsoft Copilot+ Apps, Amazon Bedrock) is starting to generate significant revenue, boosting profit estimates for the “Magnificent 7.”
• Fed policy easing: If inflation keeps drifting towards 2%, we may see the first rate cut of the cycle between July and September. Historically, every 25 bps drop in 10-year UST yields adds ~2% to the #NQ100 ’s valuation multiple.
• Record buybacks and dividends: #S&P500 companies hold $3.5 trillion in cash. After tax relief on repatriated foreign earnings earlier this year, several megacap boards approved accelerated buybacks — mechanically supporting stock prices.
• Easing tariff risks: Potential trade deals between the US and EU, and the US and Mexico, would remove the threat of 20–50% tariffs priced into valuations, unlocking CAPEX in manufacturing and semiconductors — sectors with a heavy #NQ100 weight.
• Resilient consumers and services: Unemployment remains near 4%, and household spending is growing 2–3% YoY. This supports e-commerce, streaming, and platform advertising — together making up ~40% of #NQ100 and ~28% of #S&P500 .
The current highs of #S&P500 and #NQ100 aren’t a random spike — they result from strong corporate earnings, expectations of Fed cuts, and hopes of trade détente. If even some of these five drivers materialize, the indices have a strong chance to stay elevated and set new records by year-end. FreshForex analysts believe current prices could spark a new rally, with today’s market conditions offering plenty of entry points in both indices and stock CFDs.

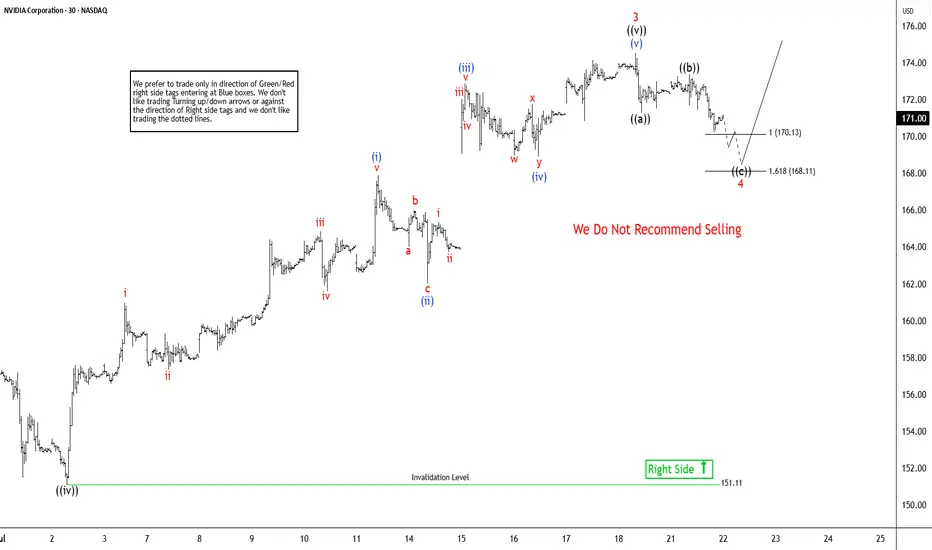
Elliott Wave Sequence In NVDA Suggests Rally From SupportNvidia (NVDA) continues rally to new all-time highs from April-2025 low and reinforcing a robust bullish outlook. In daily, it ended 7 swings pullback at 86.62 low in 4.07.2025 low started from 1.07.2025 high. Above April-2025 low, it confirmed higher high bullish sequence & pullback in 3, 7 or 11 swings should remain supported. Since April-2025 low, it favors rally in (3) of ((1)), while placed (1) at 115.44 high & (2) at 95.04 low in 4.21.2025. Above there, it placed 1 of (3) at 143.84 high, 2 as shallow connector at 132.93 low & 3 at 174.53 high. Wave (3) already extend beyond 2.0 Fibonacci extension of (1) & yet can see more upside. Within 1 of (3), it ended at ((i)) at 111.92 high, ((ii)) at 104.08 low, ((iii)) at 137.40 high, ((iv)) at 127.80 low & ((v)) at 143.84 high. Above 2 low, it placed ((i)) of 3 at 144 high, ((ii)) at 137.88 low, ((iii)) at 159.42 high, ((iv)) at 151.10 low & ((v)) at 174.53 high as 3 of (3).
It already reached the minimum area of 170.04 as inverse extension of connector. But it can see more upside as daily move showing highest momentum from April-2025 low. In 1-hour, above ((iv)) low, it placed (i) of ((v)) at 167.89 high in 5 swings, (ii) at 162.02 low, (iii) at 172.87 high, (iv) at 168.90 low & (v) of ((v)) at 174.53 high ended as 3. Currently, it favors pullback in 4 targeting into 170.13 - 168.11 area before rally in 5 or at least 3 swing bounce. Within 4, it ended ((a)) at 171.26 low, ((b)) at 173.38 high & favors lower in ((c)) of 4. It should find support in extreme area soon to turn higher for two more highs to finish ((1)). The next move in 5 of (3) can extend towards 175.9 or higher, while pullback stays above 168.11 low. The next two highs expect to come with momentum divergence to finish cycle from April-2025 low. Later it should see bigger pullback against April-2025 low in 3, 7 or 11 swings. But if it extends higher & erase momentum divergence, then it can see more upside.
NVIDIA: Stay heavy on positionsNVDA position size is adjusted in line with US market signals for underweight or overweight allocations. During panic phases, 2x leverage ETFs are on the table
Stay heavy on positions.

NVIDIA Robbery Plan: Bullish Swing Trade to Millions!🔥 NVIDIA (NVDA) Stock Heist Blueprint: Unlock Bullish Profits with Thief Trading Style! 🚀💰
🌟 Greetings, Wealth Warriors! 🌟
Hello, Ciao, Salaam, Bonjour, Hola, and Hallo to all you savvy traders and market masterminds! 🤑💸 Get ready to execute a high-octane trading plan with our Thief Trading Style—a bold fusion of technical precision and fundamental insights designed to crack the NVIDIA (NVDA) stock market vault! 💥📈
📝 The NVIDIA Heist Plan: Swing & Day Trading Mastery 🏆
Based on our proprietary Thief Trading Style, this plan targets NVIDIA (NVDA), currently riding a bullish wave fueled by strong fundamentals and technical setups. Follow the strategy outlined below to navigate the high-risk Red Zone—where overbought conditions, consolidation, and potential trend reversals create opportunities for sharp traders. 💪 Stay alert, as bearish players may set traps at key levels! 🕵️♂️
Entry Strategy: Crack the 🙂Vault! 🏦
Go long with confidence! The market is primed for a bullish breakout. Enter at current prices or set buy limit orders near recent swing lows/highs on the 15-minute or 30-minute timeframe. 📅
Pro Tip: Set price alerts on your chart to catch the optimal entry. Timing is everything in this heist! ⏰
Swing Traders: Look for pullbacks to key support levels for safer entries.
Scalpers: Focus on quick long-side trades with tight stops to maximize gains. 💨
Stop Loss: Protect Your Loot! 🔒
Place your stop loss (SL) below the recent swing low on the 30-minute timeframe (e.g., $162.00 for swing trades).
Adjust your SL based on your risk tolerance, position size, and number of orders. For larger accounts, consider tighter stops to lock in gains early. 🛡️
Scalpers: Use a trailing stop to secure profits while riding short-term momentum.
Take Profit Target: Cash Out Big! 💰
Aim for $191.00 as the primary target, or exit early if momentum slows.
Swing Traders: Hold for the full target if the trend remains strong.
Scalpers: Grab quick profits on smaller price spikes and re-enter on dips.
Pro Move: Use a trailing stop to let profits run while safeguarding gains. 🚀
📌Key Levels & Risk Management
Entry Zone: Market price or swing low – ideal for long positions. 📈
Stop Loss: $162.00 – based on 30m timeframe swing low. 🛑
Take Profit Target: $191.00 – primary target for swing/day trades. 🎯
Risky Red Zone: Overbought levels – watch for consolidation or reversal traps. ⚠️
💡 Why NVIDIA? The Bullish Case 📡
NVIDIA (NVDA) is powering through a bullish phase, driven by:
Fundamentals: Strong demand for AI, gaming, and data center chips. 📊
Macro Factors: Positive market sentiment and tech sector momentum. 🌍
COT Data (Latest Friday Update, UTC+1): Large speculators are increasing bullish positions, signaling confidence in NVDA’s upside (data sourced from reliable platforms). 📅
Geopolitical & News: Monitor upcoming earnings and industry developments for catalysts. 📰
Intermarket Analysis: Tech-heavy indices like the NASDAQ are trending higher, supporting NVDA’s rally. 📈
For a deeper dive, check fundamental reports, COT data, and sentiment analysis to align your trades with the bigger picture. 🔍
⚠️ Trading Alert: Navigate News & Volatility 🗞️
News releases can spark sharp price swings. To protect your capital:
Avoid new trades during major news events (e.g., earnings or Fed announcements). 🚫
Use trailing stops to lock in profits and limit downside risk. 🔐
Stay updated with real-time market developments to adjust your strategy dynamically. 📡
🚀 Boost the Heist! Support the Thief Trading Community 🤝
Love this plan? Hit the Boost Button to amplify our Thief Trading Style and empower our community to conquer the markets! 💥 Every like and share fuels our mission to make money with precision and style. 💪 Join us daily to unlock more high-profit heist plans! 🏴☠️
📌 Important Disclaimer
This analysis is for educational purposes only and not personalized investment advice. Always conduct your own research, assess your risk tolerance, and verify market conditions before trading. Markets move fast—stay sharp and adapt! ⚡
🌟 Stay tuned for the next heist plan, traders! Let’s keep stealing profits together! 🤑🐱👤🎉

Nvidia (NVDA) Share Price Surges Above $170Nvidia (NVDA) Share Price Surges Above $170
Yesterday, Nvidia’s (NVDA) share price rose by more than 4%, with the following developments:
→ It surpassed the psychological level of $170 per share;
→ Reached another all-time high;
→ Gained more than 9% since the beginning of the month.
The bullish sentiment is driven by Nvidia CEO Jensen Huang’s visit to China shortly after meeting with US President Trump. At the same time:
→ US Secretary of Commerce Howard Lutnick stated that the planned resumption of sales of Nvidia H20 AI chips in China is part of the US negotiations on rare earth metals.
→ The head of Nvidia stated that he was assured licences would be granted very quickly, and that a large number of orders for H20 chip deliveries had already been received from Chinese companies.
Market participants are viewing the situation with strong optimism, and analysts are raising their valuations for NVDA shares:
→ Morningstar analysts raised their fair value estimate for Nvidia shares from $140 to $170.
→ Oppenheimer analysts increased their target price from $170 to $200.
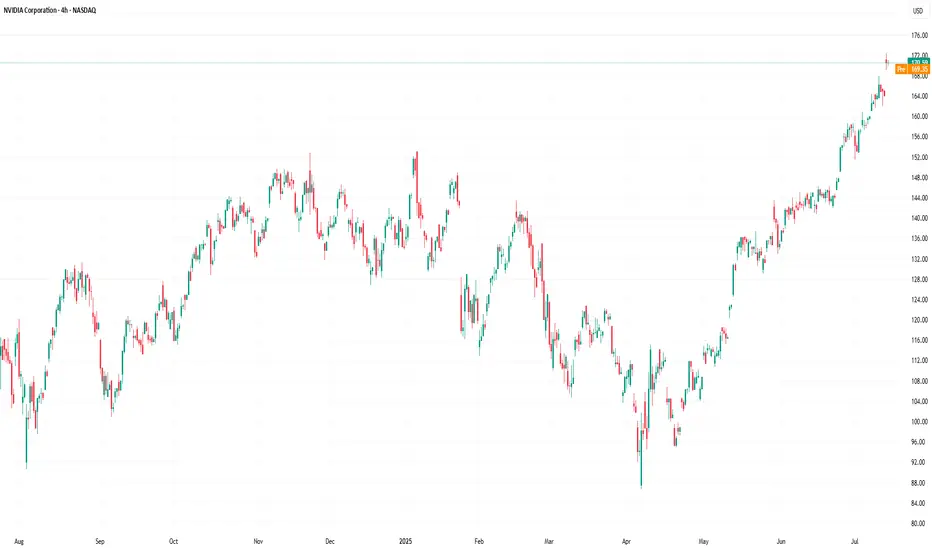
Technical Analysis of the NVDA Chart
The price trajectory of NVDA shares fully reflects the exceptionally strong demand:
→ The price is moving within an ascending channel with a steep growth angle;
→ Since early May, the RSI indicator on the 4-hour chart has not fallen below the 50 level;
→ Yesterday’s trading session opened with a large bullish gap.
The chart also shows the formation of a stable bullish market structure (shown with a purple broken line), expressed through a sequence of higher highs and higher lows.
Given the above, it is difficult to imagine what might cause a sharp shift from positive to negative sentiment. If a correction begins (for example, with a test of the $160 level), traders should watch for signs of its completion — this could present an opportunity to join the emerging rally.
This article represents the opinion of the Companies operating under the FXOpen brand only. It is not to be construed as an offer, solicitation, or recommendation with respect to products and services provided by the Companies operating under the FXOpen brand, nor is it to be considered financial advice.
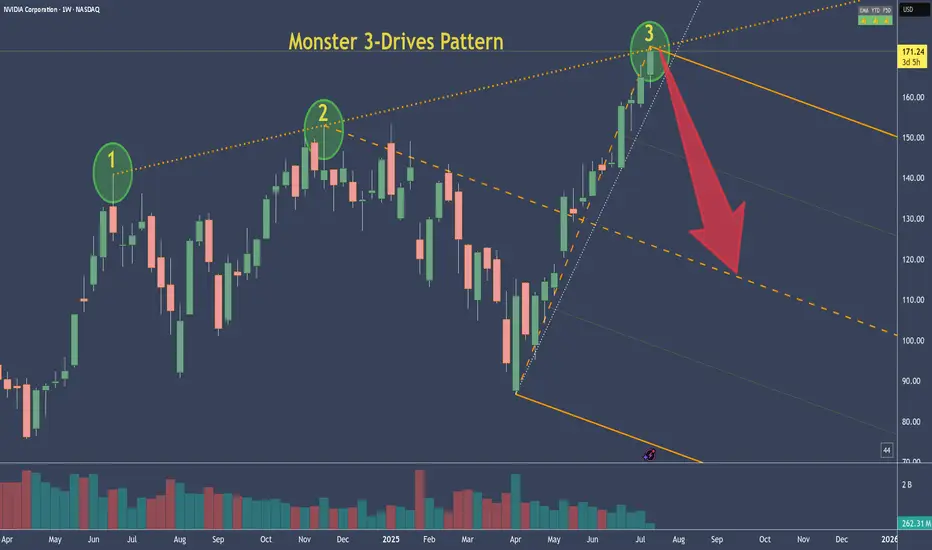
NVDA - NVIDIA's 3-Drive Pattern target if it plays outThis is the weekly chart of NVDA.
We can clearly see a 3-Drives pattern forming.
If this pattern plays out, the centerline would be my target. Of course, it's still too early to short.
But I’ve got my hunting hat on and I'm watching for signals on the daily chart.
One would be a break of the slanted trendline—but there are a couple of other conditions that need to align as well.
Always ask yourself: What if?
How expensive is Nvidia today?How expensive is NASDAQ:NVDA today?
❗ You're paying $40 today for $1 of next year's earnings
That's what Nvidia's forward P/E 40x means at current $172 per share
AI might be the future but you're prepaying for it like it's 2060 🤖

HBARUSD has 3 bullish patterns stacked on top of eachotherThe inverse head and shoulders in the light blue, the light tan is the bull flag, and the pink is the double bottom. Currently price is above the Bullflag and the Inverse head and shoulders pattern. The bullflag also counts as a descending channel pattern as well. We just recently retested the neckline of the inverse head and shoulders as exact wick support which is a good sign. All 3 should provide eachother with the bullish confluence needed for them to be validated, but in addition to this technical bullishness we have some fundamental bullishness occurring just recently too as NVIDIA just announced their new Blackwell chips — claiming them to be the future backbone of AI infrastructure — which are integrating verifiable compute which has its fundamental trust layer built on Hedera. This also provides great bullish confluence and heightens the probability these 3 chart patterns will all be validated and reach their full targets. I will keep updating this post as they do so. *not financial advice*

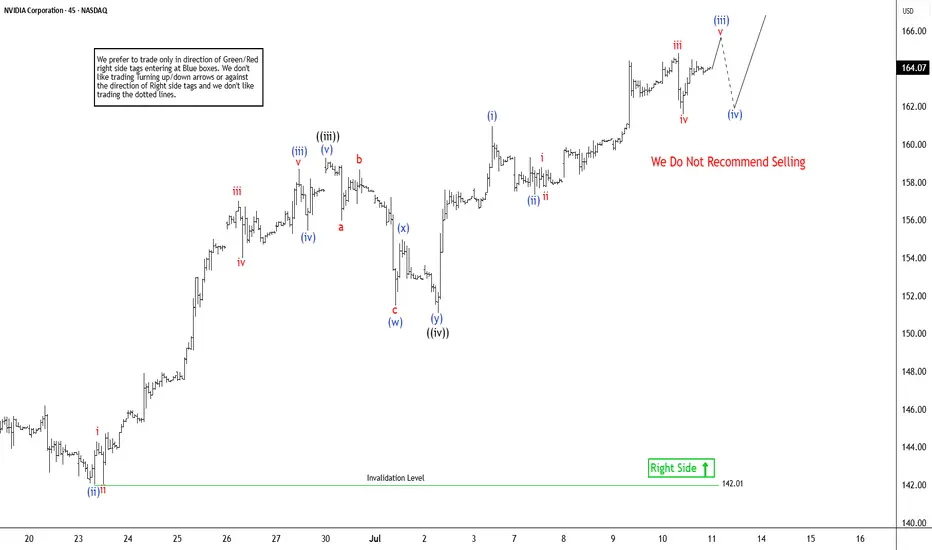
NVIDIA ($NVDA) Elliott Wave Outlook: Larger Pullback on the HoriNvidia (NVDA) continues its remarkable ascent, consistently reaching new all-time highs and reinforcing a robust bullish outlook. The ongoing rally, which began from a significant low on April 7, 2025, remains structured as an impulsive wave pattern, indicative of strong upward momentum. However, despite the potential for further short-term gains, the cycle appears mature. This suggests a larger-degree pullback could be imminent. Investors should exercise caution when considering chasing this rally in shorter time frames, as the risk of a corrective move grows.
In the short term, the cycle initiated from the June 2 low is progressing as a lower-degree impulse. From this low, wave ((i)) peaked at $144, followed by a corrective pullback in wave ((ii)) that concluded at $137.88. The stock then surged in wave ((iii)) to $159.42. The subsequent wave ((iv)) correction unfolded as a double-three structure, with wave (w) ending at $151.49, wave (x) at $154.98, and wave (y) completing at $151.10, finalizing wave ((iv)). Currently, Nvidia is advancing in wave ((v)), exhibiting a five-wave subdivision. Within this, wave (i) of ((v)) reached $160.98, with a minor pullback in wave (ii) concluding at $157.34. As long as the pivotal low at $142.01 holds, any near-term pullbacks are likely to attract buyers in a 3, 7, or 11-swing pattern, supporting further upside potential. This technical setup underscores Nvidia’s strength but highlights the need for prudent risk management.
A bit of profit taking on NVDA and then up again?NASDAQ:NVDA is the most talked about and everyone is capitalizing on that. Let's take a look.
NASDAQ:NVDA
Let us know what you think in the comments below.
Thank you.
75.2% of retail investor accounts lose money when trading CFDs with this provider. You should consider whether you understand how CFDs work and whether you can afford to take the high risk of losing your money. Past performance is not necessarily indicative of future results. The value of investments may fall as well as rise and the investor may not get back the amount initially invested. This content is not intended for nor applicable to residents of the UK. Cryptocurrency CFDs and spread bets are restricted in the UK for all retail clients.

USNAS100 Bullish Ahead of NVIDIA Milestone – 23010 in SightUSNAS100 – Outlook
The index continues its bullish momentum, supported by strong tech performance — notably NVIDIA surpassing a $4 trillion market cap.
As long as the price holds above 22880, the trend remains bullish toward:
23010 Then extended targets near 23170
However, a 1H close below 22815 would signal weakness, potentially opening the way for a retracement toward: 22705 And 22615, especially if tariff tensions escalate.
Resistance: 23010, 23170
Support: 22815, 22705, 22615

Nvidia Market Capitalisation Reaches $4 TrillionNvidia Market Capitalisation Reaches $4 Trillion
Yesterday, Nvidia’s (NVDA) share price surpassed $162 for the first time in history. As a result, the company’s market capitalisation briefly exceeded $4 trillion during intraday trading (according to CNBC), making Nvidia the first publicly listed company to reach this milestone.
The rise in NVDA’s share price is being driven by both bullish sentiment across the broader equity market—which appears optimistic ahead of the upcoming Q2 earnings season—and evidence of sustained demand for Nvidia’s products, as artificial intelligence technologies continue to gain widespread adoption.
Noteworthy developments include:
→ Nvidia may begin producing a specialised AI chip for the Chinese market this autumn, potentially circumventing current export restrictions;
→ Perplexity, a company backed by Nvidia, is launching an AI-powered browser aimed at competing with Google Chrome.
Technical Analysis of NVDA Chart
In our previous analysis of NVDA’s price action, we:
→ Drew an ascending channel;
→ Highlighted bullish conviction in overcoming the $145–150 resistance zone.
The channel remains valid, with the current price trading near its upper boundary. However, the RSI indicator is showing signs of bearish divergence, suggesting that the stock may be vulnerable to a near-term correction—potentially towards the median line of the existing upward channel.
At the same time, a major shift in the prevailing bullish trend appears unlikely. The $145–150 range may serve as a key support zone for NVDA in the foreseeable future.
This article represents the opinion of the Companies operating under the FXOpen brand only. It is not to be construed as an offer, solicitation, or recommendation with respect to products and services provided by the Companies operating under the FXOpen brand, nor is it to be considered financial advice.

DAX (Ger40): Defying Global TensionsDespite all this tariff drama, the DAX hit another record high. What gives? Markets seem to be betting that Trump enjoys the threat of tariffs more than the implementation. Some traders are pricing in yet another extension beyond the August 1 deadline.
The DAX is riding momentum from both global AI enthusiasm, thanks to Nvidia’s $4 trillion market cap milestone, and the assumption that European exporters might dodge the worst of Trump’s trade penalties, at least for now. However, this rally is precarious. If a tariff letter hits Brussels, or copper tariffs ripple into industrial demand expectations, we could see a swift correction.
Technically, near term resistance is sitting around. 24,700. However as stated, should sentiment change. A correction back down, to the support level at 24,200, which also aligns with the 50 Fibonacci retracement level, could be on the cards. Or even all the way down to 23,800, aligning with the 88% Fibonacci level.

NVIDIA – Best Buy of the Decade (4T Record but now resistance)🚀🔥 NVIDIA – Best Buy of the Decade Post #6
💡📉 Great but why am I taking half profits Today?
Back in July 2021, I named NVIDIA "The Best Buy of the Decade. " Today, it just hit a mind-blowing milestone — becoming the first company to reach a $4 trillion market cap. But here's the thing... that happened right at major resistance.
From our initial call in 2021 , to the target at $143.85 drawn via parabola in 2023, to the April 2025 re-entry at $95, it’s all on the chart — and it's been a textbook ride so far.
At the current level of $163.89, we’re pressing into serious overhead resistance. This doesn’t mean the story is over — not even close. But it could mean we take a breather before the next leg higher.
🧭 Targets ahead remain unchanged:
🔹 First stop: $182.85
🔹 Long-term vision: $227.41
What started as a bold macro call in 2021 has now become a multi-year thesis with precision updates along the way. This is post #6 in the NVIDIA journey — and if you scroll back through the chart, each piece has built on the last with clarity and conviction.
🎯 NVIDIA is not just a tech stock — it’s the AI backbone. But every cycle has pauses, and this one looks ready for a short rest before we see the next breakout.
Stay sharp, follow the structure, and honor the parabola.
One Love,
The FX PROFESSOR 💙
Additional info, for those who like to dive deeper into NVDA:
🔍 Technical Breakdown Version
For the chartists and structure followers, here’s the breakdown:
📌 2021: Original call — "Best Buy of the Decade"
📌 2023: First parabola plotted, projecting toward $143.85 — target hit precisely
📌 April 2025: Market offered $95 re-entry — second parabola begins
📌 Now: Price sits at $163.89, testing resistance from both structure and Fibonacci
📌 Next levels:
- $182.85 → Key extension level
- $227.41 → Long-term target based on full parabolic arc
Current structure suggests a possible pause before continuation. No need for panic — parabola remains valid unless structure is broken. Volume still supportive, and price action is following projection beautifully.
🧠 AI Macro Narrative Version
The big picture? NVIDIA isn't just another semi stock — it’s the nervous system of the AI revolution.
From gaming → crypto → AI, NVIDIA has consistently been first to adapt, and now it’s the leader in AI hardware infrastructure. The $4 trillion milestone is more than symbolic — it represents capital reallocation toward AI as the next dominant sector.
🧠 Key macro takeaways:
AI demand is insatiable
Data centers need NVIDIA
Generative AI isn't slowing down
Institutions are still buying — not selling
The resistance we see now isn’t weakness — it’s the market pausing to digest before another acceleration. Just like every past cycle... we ride, retrace, reload, and resume.
Disclosure: I am happy to be part of the Trade Nation's Influencer program and receive a monthly fee for using their TradingView charts in my analysis. Awesome broker, where the trader really comes first! 🌟🤝📈

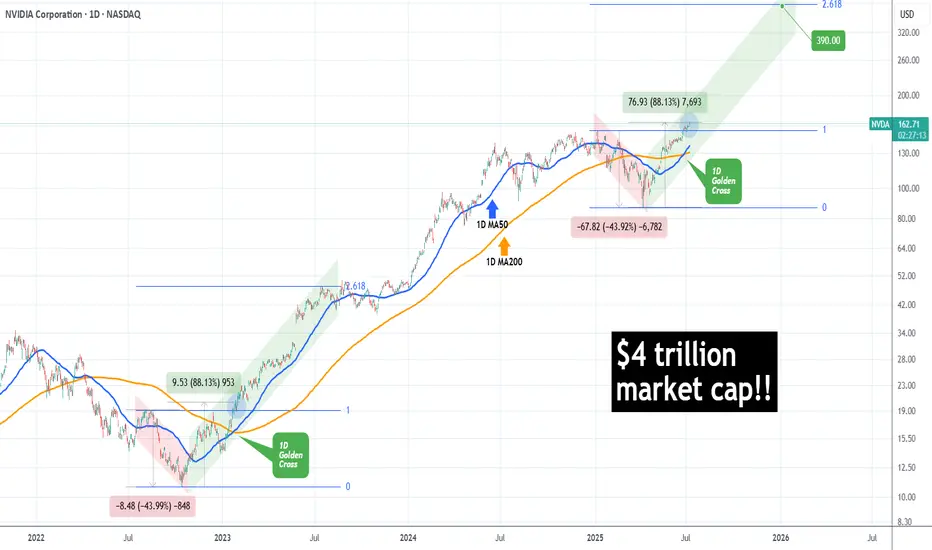
NVIDIA made history! First company with $4 trillion market cap!NVIDIA Corporation (NVDA) became today the first company in history to surpass a $4 trillion market value, as A.I. bulls extended the recent rally and pushed the price past the approximate $163.93 level needed to reach this market capitalization threshold.
The long-term trend on the 1D time-frame couldn't look more bullish. Coming off a 1D Golden Cross less than 2 weeks ago, the price has turned the 1D MA50 (blue trend-line) into Support and sits at +88.13% from the April 07 2025 Low.
This is the exact set-up that the market had when it was coming off the 2022 Inflation Crisis bottom (October 13 2022). As you can see, both fractals started with a -44% decline, bottomed and when they recovered by +88.13%, there were just past a 1D Golden Cross. In fact that Golden Cross (January 24 2023) was the last one before the current.
NVIDIA entered a Channel Up (green) on its recovery and for as long as the 1D MA50 was supporting, it peaked on the 2.618 Fibonacci extension before it pulled back below it.
If history repeats this pattern, we are looking at a potential peak around $390, which may indeed seem incredibly high at the moment, but as we pointed out on previous analyses, the market is in the early stages of the A.I. Bubble, similar to the Internet Bubble of the 1990s.
-------------------------------------------------------------------------------
** Please LIKE 👍, FOLLOW ✅, SHARE 🙌 and COMMENT ✍ if you enjoy this idea! Also share your ideas and charts in the comments section below! This is best way to keep it relevant, support us, keep the content here free and allow the idea to reach as many people as possible. **
-------------------------------------------------------------------------------
💸💸💸💸💸💸
👇 👇 👇 👇 👇 👇
Nvidia - New all time highs!Nvidia - NASDAQ:NVDA - breaks out now:
(click chart above to see the in depth analysis👆🏻)
Within two and a half months, Nvidia rallied more than +70%. Following this recent bullish strength, a retest of the previous highs was totally expected. But this does not seem to be the end at all. There is a much higher chance that we will see new all time highs soon.
Levels to watch: $150
Keep your long term vision🙏🙏
Philip (BasicTrading)

Semis ready to rip to price discoveryAMEX:SOXL NASDAQ:SMH
Semiconductors just waiting for the tarrif announcements to pass to blast off to all time highs

NVDA Analysis To 164?Quick breakdown of NVDA
Appears we hit our corrected level, we could go deeper possibly or hold at this level and drive up to 164
This is looking like a nice little setup long indeed
Trade Smarter Live Better
Kris/Mindbloome Exchange
