NVIDIA ($NVDA) Future of AI-Enabled DevicesNVIDIA ( NASDAQ:NVDA ) appears to be on an impressive trajectory, bolstered by the recent unveiling of its GeForce RTX 40 SUPER Series GPUs at CES 2024. These graphic processing units, built on the Ada Lovelace architecture, promise a significant leap in AI-powered PC experiences. The GPUs boast remarkable capabilities, with up to 52 shader TFLOPS, 121 RT TFLOPS, and 836 AI TOPS, setting new standards in gaming realism and AI-enhanced experiences.
The introduction of these AI-powered chips aligns well with the emerging demand for AI-enabled PCs. Despite recent challenges in the PC market, including declining demand and economic uncertainties, NVIDIA's forward-thinking approach positions it to capitalize on the growing opportunities in the AI PC segment. PC manufacturers like HP Inc. and Dell Technologies are also gearing up to roll out AI PCs, anticipating a recovery in the PC market in 2024.
NVIDIA's transformative technology goes beyond gaming, extending across various sectors such as deep learning inference, generative AI applications, and productivity tools like Adobe Photoshop. The RTX 40 SUPER series chips, equipped with specialized AI Tensor Cores, represent a monumental leap in AI capabilities for PCs, promising users transformative AI experiences.
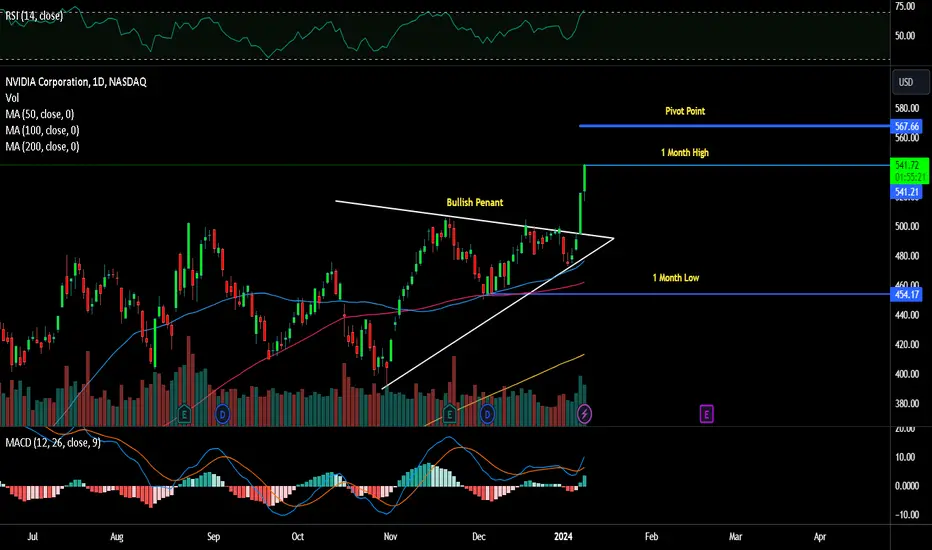
The technical analysis further supports the positive outlook for NVIDIA. The stock is in a rising trend channel, indicating positive development and increasing buy interest among investors. The recent breakout through resistance levels and the positive signal from the rectangle formation suggest a potential further rise in stock price.
In summary, NVIDIA's strategic focus on cutting-edge AI chips, its readiness to meet the demand for AI-enabled PCs, and the positive technical indicators make it a compelling investment opportunity. The company's commitment to innovation positions it well in the evolving landscape of AI-centric computing, making NVIDIA an attractive choice for investors seeking growth in the technology sector.
Nvidia
$SMCI Soaring: Riding the Waves of AI Growth and Macroeconomic
Super Micro Computer ( NASDAQ:SMCI ) has captured the spotlight with a remarkable 9.6% gain in its stock price during Tuesday's trading session. The confluence of factors driving this ascent includes favorable macroeconomic analyses, bullish sentiments from analysts in the memory-chip industry, and the ripple effect from Nvidia's recent announcements at the 2024 Consumer Electronics Show (CES). As the market absorbs these positive developments, NASDAQ:SMCI 's stock has soared approximately 279% over the past year, underscoring its status as a red-hot AI growth stock.
Macroeconomic Tailwinds:
One key driver behind Super Micro Computer's recent stock surge is the optimistic outlook stemming from macroeconomic analyses. Reports suggest that Wall Street analysts anticipate substantial rate cuts by the Federal Reserve in the coming years. This shift in policy is seen as a tailwind for growth-dependent tech stocks, including those in the artificial intelligence (AI) sector. As the macroeconomic backdrop becomes more favorable, Super Micro Computer stands to benefit from increased investor confidence and a positive environment for tech stocks.
Bullish Trends in Memory-Chip Industry:
Citigroup's bullish report on memory-chip stocks adds another layer of optimism to Super Micro Computer's outlook. The report highlights surging demand for AI services as a core catalyst for top memory-chip players. While Super Micro Computer primarily focuses on server solutions, the heightened demand for memory chips driven by AI applications is expected to contribute to the company's growth. The convergence of favorable macroeconomic conditions and increased AI-driven demand positions NASDAQ:SMCI at the forefront of a thriving industry.
Nvidia's Impact:
Nvidia, a leading player in high-performance graphics processing units (GPUs), has indirectly contributed to Super Micro Computer's upward trajectory. Although Nvidia's CES announcements may not directly impact SMCI's business, they underscore positive trends within the tech sector. As a company closely associated with server solutions, Super Micro Computer benefits from the general positive sentiment surrounding advancements in high-performance computing showcased by Nvidia. This indirect boost adds to the overall bullish narrative surrounding $SMCI.
Technical Analysis:
Super Micro Computer's technical analysis reveals a rising trend channel in the medium to long term. This indicates not only positive development but also a growing interest among investors. Breaking through resistance at dollar 310 suggests a potential for further upward movement. Volume analysis aligns well with price trends, indicating a strong and sustained momentum. The
Conclusion:
Super Micro Computer's recent stock surge is not merely a product of isolated events but a culmination of multiple favorable factors. From macroeconomic tailwinds to bullish industry trends and indirect support from Nvidia, NASDAQ:SMCI finds itself at the nexus of a flourishing tech landscape. As the company continues its ascent, investors are keenly watching, and the positive trajectory suggests that Super Micro Computer is poised for sustained growth in the dynamic world of AI and high-performance computing.


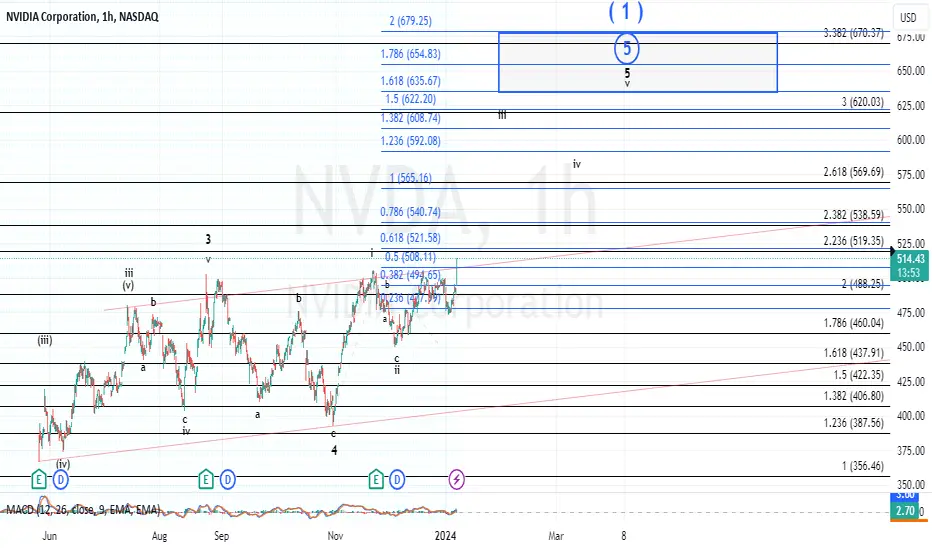
This Final wave 5 can target as high as $650With this mornings breach of $507, and as long as price is above $473, we should now be sub-dividing higher as per the chart attached in our final wave 5 advance to complete a very long term pattern and a very high potential of a MAJOR TOP.
Nvidia's Strategic Move into the Chinese AI Market
In a groundbreaking move, Nvidia, the renowned US chipmaker, is set to launch its highly anticipated China-focused AI chip, the H20, in the second quarter of 2024. This strategic development comes in response to US export rules and marks a significant step in Nvidia's commitment to maintaining its stronghold in the ever-expanding global AI hardware market.
Powerful AI Chip Tailored for China:
The H20 chip, part of a trio developed by Nvidia to meet strict regulations, boasts impressive AI capabilities. While initially scheduled for launch in November, the delay was attributed to integration issues faced by server manufacturers. Despite this setback, the chip is poised to make a substantial impact upon its release, with mass production scheduled to commence in Q2 2024.
Market Dynamics and Initial Production Volume:
Insiders reveal that the initial production volume of the H20 chip will be limited, with Nvidia focusing on fulfilling orders for major customers. This exclusivity adds an air of anticipation, hinting at the chip's potential high demand and creating a sense of urgency for investors to secure a stake in this groundbreaking technology.
Potential Reluctance in the Chinese Market:
Recent reports suggest that Chinese companies are hesitating to adopt the downgraded H20, exploring domestic alternatives amid concerns of potential tightening of US restrictions. However, the strategic move by Nvidia demonstrates its commitment to compliance, ensuring sustained access to the lucrative Chinese AI market.
Nvidia's Multi-Pronged Approach:
Apart from the H20, Nvidia has plans for two other chips, the L20 and L2, designed to comply with the latest restrictions. The chipmaker, renowned for its innovative prowess, has yet to announce the sale of any of the three chips. This silence builds anticipation and provides a unique opportunity for investors to position themselves ahead of potential market announcements.
Preserving Market Share Amid Export Restrictions:
Nvidia's bold move comes after tightening US export restrictions limited its shipment of advanced A800 and H800 AI chips. The H20, L20, and L2 chips, although featuring computing power cut back to comply with regulations, still incorporate Nvidia's latest AI features. This positions the company to preserve its market share in China, a vital market for global technology leaders.
Stock Soars on AI Demand:
Nvidia's recent stock surge, nearly tripling in value, is attributed to the growing demand for its Graphics Processing Units (GPUs) vital for AI applications. As a heavyweight in the AI sector, Nvidia's stellar performance has significantly contributed to the Nasdaq Composite's 43% rebound, showcasing the company's pivotal role in driving AI technologies forward.
Conclusion:
As the global AI hardware market continues to expand, Nvidia's strategic foray into the Chinese market with the H20 chip presents a compelling opportunity for investors. The limited initial production volume, potential hesitancy in the Chinese market, and the company's resilient stock performance underscore the unique investment prospects associated with Nvidia. In a landscape where technology stocks are poised for sustained growth, Nvidia stands out as a beacon of innovation and a promising addition to investors' portfolios.
Navigating the NVDA Stock Odyssey Unraveling the Enigma of NVDA
Nvidia ( NASDAQ:NVDA ) emerged as a beacon of success in 2023, propelling indices to new heights and securing its position as a key player. However, as we stand at the cusp of 2024, the question looms large: Will Nvidia's star continue to shine, or is a dimming inevitable?
The Bull Case for Nvidia:
Nvidia's meteoric rise in 2023, with a staggering 240% gain, positioned it as a pivotal force driving the S&P 500 and Nasdaq 100 to record highs. At the heart of this success lies the burgeoning demand for artificial intelligence (AI) and Nvidia's prowess in graphics cards and data centers. As businesses increasingly embrace AI, Nvidia stands poised to benefit from sustained chip demand, further solidifying its position as a semiconductor leader.
The gaming market, where Nvidia initially made its mark, exhibits signs of resurgence. With higher console sales, increased game purchases, and a growing player base, Nvidia's Q3 gaming revenue saw a substantial uptick. Moreover, the potential introduction of an AI-powered PC in 2024 adds another dimension to the company's growth prospects.
Nvidia's strategic investments, such as its participation in Arm Holdings' IPO, showcase a commitment to maintaining a competitive edge. The company's alignment with Arm's critical technology underscores its foresight and adaptability in the dynamic tech landscape.
The Bear Case for Nvidia:
However, amidst the optimism, concerns linger. The stock, already priced for perfection, trades at 24 times next year's earnings, 27 times sales, and 70 times free cash flow. Any hiccup in Nvidia's trajectory could lead to a significant market correction. With the U.S. restricting the sale and transfer of technology to China, which constitutes 20% of Nvidia's data center revenue, geopolitical tensions pose a tangible threat.
The PC segment, despite potential rejuvenation with the advent of AI PCs, remains in decline. The question arises: Can an AI PC reinvigorate this segment, or is it wishful thinking in the face of evolving consumer preferences?
Analysts' projections offer a glimpse into the divergent opinions on Nvidia's future. While a median 12-month price target of $650 implies a 35% upside, some foresee the stock doubling to $1,100. These projections hinge on the assumption that Nvidia will continue to dominate the AI market, projected to grow at a formidable 40.2% compounded annual growth rate between 2020 and 2027.
Conclusion:
As Nvidia charts its course in 2024, investors find themselves at a crossroads. The company's success hinges on sustaining chip demand, navigating regulatory challenges, and continuing to innovate in the ever-evolving tech landscape. The narrative of Nvidia's journey is still unfolding, with the stock testing crucial resistance levels and riding a rising trend channel. Will Nvidia's trajectory lead to new heights, or will it encounter headwinds that alter its course? Only time will unveil the next chapter in the NVDA stock saga.
Nvidia Price Action Now Has Overlap Watch Purple PathwayIn the black count, price has now overlapped on itself making this direct advance in a wave 5 higher unlikely, but not entirely dead. This could morph into an ending diagonal in which overlap is a tell tale sign...but the purple pathway looks to be the most reasonable path as of this morning.
Best to all,
Chris

Big Tech Stocks: Macro Fib SchematicsThis one might be a doozy to look at and I understand. However... Companies that make up trillions of dollars of the broader market are obviously going to be extremely complex using Mathematical Fib Schematics.
These schematics were NOT easy to organize and lay out together so give me a break.
Each one of these companies has MULTIPLE Fib tools on each of them. This is called Fibonacci Clustering. You can also call it a cluster F***...
All I can say for this one is, You either see it or you don't. I am certain of the veracity of these charts so I don't care what plebs have to say about how this looks. I am the ONLY person who has ever laid this out so perfectly you will EVER see. Quote me on it because good luck finding this material literally anywhere on the internet unless you break into Blackrock's HQ.
Easter Egg: Click Logarithmic mode on NIVIDA for an extra Fib view of why NIVIDA topped out where it did.

NVDA has yet to confirm directionAs per previous postings on my NVDA analysis, price action is still in the posture where either the purple or black counts can play out. It's prudent to remind followers that whether purple plays or black, we will eventually get new highs...however, this next high could be a major top for Nvidia as I have a full longterm count.
Weekly Chart .

The Best and Worst Trades of 2023 💪First of all… happy new year to all traders, globally!
As the year comes to an end, and the new year begins, it’s time to join us in reviewing the top trades that defined our unforgettable year together. Marked by a historic market recovery across various global asset classes, including stocks, cryptocurrencies, and bonds, 2023 has been a memorable year for all of us.
Among the best performers, the Nasdaq-100 showed an incredible run, climbing more than 50% over the course of the year, while Bitcoin emerged as another noteworthy recovery adding more than $500 billion back to its market cap. While these two stories make many headlines, there’s much more to discuss and look into. After all, that’s what markets are about - research, planning, and data to find the next great trade.
Below, we'll recap these highlights, featuring charts and statistics that explain what happened in 2023 and some emerging trends to watch in 2024.
The best trades of 2023
Long Carvana +1063%
Long Solana +994%
Long Coinbase +448%
Long Avalanche +296%
Long Nvidia +245%
Long Bitcoin +161%
Long US dollars versus Turkish Lira +57%
Long Nasdaq-100 +55%
Short Natural Gas -38%
Short VIX -45%
For those who want to see more data, we’ve created handy lists for you below. Here are the best and worst for some of the most important asset classes:
The best stocks by market cap over $5 billion:
1. Carvana +1063%
2. Bridgegbio +502%
3. Coinbase +448%
4. Affirm +464%
5. Microstrategy +360%
6. Symbotic +346%
7. Applovin +275%
8. Super Micro Computer +253%
9. NVIDIA +245%
10. DraftKings +222%
Notable: Duolingo +232%
The worst stocks by market cap over $5 billion:
1. JD -53%
2. Moderna -45%
3. Pfizer -45%
4. Dollar general -45%
5. Estee Lauder -43%
6. Bayer -35%
7. Hertz -30%
8. Nokia -30%
9. Etsy -28%
10. Alibaba -19%
Notable: NIO -18%
The best performers in crypto by market cap over $3 billion:
1. Solana +994%
2. Chainlink +191%
3. Avalanche +296%
4. Bitcoin +161%
5. Cardano +155%
6. Polkadot +103%
7. Ethereum +97%
8. Tron +92%
9. XRP +88%
10. Dogecoin +33%
The biggest changes in forex - all pairs:
1. Swiss Franc / Turkish Lira +72%
2. British Pound / Turkish Lira +67%
3. Euro / Turkish Lira +63%
4. US Dollar / Turkish Lira +57%
5. Euro / Russian Ruble +33%
6. US Dollar / Russian Ruble +29%
7. Mexican Peso / Japanese Yen +25%
8. Swiss Franc / Japanese Yen +19%
9. British Pound / Japanese Yen +15%
10. Euro / Japanese Yen +13%
The best performers in commodities:
1. Cocoa +66%
2. Cattle +23%
3. Gold +13%
4. Sugar +4%
The worst performers in commodities:
1. Natgas -38%
2. Corn -29%
3. Wheat -20%
4. Soybean -11%
Indices:
1. Merval +321%
2. Nasdaq +55%
3. NIKKEI +31%
4. S&P 500 +25%
5. IBEX 35 +21%
6. DAX40 +19%
7. Russell 2000 +18%
8. Eurostoxx 50 +17%
9. CAC40 +15%
10. Eurostoxx 600 +11%
Notables:
Hang Seng -17%
VIX -45%
Thanks for being a part of our community and we look forward to celebrating the end of 2023 and the start of 2024. For those of you who read this far down, we have a game for you – can you spot the new tool we’ve added for 2024?
Happy new year, traders! Stay tuned for more great announcements.
TradingView

NIO 9.50 THEN 10 THEN 11 LONG Trading Idea for NIO Inc. (NIO):
Long Position:
Key Points:
Electric Vehicle (EV) Growth: NIO is a key player in the electric vehicle market, and the global shift towards electric transportation provides a favorable backdrop for the company. Growing awareness of sustainability and government incentives can drive increased demand for NIO's electric vehicles.
Market Expansion: NIO's expansion beyond the Chinese market and its efforts to enter international markets, particularly in Europe, could open up new revenue streams. Positive developments in international expansion plans may boost investor confidence.
Innovative Technology: NIO's focus on innovation, including battery technology and autonomous driving features, positions the company competitively in the EV space. Positive advancements in technology may attract investors seeking exposure to cutting-edge developments.
Battery-as-a-Service (BaaS) Model: NIO's unique Battery-as-a-Service model, allowing customers to purchase electric vehicles without the battery, could appeal to cost-conscious consumers and potentially expand NIO's market share.

NVDA: $194M Insider LiquidationNVIDIA is presenting potentially lucrative short-term trading opportunities, specifically for derivatives. A months-long ascending triangle is visible on the hourly and daily charts; a second, smaller ascending triangle is potentially forming at the time of this idea.
I believe, and am hopeful for, that the smaller ascending triangle will prove invalid and complete the double-top "M" pattern with selling pressure draining NVDA to the $430 range which falls around the respective 61.8% Fibonacci retracement level. However, I think it would be reckless to count out a potential rebound around $470 which is where the second ascending triangle's support will be tested.
If the $430 support is reached, I believe this will be the time to enter a long call option as I suspect the asset will be retesting the $500 resistance. However, insider liquidation is a major concern especially since the total offload within the last 30 days is equal to $194.3M USD. A link to the SEC filings is posted below.
NASDAQ:NVDA
www.sec.gov

Continued bull market??Hello!
I am a big fan of the Elliott wave principle, which I find very interesting and useful for market analysis. I have developed my analytical approach by combining this principle with my personal experience and considering various scenarios that could occur in the market.
While I would like to share my analysis with you, please note that I am not providing a buy or sell signal. My primary intention is to share my unbiased analysis so that you can utilize it as a guide to make an informed decision.
To build your confidence in my analysis, I always share my previous analysis from the same market so that you can compare and see the progress. All the details of my analysis are clearly labeled, which should make it easy for you to understand.
I hope that my analysis is useful to you in your business journey, and I wish you all the best.
I am looking forward to hearing from you. Lastly, I would like to mention that like-mindedness and support, comments, and likes are the most important pillars of progress, just like support points in the financial markets. They give me the energy to continue and share more ideas with you.
Sincerely

Will $NVDA head South?[ Short-term Analysis]Okay, let's analyze this quickly.
Because the current Bull Momentum of @Nvidia is in harmony, we need to wait for the price to react (badly) to the green line on the chart before considering a SELL.
On the flip side, since the price is currently respecting the resistance line of the previous horizontal channel, we will have to wait before considering a BUY. (Actually, if you're holding a BUY order from before and set a stop loss accurately - a stop loss level below the green line, you still have a decent profit.)
WHAT A WISE TRADER DOES?
Kinda boring to remind you of this for the third time in the day, but … stay put may be the best decision.
If you're holding a Buy position : Move the stop loss to a safe point to preserve profits.
If you're holding a Sell position : Uhm... set the stop loss carefully.
If you haven't done anything yet? Well, just continue not doing anything!

Nvidia - Watch The Channel PatternHello Traders, welcome to today's analysis of Nvidia.
I will only take a trade if all the rules of my strategy are satisfied.
Let me know in the comment section below if you have any questions.
Keep your long term vision.

Nvidia decides to keep us guessingThe last time I updated Nvidia I stated that below 459 there is a higher chance we decline closer to $400.
Read my last update here.
Price did decline to breach $459 and we have subsequently moved to the upper trading ranges but have yet to make a new high. Below the previous all-time high of approximately $506 I still favor a move down closer to the $400 area.

🔝 Nasdaq-100 Index: The House of Rising SunThe History is happening right here! ✨
Nasdaq-100 Index NASDAQ:NDX just set its Best First Half in almost 40 years since inception in 1985, with amazing 38.75% year-to-date return in 2023.
Among all semi-annual results, Nasdaq-100 gain this year is second only to the year of 1999.
With historical 61.44% gain in the second half of 1999, glory times shortly ended. Just two months later in the 1st quarter of 2000 index peaked at 4816.15, for the next 15 plus years.
As 38.75% surge in 2023 still far away from the All-the-history record 61.44% in 1999, stocks feel this year like they are, as the great 1960's band "The Animals" said, in the House of the Rising Sun. They won the race, and closed the 1st half of the year with solid gains.
Let's take a look and congratulate the winners of the race! ✨
🥇 The 1st place - Nvidia Corporation, 184.84% YTD return NASDAQ:NVDA
Nvidia is the clear winner in the AI arms race so far. It's the company that appears best positioned to dominate the burgeoning sector, and more and more investors continue to wake up to the potential of artificial intelligence.
Nvidia effectively provides a one-stop shop for what customers need to drive their AI ambitions. They control their entire ecosystem on both hardware and software, similar to Apple, and that puts them years ahead of competitors.
🥈 The 2nd place - Meta Platform Incorporation, 133.66% YTD return NASDAQ:META
Meta Platforms stock jumped this year after the tech giant's first-quarter earnings beat Wall Street's expectations. CEO Mark Zuckerberg also touted the tech giant's AI plans, and pledged to keep costs low as the owner of Facebook, WhatsApp and Instragram continues its "year of efficiency."
In a post-earnings call, Mark Zuckerberg hailed the company's AI efforts and vowed to keep a lid on spending. The Meta founder and CEO said AI recommendations had led to people spending over 24% more time on Instagram since it launched TikTok rival Reels.
🥉 The 3rd place - Tesla Incorporation, 120.88% YTD return NASDAQ:TSLA
Tesla's stock price has been rallying non-stop for months - and Wall Street is starting to ponder whether that breakneck surge might've made the EV stock a little overvalued.
Shares have jumped 57% since late April, with investors cheered by CEO Elon Musk signing charging deals with Ford and GM, while Big Tech stocks have also soared more broadly thanks to the rise of AI as an investment theme.
The stock just has settled its best two-quarter advance since 2020.
But Barclays, Morgan Stanley, and Goldman Sachs have each questioned that valuation over the past two weeks, with all three banks slashing their Tesla rating from "buy" to "hold".
Unprecedented dominance
It's historically rare for a handful of stocks from the same sector to make up such a large part of the S&P500 ( SP:SPX ).
The last time the five biggest companies by valuation accounted for a quarter of the index's total market cap was indeed the 1960s.

Beating SP500 with SP500: Outperformed The Index Its Own WeaponsHi, all.
Hope you're doing well.
Looks like a good time to share a summary of a post I made almost a few years ago about SP500 stocks, 23.02.2022. Back then, I relied solely on technical analysis. Fast forward two years and the majority of my picks have proven to be quite accurate, showcasing the effectiveness of technical analysis in investing.
While the SP500 gained around 10%, my selected stocks outperformed with an impressive 35% gain. Out of the 75 stocks I handpicked, 51 are currently in profit, 12 are in the red, and the rest didn't reach enough close to the zone or haven't made a breakout yet. So 63 has triggered and it will give a winning percentage of more than 80%. I'm okay with that.
These results show the importance of technical analysis in making informed investment decisions. It's a clear example of how understanding market trends and patterns can lead to substantial gains, even when ignoring company fundamentals.
These results challenge the notion that picking individual stocks is fairly difficult to beat market averages. Instead, it demonstrates that with the right skills and a strategic approach to technical analysis, it's not only possible but achievable.
I'm excited about these outcomes and look forward to further refining my strategies in the ever-evolving world of finance.
Results are calculated by purchasing with an equal amount of money from every area that I drew and holding these until today (started to make this post quite a few days ago so it can add a bit of variation).
If the price falls through the box and comes back afterward then I always calculate from the middle of the box that purchase price. If I had done it at the best possible price then these results would have been significantly better. I did it the optimal way, you will see yourself...
1. AAPL - a load-it-up type of thing has worked out nicely. Used previously worked resistance levels. If the stocks performing well and the market cap is big then these levels can help you to get on board.
Current profit 42%
Before:
After:
2. ADBE - came down quite roughly but it found support and back above fairly quickly.
Current profi 67%.
Before:
After:
3. AMD - round nr., strong resistance level becomes support and the climb can continue.
Current profit 80%
Before:
After:
4. AMZN - split. Came down from high prices to the marked levels and those who were patient enough got rewarded nicely.
Current profit 34%
Before:
After:
5. ANET - retest of the round nr. worked perfectly, as a momentum price level, after the strong breakout.
Current profit 143%
Before:
After:
6. APTV: Came down quite sharply and it will take some time to start growing from here, if at all.
Current loss -2%
Before:
After:
7. AXP - firstly the round nr. 200 worked as a strong resistance level. Another example is to avoid buying if the stock price approaches bigger round numbers the first time. Came to a previous resistance level and rejection from there…
Current profit 34%
Before:
After:
8. BIO - in general I like the price action, kind of smoothly to the optimal zone. It might take some time to start growing from here but also fundamentals need to look over.
Current loss 13%
Before:
After:
9. BLK - kind of flawless. Worked perfectly.
Current profit 48%
Before:
After:
10. BLL - a perfect example of why you should wait for a breakout to get a confirmed move. No trade.
Before:
After:
11) Berkshire Hathaway (BRK.B) - Buy the dip. Again, as Apple, a big and well-known company - all you need to do is to determine the round numbers and small previous resistances that act as support levels.
Current avg. profit from two purchases 28%
Before:
After:
12) Cardinal Health (CAH) - the retest isn't as deep as wanted but still a confirmed breakout and rally afterward.
Before:
After:
13) Ceridian HCM Holding (CDAY) - found support from the shown area but not much momentum.
Current profit 33%
Before:
After:
14) Charter Communications (CHTR) - technically speaking it is a quite good price action but kind of slow momentum from the shown area. So, it can take some time if the fundamentals are ok.
Current loss -14%
Before:
After:
15) Comcast Corp. (CMCSA) - got liquidity from new lows, pumped up quickly, and is currently fairly solid.
Current profit 16%
Before:
After:
16) Cummins (CMI) - close one, got rejected a few points before my shown area from the first role reversal (old resistance becomes support)
Before:
After:
17) Salesforce.com (CRM) - perfect. 50% drop, strong horizontal area, and mid-round nr did the work.
Current profit 74%
Before:
After:
18) Cisco Systems (CSCO) - worked and slow grind upwards can continue.
Current profit 18%
Before:
After:
19) Caesars Entertainment (CZR) - not in good shape imo. It has taken too much time and the majority of that is sideways movement.
Current loss 4.8%
Before:
After:
20) Devon Energy (DVN) - inside the area and actually active atm. Still, now I’m seeing a bit deeper correction than shown.
Before:
After:
21) Electric Arts (EA) - waiting for a breakout. It will come and it will be strong afterwards!
Before:
After:
22) eBay (EBAY) - inside the area but yeah, looks like not much power there.
Before:
After:
23) Enphase Energy (ENPH) - got a breakout, got a retest, and did ~70% rally after that! If you still hold it, as I do statistics, then…
Current loss -30%
Before:
After:
24) Expeditors International of Washington (EXPD) - kind of worked but didn't reach. No trade.
Before:
After:
25) Meta Platforms (META) - one of the best examples that you want to be in the markets and technical areas should give you the confidence to make your move! Run through the area but very quick and consistent comeback.
Current profit 86%
Before:
After:
26) FedEx (FDX) - I love the outcome of this. Very solid price action and multiple criteria worked as they should. Perfect.
Current profit 65%
Before:
After:
27) First Republic Bank (FRC) - firstly got a solid 30 to 35% gain from the shown area but...we cannot fight with the fundamentals.
Current loss 99%
Before:
After:
28) General Motors (GM) - slow but has started to show something.
Before:
After:
29) Alphabet (GOOG) - load it up 3.0, a good and strong company, and use every previous historical resistance levels to jump in.
Current avg. profit after three different price level purchases 32%
Before:
After:
30) Genuine Parts (GPC) - rallied quite strongly without a retest but now has started to approach my shown level.
Before:
After:
31) Goldman Sachs (GS) - really close one but still count it in.
Current profit 33%
Before:
After:
32) Hormel Foods (HRL) - quite bad performance here. Two trades, two losses.
The current loss combined these two together is 35%
Before:
After:
33) Intel (INTC) - one of my favorites again. Looks like the zone is in the middle of nowhere but the rejection came exactly from the box with good momentum in it.
Current profit 64%
Before:
After:
34) Ingersoll Rand (IR) - sweeeet!
Current profit 87%
Before:
After:
35) Intuitive Surgical (ISRG) - the trendline, 50% drop, strong horizontal area. Ready, set, go! Sweeet 2.0 ;)
Current profit 62%
Before:
After:
36) Johnson Controls International (JCI) - the retest worked quite nicely but did not have enough momentum. So probably it moves sideways for a while.
Current profit 14%
Before:
After:
37) Johnson & Johnson (JNJ) - Buy the dip and we had only one dip :)
Before:
After:
38) CarMax (KMX) - the area is strong but not enough momentum in it so I take it as a weakness.
Before:
After:
39) Kroger Company (KR) - breakout occurred, retest also but nothing more to say.
Current loss -6%
Before:
After:
40) Lennar Corp. (LEN) - strong resistance level becomes strong support.
Current profit 133%
Before:
After:
41) LKQ Corp. (LKQ) - haven’t reached yet but still, it should be solid.
Before:
After:
42) Southwest Airlines (LUV) - no breakout = no trade! Don’t cheat! Your money can be stuck forever but in the meantime, other stocks are flying as you also see in this post. If there is a solid resistance, wait for the breakout and possibly retest afterward!
Before:
After:
43) Las Vegas Sands (LVS) - channel inside a channel projection ;) TA its own goodness!
Current profit 60%
Before:
After:
44) Microchip Technology Incorporated (MCHP) - nice one!
Current profit 67%
Before:
After:
45) Altria Group (MO) - got a decent break but lacked momentum after that and sideways movement can continue.
Current loss -11%
Before:
After:
46) Moderna (MRNA) - still inside a quite wide zone but nothing too exciting from my point of view.
Before:
After:
47) Morgan Stanley (MS) - the first stop has worked, and got some movements.
Current profit 27%
Before:
After:
48) Microsoft (MSFT) - Load it up 4.0, buy the dip has worked again with well-known stock.
Three purchases and avg. return from these are amazing 54%
Before:
After:
49) Match Group (MTCH) - if I look at it now then I don’t really like this chart at the beginning but it is what it is and we accept the loss.
Current loss -57%
Before:
After:
50) Netflix (NFLX) - almost the same as Meta. Came quite sharply but the recovery has been also quick. Another proof that you want to be on the market if these rallies occur.
Current profit 62%
Before:
After:
51) NRG Energy (NRG) - wait for the retest
Before:
After:
52) NVIDIA (NVDA) let this speaks for itself!
Current profit 200%
Before:
After:
53) NXP Semiconductors (NXPI) - usually the sweet spot stays in the middle of the box, and also as I look over these ideas quite a few have started to climb from the first half of the box.
Current profit 72%
Before:
After:
54) Pfizer (PFE) - yeah, got rejected after it came to retest the area the first time to around 30% but after that - slow death.
Current loss -29%
Before:
After:
55) PerkinElmer - “after” is EUR chart but you get the point.
Before:
After:
56) Pentair (PNR) - worked correctly, 50% drop combined with the horizontal area, easily recognizable, and the result is quite okay.
Current profit 65%
Before:
After:
57) Public Storage (PSA) - slowly has fallen to the zone and first impressions are on the chart already.
Current profit 20%
Before:
After:
58) PayPal (PYPL) - the area just lowers the speed of dropping :)
Current loss -29%
Before:
After:
59) Qorvo (QRVO) - it can be a “late riser”, let’s see.
Current profit 24%
Before:
After:
60) Rockwell Automation (ROK) - sweet, worked again like a charm.
Current profit 52%
Before:
After:
61) Rollins (ROL) - after posting it didn’t come to retest the shown area. Being late for a couple of weeks. Worked but cannot count it in, the only thing I can count is that my bias was correct ;)
Before:
After:
62) Snap-On Incorporated (SNA) - same story!
Before:
After:
63) Seagate Technology (STX) - firstly it came there! Look how far it was, the technical levels are like magnets, the price needs to find some liquidity for further growth and these areas can offer it. I like this, and the climbing can continue.
Current profit 42%
Before:
After:
64) Skyworks Solutions (SWKS) - one of the textbook examples of how trendline, 50 drop, round nr. and strong horizontal price zone should match. A bit slow but oohhh boy I want this will play out. I have talked about this idea in several presentations and it is kind of a perfect example of how these criteria can determine the strongest zone on the chart!
Before:
After:
65) TE Connectivity (TEL) - came down, and got a rejection. “Simple” as that.
Current profit 34%
Before:
After:
66) Thermo Fisher Scientific (TMO) - mister Ranging Market. Nothing but last month got a bit of volume from the liquidity zone and let’s see what it can do.
Before:
After:
67) Trimble (TRMB) - currently up but the price action signs that it can stay ranging for some time.
Current profit 19%
Before:
After:
68) Tesla (TSLA) - made a split. Have been successfully recommended many times after that here and there but two years ago was these price levels and..
The current profit after two purchases is 16%
Before:
After:
69) Train Technologies (TT) - dipped the box and off it goes!
Current profit 91%
Before:
After:
70) Take-Two Interactive Software (TTWO) - I like this analysis a lot. Worked as a clockwork.
Current profit 60%
Before:
After:
71) United Rentals (URI) - scam :) have some closest calls counted in and here is another one.
Current profit 128%
Before:
After:
72) Waters Corp. (WAT) - came to the box as it should be slow and steady. As the plane came to the runway.
Current profit 33%
Before:
After:
73) Exxon Mobil Corp. (XOM) - another escaped winner. Didn’t come down to retest my retest area so, missed it.
Before:
After:
74) Xylem (XYL) - nice to see that the majority of these areas are working very nicely!
Current profit 49%
Before:
After:
75) Autodesk (ADSK) - slowly, slowly but worked and climbing from the shown area.
Current profit 42%
Before:
After:https://www.tradingview.com/x/qRJaz6rI/
As we summarise this journey through the past two years of market analysis and stock picking, it's clear that the power of technical analysis has been a guiding force in achieving remarkable results.
As said, these chartings are made solely based on technical analysis but if you add here a bit of fundamentals then these results can be much better. Probably would have avoided some losses. If possible, always use both analyses. Let this post prove to you that technical analysis works in most cases and helps you find good entry points. These areas act like magnets. Sooner or later the price will still reach these levels. I like this saying a lot and I will end my post with it: fundamental analysis tells you what to buy, technical analysis tells you when to buy!
Hopefully, you liked this post, learned something from it and if it isn't too much to ask then which one was your favorite?
Take care & happy trading,
Vaido

Nvidia Wycoff AnalysisA: Find a new resistance, volume was high too
B: Test and failed the resistance
C: Attemp to break but it won't even be near
D: Fail at the support zone
E: Break heavily with a high volume
F?: It could be a pullback to the break to immediatly continue failing to the next support zone

Jump on Nvidia’s Pullback: The AI Powerhouse Set for a Comeback
After rising more than threefold, Nvidia (NVDA) stock is pulling back, as uncertainty rises, and many investors take profit.
However, while it may be a while before shares triple in price again, much suggests that this top AI chip play could again perform strongly in 2024.
With this, instead of cashing out/sitting on the sidelines, you may want to enter/add to a NVDA position instead.
Why Enthusiasm is Sliding for This AI Chip Winner
Nvidia is far and away the leading supplier of chips for the generative artificial intelligence market. Booming demand for these chips has resulted in sales rising by triple-digits on a year-over-year basis, with sequential sales growth set to keep rising by a double-digit pace.
Earnings have increased by an even greater extent. Analysts forecast Nvidia’s earnings this fiscal year (ending January 2024) to rise nearly sevenfold compared to FY2023. So then, instead of having continued enthusiasm for NVDA stock, why is the excitement simmering down? Two uncertainties keep weighing on shares.
The first concern is uncertainty surrounding interest rates. If the Federal Reserve lowers rates next year, that’s good news for both chip demand, and for Nvidia’s valuation. However, if rates remain at elevated levels, this could slow down a rebound in non-AI chip demand, affect future AI-related chip sales growth, and limit the extent in which NVDA’s earnings multiple could re-expand.
Technical Analysis
Nvidia Stock movement is indicating a head and shoulder trend with the trough and crest touching the resistance and support level.
NVDA is trading near the top of its 52-week range and above its 200-day simple moving average.
Investors have been pushing the share price higher, and the stock still appears to have upward momentum.

AMD Surges After Launching AI chip that Could Challenge NvidiaAMD unveiled its MI300X chip, an AI-centered semiconductor designed to challenge Nvidia's global market dominance.
Advanced Micro Devices (NASDAQ: AMD) shares jumped in early Thursday trading after the semiconductor group unveiled an AI-focused chip for the data-center market, which it says could be valued at as much as $45 billion over the coming years.
AMD, which in June pegged the total addressable market for data-center chips at around $30 billion, launched the MI300X chip, designed to support generative-artificial-intelligence technologies. And it unveiled a next-generation semiconductor focused on supercomputing, the Instinct M1300A.
The MI300X, analysts say, could challenge Nvidia's NVDA dominant H100 graphics-processing-unit chip in the large-language-model AI market. Last month, AMD said the new chip could generate $400 million in fourth-quarter sales while the broader family of MI300 semis are expected to see sales of more than $2 billion over the whole of 2024.
Large language models "continue to increase in size and complexity, requiring massive amounts of memory and compute,” CEO Lisa Su said during last night's launch event at the company's Santa Clara, Calif., headquarters. “And we know the availability of GPUs is the single most important driver of AI adoption.”
Advanced Micro Devices shares were marked 2% higher in premarket trading to indicate an opening bell price of $119.12 each. Such a move would nudge the stock into positive territory for the past six months.
AMD last forecast fourth-quarter sales in the region of $6.1 billion, plus or minus $300 million, with gross margins of around 51.5%. That outlook following a mixed third-quarter-earnings report that showed big gains in PC revenue had partly offset the ongoing decline in gaming.
"While AMD acknowledged that its software can be further improved, it has reached the point of being 'good enough' for volume deployment," said KeyBanc Capital Markets analyst John Vinh. He reiterated his overweight rating on the stock following last night's launch event.
"We're encouraged that AMD has released a competitive AI GPU within a massively fast-growing (total addressable market), with endorsements by many high-profile customers," he added.
Technical Analysis
The RSI (14) is at 56.52, indicating a bullish momentum. The MACD (12,26) is at 0.68, suggesting a positive trend. AMD is trading near the top of its 52-week range and above its 200-day simple moving average.
Investors have been pushing the share price higher, and the stock still appears to have upward momentum. This is a positive sign for the stock's future value.

Shorting NVDA. Try #2!If at first you don't succeed....
Traders,
You know I tried this once already. Got stopped out for a loss and honestly, I've been annoyed since. So yeah, this is kind of an revenge trade. Not a good example of how you should trade kids. But again, this is all for your entertainment anyways as I've said all along.
Anywho. Here we are at the bottom of my channel. Patent retest!
Also, I've redrawn the H&S neckline in a way that does not show confirmation on the daily. That right shoulder looks wonky (sometimes it does), but still appears to be forming. Am I a product of my own confirmation bias. Probably. Time will tell.
30%+ Potential profit on this trade.
$460 Entry
$317 Target
$480 SL
7/1 RRR
Def not fin advice.
LFG!
Stewdamus

HPE and Nvidia Team Up for Full Stack Generative AI SolutionHewlett Packard Enterprise (HPE) and Nvidia, two industry giants renowned for their cutting-edge technologies, have joined forces to build a groundbreaking full stack generative AI solution. This collaboration is set to revolutionize the way we approach AI, opening up new realms of possibilities and transforming industries across the globe.
By combining HPE's expertise in high-performance computing and data center solutions with Nvidia's unmatched prowess in AI and accelerated computing, this dynamic partnership promises to deliver an all-encompassing AI infrastructure that is both powerful and efficient. The full stack generative AI solution will empower businesses to unlock the true potential of AI, enabling them to develop innovative applications, drive operational efficiencies, and gain a competitive edge in today's fast-paced market.
This remarkable collaboration signifies a major milestone in the AI landscape, as it brings together the best of both worlds. HPE's deep-rooted experience in delivering scalable infrastructure solutions, coupled with Nvidia's groundbreaking GPU technology, will create a synergy that is simply unparalleled. Together, they will pave the way for groundbreaking advancements in AI research, development, and deployment.
Now, you may be wondering, "How can I be a part of this exciting development?" Well, as an astute trader, you understand the value of seizing opportunities at the right time. Nvidia, being at the forefront of AI innovation, is poised for remarkable growth as a result of this collaboration. Therefore, I encourage you to consider adding Nvidia to your portfolio, as it has the potential to benefit significantly from this game-changing partnership.
As we witness the birth of a transformative full stack generative AI solution, it is crucial to stay ahead of the curve and invest wisely. By positioning yourself strategically, you can potentially reap substantial rewards in the coming months and years.
So, let's embark on this exhilarating journey together! Take a moment to evaluate the potential of Nvidia and consider adding it to your trading portfolio. As always, thorough research and analysis are key to making informed decisions, so ensure you carefully assess the opportunities and risks involved.
If you have any questions or require further information, please do not hesitate comment below. I am here to assist you in any way I can.
Wishing you an exciting and prosperous trading journey!
