Nvidia - This is clearly not the end!📐Nvidia ( NASDAQ:NVDA ) will confirm the breakout:
🔎Analysis summary:
Over the past couple of months, Nvidia managed to rally about +100%, reaching top 1 of total market cap. Most of the time such bullish momentum just continues and new all time highs will follow. But in order for that to happen, Nvidia has to confirm the all time high breakout now.
📝Levels to watch:
$150
🙏🏻#LONGTERMVISION
SwingTraderPhil
Nvidiaanalysis

NVIDIA Robbery Plan: Bullish Swing Trade to Millions!🔥 NVIDIA (NVDA) Stock Heist Blueprint: Unlock Bullish Profits with Thief Trading Style! 🚀💰
🌟 Greetings, Wealth Warriors! 🌟
Hello, Ciao, Salaam, Bonjour, Hola, and Hallo to all you savvy traders and market masterminds! 🤑💸 Get ready to execute a high-octane trading plan with our Thief Trading Style—a bold fusion of technical precision and fundamental insights designed to crack the NVIDIA (NVDA) stock market vault! 💥📈
📝 The NVIDIA Heist Plan: Swing & Day Trading Mastery 🏆
Based on our proprietary Thief Trading Style, this plan targets NVIDIA (NVDA), currently riding a bullish wave fueled by strong fundamentals and technical setups. Follow the strategy outlined below to navigate the high-risk Red Zone—where overbought conditions, consolidation, and potential trend reversals create opportunities for sharp traders. 💪 Stay alert, as bearish players may set traps at key levels! 🕵️♂️
Entry Strategy: Crack the 🙂Vault! 🏦
Go long with confidence! The market is primed for a bullish breakout. Enter at current prices or set buy limit orders near recent swing lows/highs on the 15-minute or 30-minute timeframe. 📅
Pro Tip: Set price alerts on your chart to catch the optimal entry. Timing is everything in this heist! ⏰
Swing Traders: Look for pullbacks to key support levels for safer entries.
Scalpers: Focus on quick long-side trades with tight stops to maximize gains. 💨
Stop Loss: Protect Your Loot! 🔒
Place your stop loss (SL) below the recent swing low on the 30-minute timeframe (e.g., $162.00 for swing trades).
Adjust your SL based on your risk tolerance, position size, and number of orders. For larger accounts, consider tighter stops to lock in gains early. 🛡️
Scalpers: Use a trailing stop to secure profits while riding short-term momentum.
Take Profit Target: Cash Out Big! 💰
Aim for $191.00 as the primary target, or exit early if momentum slows.
Swing Traders: Hold for the full target if the trend remains strong.
Scalpers: Grab quick profits on smaller price spikes and re-enter on dips.
Pro Move: Use a trailing stop to let profits run while safeguarding gains. 🚀
📌Key Levels & Risk Management
Entry Zone: Market price or swing low – ideal for long positions. 📈
Stop Loss: $162.00 – based on 30m timeframe swing low. 🛑
Take Profit Target: $191.00 – primary target for swing/day trades. 🎯
Risky Red Zone: Overbought levels – watch for consolidation or reversal traps. ⚠️
💡 Why NVIDIA? The Bullish Case 📡
NVIDIA (NVDA) is powering through a bullish phase, driven by:
Fundamentals: Strong demand for AI, gaming, and data center chips. 📊
Macro Factors: Positive market sentiment and tech sector momentum. 🌍
COT Data (Latest Friday Update, UTC+1): Large speculators are increasing bullish positions, signaling confidence in NVDA’s upside (data sourced from reliable platforms). 📅
Geopolitical & News: Monitor upcoming earnings and industry developments for catalysts. 📰
Intermarket Analysis: Tech-heavy indices like the NASDAQ are trending higher, supporting NVDA’s rally. 📈
For a deeper dive, check fundamental reports, COT data, and sentiment analysis to align your trades with the bigger picture. 🔍
⚠️ Trading Alert: Navigate News & Volatility 🗞️
News releases can spark sharp price swings. To protect your capital:
Avoid new trades during major news events (e.g., earnings or Fed announcements). 🚫
Use trailing stops to lock in profits and limit downside risk. 🔐
Stay updated with real-time market developments to adjust your strategy dynamically. 📡
🚀 Boost the Heist! Support the Thief Trading Community 🤝
Love this plan? Hit the Boost Button to amplify our Thief Trading Style and empower our community to conquer the markets! 💥 Every like and share fuels our mission to make money with precision and style. 💪 Join us daily to unlock more high-profit heist plans! 🏴☠️
📌 Important Disclaimer
This analysis is for educational purposes only and not personalized investment advice. Always conduct your own research, assess your risk tolerance, and verify market conditions before trading. Markets move fast—stay sharp and adapt! ⚡
🌟 Stay tuned for the next heist plan, traders! Let’s keep stealing profits together! 🤑🐱👤🎉

Nvidia (NVDA) Share Price Surges Above $170Nvidia (NVDA) Share Price Surges Above $170
Yesterday, Nvidia’s (NVDA) share price rose by more than 4%, with the following developments:
→ It surpassed the psychological level of $170 per share;
→ Reached another all-time high;
→ Gained more than 9% since the beginning of the month.
The bullish sentiment is driven by Nvidia CEO Jensen Huang’s visit to China shortly after meeting with US President Trump. At the same time:
→ US Secretary of Commerce Howard Lutnick stated that the planned resumption of sales of Nvidia H20 AI chips in China is part of the US negotiations on rare earth metals.
→ The head of Nvidia stated that he was assured licences would be granted very quickly, and that a large number of orders for H20 chip deliveries had already been received from Chinese companies.
Market participants are viewing the situation with strong optimism, and analysts are raising their valuations for NVDA shares:
→ Morningstar analysts raised their fair value estimate for Nvidia shares from $140 to $170.
→ Oppenheimer analysts increased their target price from $170 to $200.
Technical Analysis of the NVDA Chart
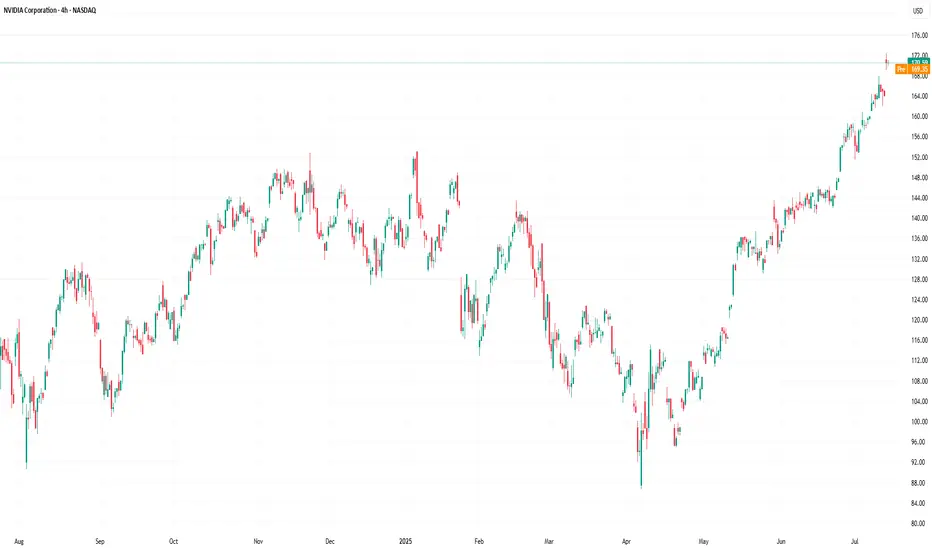
The price trajectory of NVDA shares fully reflects the exceptionally strong demand:
→ The price is moving within an ascending channel with a steep growth angle;
→ Since early May, the RSI indicator on the 4-hour chart has not fallen below the 50 level;
→ Yesterday’s trading session opened with a large bullish gap.
The chart also shows the formation of a stable bullish market structure (shown with a purple broken line), expressed through a sequence of higher highs and higher lows.
Given the above, it is difficult to imagine what might cause a sharp shift from positive to negative sentiment. If a correction begins (for example, with a test of the $160 level), traders should watch for signs of its completion — this could present an opportunity to join the emerging rally.
This article represents the opinion of the Companies operating under the FXOpen brand only. It is not to be construed as an offer, solicitation, or recommendation with respect to products and services provided by the Companies operating under the FXOpen brand, nor is it to be considered financial advice.
Nvidia - New all time highs!Nvidia - NASDAQ:NVDA - breaks out now:
(click chart above to see the in depth analysis👆🏻)
Within two and a half months, Nvidia rallied more than +70%. Following this recent bullish strength, a retest of the previous highs was totally expected. But this does not seem to be the end at all. There is a much higher chance that we will see new all time highs soon.
Levels to watch: $150
Keep your long term vision🙏🙏
Philip (BasicTrading)

NVIDIA(NVDA) Jackpot – Thief Trading Blueprint for Fast Profits!🚀 NVDA Stock Heist: The Ultimate AI Gold Rush (Scalping/Day Trade Plan)
🌟 Hey there, Market Pirates! 🏴☠️💰
Thieves, Traders, and Money Makers—gather around! Based on the 🔥Thief Trading Style🔥, here’s our master blueprint to loot NVIDIA’s AI-fueled rally. Follow the strategy on the chart—long entry is LIVE! Our escape? Near the high-risk Resistance Zone. Overbought? Consolidation? Reversal trap? Bears are lurking, but we’re stealing profits first! 🎯💸
🎯 Entry (The Vault is Open!)
"Swipe the AI gold at any price—the heist is ON!"
Pro Tip: Use buy limits within 15-30min near swing lows/highs for pullback entries.
🛑 Stop Loss (Thief’s Escape Route)
SL at recent swing low (4H timeframe)—adjust based on your risk & lot size.
Scalpers/Day Traders: Tighten SL if stacking multiple orders.
🏆 Target 🎯: 165.00 (The AI Jackpot!)
📈 Why NVDA?
Bullish momentum from AI dominance, earnings hype, and institutional FOMO.
Tech sector strength + chip demand = THIEF’S PARADISE.
📰 Fundamental Heist Intel
Need macro trends, sentiment, and intermarket analysis? 🔗 Check our bioo for the full robbery toolkit.
⚠️ Trading Alert: News & Position Control
Avoid new trades during earnings/news—volatility kills heists!
Trailing SLs = Locked profits. Don’t get greedy!
💥 Boost This Heist!
👊 Hit "Like" & "Boost" to fuel our next raid. Every click = More stolen profits! 🚀💰
🤑 Stay tuned—more heists coming! NVIDIA today… what’s next? 🤫🐱👤

Nvidia (NVDA) Share Price Soars to Record HighNvidia (NVDA) Share Price Soars to Record High
Yesterday, Nvidia’s (NVDA) share price surged by over 4%, with the following key developments:
→ It broke through the psychological $150 per share level;
→ It reached a new all-time high;
→ It also contributed to the Nasdaq 100 index hitting a record peak, as we reported earlier this morning.
As a result, Nvidia has reclaimed its status as the world’s most valuable company. Demand for its shares is being fuelled by the CEO’s optimism.
“We have many growth opportunities across our company, with AI and robotics the two largest, representing a multitrillion-dollar growth opportunity,” said Jensen Huang at Nvidia’s annual investor conference.
Technical Analysis of the NVDA Chart
The last three candlesticks reflect strong demand, as:
→ There are bullish gaps between the candles;
→ Lower wicks are either absent or minimal;
→ Candles are closing near their highs with progressively widening spreads.
This suggests strong momentum as the price confidently breaks through the key $150 resistance level. It is reasonable to assume that the current imbalance in favour of buyers around the $146–150 area (highlighted in purple) may form a support zone in the event of a pullback — for instance, within the existing upward channel (shown in blue).
This article represents the opinion of the Companies operating under the FXOpen brand only. It is not to be construed as an offer, solicitation, or recommendation with respect to products and services provided by the Companies operating under the FXOpen brand, nor is it to be considered financial advice.

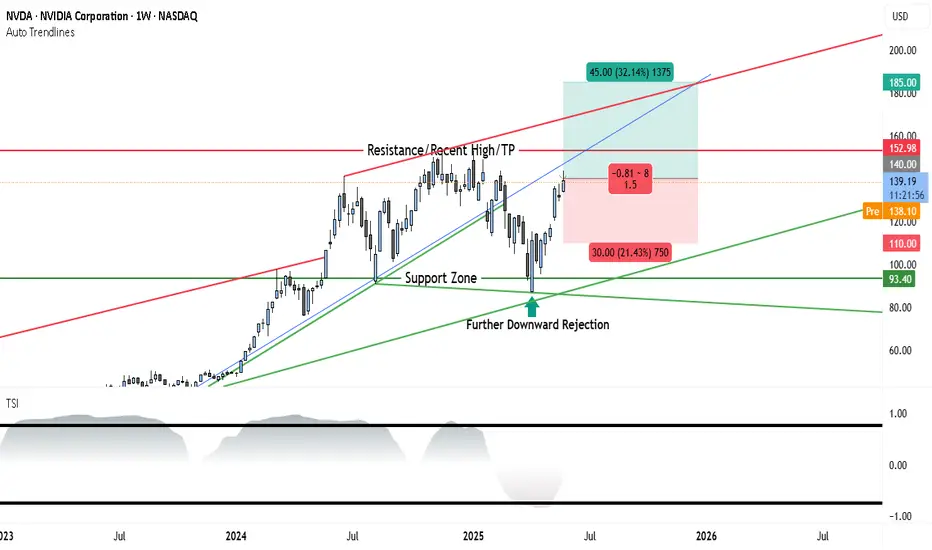
NVIDIA Stock Weekly Outlook: Support Holds Strong as $185 TargetThe weekly chart of NVDA shows a strong continuation pattern forming after a period of consolidation and a healthy pullback. The recent price action confirms a bullish stance, with a fresh bounce off support and momentum gradually shifting in favor of the bulls.
________________________________________
Long-Term Uptrend Confirmed
The blue ascending trendline drawn from early 2023 remains intact, showing that the overall trend is still bullish. NVDA has respected this trendline multiple times, with each touch followed by a renewed upward move. This week, the price rebounded once again near this trendline, confirming its role as dynamic support and signaling renewed buying interest.
________________________________________
Resistance and Breakout Potential
The key resistance level is marked at $152.98, which represents the recent weekly high and a psychological barrier. This level has acted as a ceiling in past attempts, but the current structure and momentum suggest a potential breakout if volume confirms. Above this level, there's clear air up to $185, where the next major resistance sits, and which also acts as the projected target in this trade setup.
________________________________________
Support Holding Strong
A strong support zone around $93.40 is clearly defined and has already triggered multiple rejections. NVDA recently saw a sharp bounce from this zone after a downward rejection, signaling that institutional buyers may be active here. This area is the foundation of the current bullish case.
________________________________________
Momentum Turning Favorably
The True Strength Index (TSI), shown at the bottom of the chart, is emerging from a low region. While not yet fully bullish, the indicator is starting to turn upward, suggesting early signs of momentum building. If TSI crosses above the midline in coming weeks, it could confirm the start of a sustained upward move.
________________________________________
Trade Setup
• Entry Zone: $138 to $140 (current price range)
• Stop-Loss: $110 (beneath the last significant swing low)
• Target: $185 (aligns with the next major resistance and top of risk-reward box)
• Risk-Reward Ratio: Approximately 1.5:1
• Setup Bias: Swing to mid-term bullish continuation
________________________________________
Conclusion
NVIDIA’s weekly chart is aligning in favor of the bulls after a healthy consolidation and support retest. The price remains within a strong uptrend channel, and momentum is gradually improving. A breakout above $152.98 would likely attract more volume and set the stage for a rally toward $185. The risk-reward setup is favorable, making this a strong candidate for bullish swing positioning heading into Q3 2025.
Nvidia Stock Price Rises Over 4% Following Earnings ReportNvidia (NVDA) Stock Price Rises Over 4% Following Earnings Report
Yesterday, after the main trading session, Nvidia released its quarterly earnings report, which exceeded analysts' expectations:
→ Earnings per share: actual = $0.81, forecast = $0.73
→ Revenue: actual = $44 billion, forecast = $43.3 billion
Additionally, according to media reports, Nvidia issued a strong forecast for the next period, although CEO Jensen Huang noted difficulties in accessing the Chinese market, which he estimates to be worth $50 billion.
Nevertheless, market participants reacted positively. According to Google, in after-hours trading the NVDA stock price rose by more than 4%, surpassing the $140 level.
It is reasonable to assume that this initial positive reaction could continue during today’s main trading session.
Technical Analysis of NVDA Chart
As we mentioned earlier this week, NVDA stock in 2025 has formed a broad descending channel (shown in red), and just before the earnings release, the price was consolidating near the upper boundary of this channel.
We also suggested a scenario in which the bulls might attempt to break through the upper boundary of the channel. Given the positive earnings report and the stock market rally following the Federal Court’s decision declaring Trump tariffs invalid, the likelihood of this scenario increases.
This, in turn, means that:
→ the upper boundary of the channel, once broken, may act as support;
→ we may once again see the key psychological resistance level of $150 come into play — a level we have highlighted multiple times before.
This article represents the opinion of the Companies operating under the FXOpen brand only. It is not to be construed as an offer, solicitation, or recommendation with respect to products and services provided by the Companies operating under the FXOpen brand, nor is it to be considered financial advice.

What’s Happening with Nvidia (NVDA) Ahead of Earnings?What’s Happening with Nvidia (NVDA) Ahead of Earnings?
After an extended weekend due to Veterans Day in the US (observed on Monday), financial markets are returning to active trading. The highlight of the week will be Nvidia’s (NVDA) earnings report, scheduled for Wednesday after the close of the main trading session.
What You Need to Know Ahead of Nvidia’s Earnings
According to media reports, market participants are concerned about:
→ escalating trade tensions between the US and China;
→ increasing competition;
→ Nvidia’s premium pricing at a time when the GPU market is shifting towards more affordable alternatives;
→ downward revisions to earnings per share, which some interpret as a sign that Nvidia’s report may fall short of expectations.
On the other hand, Reuters reports that Nvidia is set to unveil a new processor that:
→ is designed specifically for AI applications;
→ is based on the Blackwell architecture;
→ will not be subject to US export restrictions on chips sent to China;
→ is expected to be cost-effective.
Technical Analysis of Nvidia (NVDA) Stock
Today’s NVDA price chart suggests that the descending channel (marked in red) may be forming a large bullish flag — a continuation pattern that typically indicates a potential resumption of the uptrend after a corrective phase.
Price action in Nvidia stock has slowed near the upper boundary of the channel — a sign of temporary equilibrium between supply and demand (this could also be interpreted as traders adopting a wait-and-see stance ahead of the earnings release).
Given that the earnings report is a potentially strong price catalyst, a breakout from the bullish flag cannot be ruled out. Such a move could signal the start of a new phase in NVDA’s long-term upward trend (as indicated by the arrow on the chart).
This article represents the opinion of the Companies operating under the FXOpen brand only. It is not to be construed as an offer, solicitation, or recommendation with respect to products and services provided by the Companies operating under the FXOpen brand, nor is it to be considered financial advice.

Nvidia Drops 9%+ Amid Export Curbs and Fed WarningNvidia Corporation (NVDA) saw its stock fall by 9.18%, trading at $101.68 as renewed fears over U.S.-China trade tensions and monetary policy signals shook investor confidence. The decline came after the company confirmed costly new restrictions on chip exports to China, intensifying market concerns about long-term demand and global supply chain disruptions.
The broader market reacted sharply to these developments. The Nasdaq Composite dropped nearly 4.3%, while the S&P 500 shed around 3.1%. The Dow Jones Industrial Average also lost more than 900 points, a drop of about 2.2%. Contributing further to the sell-off, Federal Reserve Chair Jerome Powell delivered remarks in Chicago, stating that the central bank would “wait for greater clarity” before making interest rate changes.
Powell highlighted the conflicting effects of tariffs, warning that they could bring “higher inflation and slower growth,” placing the Fed’s dual mandate of stable prices and full employment under pressure. These comments, coupled with geopolitical uncertainty, pushed stocks to session lows.
Technical Analysis
Nvidia's price action shows a notable rebound from a major support zone near $92, which has historically attracted strong buying interest. Despite Wednesday’s sharp drop, the price trades above this level, suggesting traders are still defending it.
The next key resistance lies at $153.13, a level that capped previous rallies. If Nvidia breaks above this zone, it could signal a bullish continuation, potentially leading to a move toward new all-time highs. However, rejection at this point could trigger a pullback, with a possible retest of the $92 support.
The Relative Strength Index stands at 41, indicating a close to average momentum. This positions Nvidia at a crossroads, where upcoming price action around the resistance will determine the near-term trend.

Nvidia (NASDAQ: $NVDA) Advances AI Strategy Amid Tariff PauseNvidia (NASDAQ: NASDAQ:NVDA ) is quickly strengthening its positions in artificial intelligence and data center technologies. This comes as the U.S. government temporarily halts new export restrictions, offering relief to the semiconductor sector.
Nvidia will continue selling its H20 AI chips to China following a decision not to enforce new trade limits. This followed a key meeting between CEO Jensen Huang and former President Donald Trump. The announcement eased concerns over losing access to a major international market. Nvidia recently introduced its latest innovation, the Blackwell Ultra AI chips, at the GPU Technology Conference. These chips target the rising demand for high-performance computing used in AI systems. The move could boost Nvidia’s market lead as competition grows.
Market volatility followed the government’s tariff update. Nvidia stock surged nearly 19% after the 90-day tariff pause announcement, excluding China-specific measures. The next day, the stock dropped 5.8% to close at $107.74.
Technical Analysis
Nvidia's price bounced sharply from the $92 support zone. This area has attracted strong buying activity. The RSI is currently at 44, showing neutral market momentum. The key resistance level to watch is $153.13. If the price breaks this level, it could rise toward a new all-time high. Failure to do so may lead to a pullback toward $92.
Watch the $153 level closely for confirmation of trend direction. Nvidia's recent price movement leaves room for both uptrend continuation and short-term correction depending on upcoming market signals.

Nvidia Update New levels to the downside Longs and shortsIn this video I discuss the market structure shift in Nvidia and highlight new levels to be aware of to the downside . Potential here for longs and shorts .
Tools used Fibs, Gann Square , Speed Fan , Order blocks .
Please Like and comment if you have any questions . Have a great Day and thanks for your support

Nvidia (NVDA) Share Price Continues Bearish TrendNvidia (NVDA) Share Price Continues Bearish Trend
Earlier this month, our analysis of NVDA's share price led us to:
→ Establish a downward channel (marked in red).
→ Suggest that the lower boundary could act as support, which was confirmed (circled).
On 13 March, we anticipated the median line of this channel might serve as resistance, and yesterday’s ~5% drop in NVDA’s share price (marked by a red arrow) aligns with this scenario.
As a result, NVDA’s price has declined by approximately 17% since the start of 2025, despite being a market leader in 2024.
Why Did Nvidia (NVDA) Shares Drop Yesterday?
Market sentiment turned negative amid concerns that the Trump administration may soon impose previously delayed international trade tariffs.
Additionally, the Financial Times reported that Chinese regulators are encouraging firms to adopt data centre chips that meet stringent environmental standards. This raises concerns that Nvidia’s H20 chip, despite complying with U.S. export controls, may not meet China’s environmental regulations. Investors seemingly viewed this as a bearish signal for Nvidia’s future sales in China.
Technical Analysis of Nvidia’s Share Price
Currently, NVDA’s price is encountering resistance at the bullish gap formed on 12 March, around $112.50.
Given the broader market context, this setup could indicate an attempt by bears to resume the downtrend after a temporary rebound from oversold conditions. A consolidation pattern in the form of a narrowing triangle (marked in red) has also emerged.
If market conditions remain challenging, bears may push NVDA’s price towards the psychologically significant $100 level.
This article represents the opinion of the Companies operating under the FXOpen brand only. It is not to be construed as an offer, solicitation, or recommendation with respect to products and services provided by the Companies operating under the FXOpen brand, nor is it to be considered financial advice.

Nvidia (NVDA) Share Price Rises Over 6%Nvidia (NVDA) Share Price Rises Over 6%
The NVDA stock chart shows that following yesterday’s trading session, the share price climbed over 6%, outperforming the Nasdaq 100 index (US Tech 100 mini on FXOpen), which gained just over 1%.
Despite this recovery from a six-month low, NVDA shares remain down 15% year-to-date.
Why Did Nvidia (NVDA) Shares Rise Yesterday?
Positive sentiment swept through the stock market after U.S. inflation data came in lower than expected. The Consumer Price Index (CPI) for the month stood at 0.2%, below analyst forecasts of 0.3% and the previous reading of 0.4%.
Investors may now be looking for opportunities following the March sell-off, triggered by Trump’s tariff policies and recession fears—and NVDA shares appear attractive in this context.
Barron’s suggests that NVDA stock may currently be undervalued, while MarketWatch cites BofA analyst Vivek Arya, who advises investors to focus on Nvidia’s gross profit margins as a key driver of significant share price growth.
Technical Analysis of NVDA Stock
Earlier this month, we identified a descending channel (marked in red) and suggested that its lower boundary could act as support—which was confirmed (highlighted by the circle).
Bullish perspective:
- The stock opened with a bullish gap and gained throughout the session, failing to hold below the psychological $110 level.
Bearish perspective:
- The price remains within the descending channel, with the median line potentially acting as resistance.
- The $117.50 level, previously a support, has turned into resistance (as indicated by the arrows) and may pose a challenge to further recovery.
NVDA Share Price Forecast
According to TipRanks:
- 39 out of 42 analysts recommend buying NVDA stock.
- The average 12-month price target for NVDA shares is $177.
This article represents the opinion of the Companies operating under the FXOpen brand only. It is not to be construed as an offer, solicitation, or recommendation with respect to products and services provided by the Companies operating under the FXOpen brand, nor is it to be considered financial advice.

Nvidia is in BIG TROUBLE! Find out WHY!Nvidia is in BIG TROUBLE! Find out WHY!
NASDAQ:NVDA has been a rocket ship to the upside for over 2 years now but all rocket ships eventually run out of fuel.
Check out what I'm seeing on the charts and where Nvidia is going next!
Not financial advice

Nvidia (NVDA) Stock Hits New Yearly LowNvidia (NVDA) Stock Hits New Yearly Low
The NVDA stock chart shows that during yesterday’s trading session, the price dropped to $112.16, marking:
→ A new low for 2025, surpassing the previous bottom set on 3 February.
→ The lowest price in nearly five months.
Why Is Nvidia (NVDA) Stock Falling?
Bearish sentiment may be driven by:
→ A Wall Street Journal report stating that Chinese companies can still access Nvidia’s latest Blackwell chip despite Biden-era restrictions. Investors may fear tighter regulations, as the U.S. aims to limit technological advancements for geopolitical rivals.
→ The impact of Trump’s trade tariffs, which continue to disrupt global markets.
Technical Analysis of NVDA Stock
As noted in our report five days ago, NVDA’s price is forming a more defined downward channel (red) while moving further away from the Rising Wedge pattern (blue).
How Low Could Nvidia (NVDA) Stock Drop?
Despite NVDA’s weak performance relative to the broader market, investors may seek long positions in this former 2024 market leader.
Potential support levels:
→ The lower boundary of the red channel.
→ The psychological $100 mark.
If the Rising Wedge plays out, bears may target $85, based on the A-B range projected from point C.
A high-risk bullish argument could suggest that yesterday’s drop was a false bearish breakout below the 3 February low.
NVDA Stock Price Forecast
Analysts remain optimistic, possibly due to last week’s strong earnings report.
According to TipRanks:
→ 38 out of 41 analysts recommend buying NVDA.
→ The 12-month average price target is $178.
Trade on TradingView with FXOpen. Consider opening an account and access over 700 markets with tight spreads from 0.0 pips and low commissions from $1.50 per lot.
This article represents the opinion of the Companies operating under the FXOpen brand only. It is not to be construed as an offer, solicitation, or recommendation with respect to products and services provided by the Companies operating under the FXOpen brand, nor is it to be considered financial advice.

NVIDIA & xAI’s Grok 3: A Game-Changer or Overhyped AI Play?NVIDIA’s stock ( NASDAQ:NVDA ) has been on an unstoppable rally, driven by the AI boom. Now, with Elon Musk’s xAI set to launch Grok 3 —trained on an impressive 100,000 NVIDIA H100 GPUs —the market is buzzing with speculation. Could this be the catalyst that propels NVDA to the next level, or are we approaching an AI-driven valuation bubble?
Key Developments :
Massive GPU Demand : xAI’s Grok 3 will utilize a staggering 100,000 H100 GPUs, reinforcing NVIDIA’s dominance in AI hardware and boosting its market position.
Supercomputer Expansion : Musk’s team is building one of the most powerful AI training clusters in Memphis, Tennessee. This development could significantly increase NVIDIA’s long-term revenue streams, given its key role in powering these systems.
Release Date : Grok 3 is set to launch today, February 17, 2025(4 AM GMT) , with a live demonstration, which may influence sentiment around AI-related stocks, especially NVIDIA.
Market Sentiment & Risks : While these developments seem bullish for NVIDIA, some analysts, including hedge funds like Elliott Investment Management, have raised concerns over the potential for overvaluation as the AI euphoria spreads.
Conclusion: Grok 3’s launch will be a pivotal moment, with NVIDIA at the heart of the AI revolution. Whether this sparks a fresh rally or raises concerns about an AI bubble remains to be seen.
------------------------------------------------------------------------------
Now, let's use Technical Analysis to analyze NVIDIA stock(NVDA) .
In terms of technical analysis, the loss of an Ascending Channel is not good news for any asset and is a sign of weakness in the upward trend . This has happened to the NVIDIA stock(NVDA) .
From the point of view of Classical Technical Analysis , it seems that NVIDIA stock is completing the Rising Wedge Pattern .
Educational tip : The Rising Wedge Pattern is a bearish reversal or continuation pattern characterized by converging upward-sloping trendlines. It signals weakening bullish momentum, often leading to a breakdown below support. A confirmed breakout to the downside indicates a potential price decline.
I expect the launch of Grok 3 Artificial Intelligence(AI) can increase at least +10%+15% of NVIDIA stock(NVDA) . If the upper line of the Rising Wedge Pattern breaks , we can expect a further increase [ the next target can be Yearly Resistance(1=$175.68)(in case of breaking) ].
What’s your take? Drop your thoughts about NVIDIA in the comments! 👇
Be sure to follow the updated ideas.
NVIDIA Analyze (NVDAUSD), Daily time frame.
Do not forget to put Stop loss for your positions (For every position you want to open).
Please follow your strategy; this is just my idea, and I will gladly see your ideas in this post.
Please do not forget the ✅' like '✅ button 🙏😊 & Share it with your friends; thanks, and Trade safe.

NVIDIA Update Trade the Range
Update from the previous video entitled *The next long to take . If the position was taken then you should be +20% as it stands . Currently approaching a key area for some resistance . Earnings in 16 days and i highlight the range I expect us to stay inside of until the news release

NVIDIA Local UptrendNVIDIA in Local Uptrend on the 1-Hour Chart
NVIDIA made a higher high on the 1-hour chart, so we are in a local uptrend. It’s possible that we’ll see a higher low next, and then move up to a new higher high, or we could continue going higher right now.
If tomorrow the 4-hour candle close stays above $126.63 (yellow line) and holds that level, then we’ll have gained that support. In that case, we are back in the big range with the potential to reach $148.

NVIDIA Forms Inside Bar Pattern After Significant Drop...NVIDIA is currently exhibiting an inside bar pattern following a significant 17% decline, which was triggered by the DeepSeek Panic incident. This pattern indicates a period of consolidation where the price is stabilizing within the range established by the preceding candle. To make informed decisions moving forward, it is prudent to monitor price action closely and wait for a definitive breakout from this inside bar formation. A breakout above the upper boundary could signal a potential reversal or upward momentum, while a breakdown below the lower boundary may suggest further bearish pressure. Hence, exercising patience and assessing volume and market context will be crucial before committing to any trades.

NVDA's Historical Bounce Data - This Is The Way.Forget all the nonsense about deepseek and evidence surrounding the NVDA chinese financial psyop that crushed the market today (primarily before the market even opened). It's all smoke and mirrors. Putting your money in the middle when the odds are in your favor is how you come out on top. That being said, there's a 90% rebound rate for NVidia's 10 biggest drops over the last - hence the reason I'm sitting on 75 calls with a strike of 125 that expire this Friday. The average next day rebound is 4.4% with the median being 5.3%. NVDA closed at $118.58, meaning there's a 90% chance that tomorrow we will see the price settle in the following ranges:
Bull Case: 60% probability: $124.50 - $126.90
Base Case: 30% probability: $120.95 - $123.30
Bear Case: 10% probability: $115 - $117
The DeepSeek Red Herring:
Speculating on the DeepSeek nonsense, the release of DeepSeek's R1 seems like an attempt to make the narrative fit the story rather than anything based on actual news:
*As someone that works w/ AI every day, DeepSeek v3 has been out for a long time, and R1 was released over a week ago. There isn't anything new about this story.
*This likely points to a coordinated dump of NVDA by 'whales' during premarket hours to push price action, and China has enough sway in the US markets to perform such a sway after hours. More than 12% of the 16.9% drop occurred in a short period before the market opened - limiting the influence/access of retail investors and thereby maximizing their leverage/power over the market.
*This could be a preemptive move by China in a financial cold war that has been developing. Trump recently touted investing $.5T in stargate (ai), and has proposed tariffs of 10% on all chinese goods starting in just 4 days (Feb 1st)
*NVDA is the perfect target to send a message. Most of their production is in Taiwan, and we know how China feels about that. The fact that China can't purchase their super chips is a big slap in the face. It'd be like China growing a bunch of crops in Idaho, only to not sell any food to the US while the US is starving.
*It's a known fact that bots place the majority of trades on the US market these days. China is a master at reverse engineering tech (if not outright stealing it). Knowing what triggers market bots would be easier than supplying a fake narrative.
Nothing about DeepSeek being the reason for the drop passes the smell test if for no other reason than from a logical standpoint...a couple If/Then scenarios:
1) If Deepseek did develop a model for $6M (which would be both insane and extremely unlikely) using outdated tech - Then NVDA's response that they should have their export restrictions removed and the 2nd largest AI market open to them is legitimate. Sales would skyrocket.
2) If this is Chinese misinformation and they're lying about using the A100 chips or the development costs, then why would they do that?
3) If China can't develop their own model without the A100s, what would they do to gain access to them? Then I think they steal the model - either the o1 (openAI) or llama (meta) model and tinkered with it just enough to optimize it as it's performance results are almost identical to openAI's o1 model - DeepSeek's Founder admits "there are no secrets in AI". While models can run on outdated hardware, you can't develop new models in a timely fashion on anything other than the A100s because they're 20x more powerful than the previous chips.
The question is was this China's attempt to trigger a black swan event in the US markets prior to the tariffs being enacted - a financial cold war if you will.

NVDA LESSON Now We Hunt For A DISCOUNT Nvidia⚪️ NVDA Another example of traders getting
trapped at the high.
⚪️ Also a prime example of traders
entering pre 150 break.
We don't need level 2 data to know
how HUMANS WILL ACT.
HUMAN BEHAVIOUR IS PREDICTABLE.
✅️That is an edge we can use too................
🟢 Every trend starts with a breakout and yes if you take everyone you will never miss the NEXT BIG MOVE BUT.....
🟢 By doing so you will inevitabley give up a high win rate, and the fact is that most humans would rather be RIGHT than make MONEY.
⭐️THAT IS JUST SIMPLE HUMAN BEHAVIOUR.⭐️ IT'S STRANGE BUT TRUE⭐️
🌎Most traders would rather sacrifice more profit for a HIGHER WIN RATE🌍
Some of the most PROFITABLE TRADERS & INVESTORS in the WORLD have a WIN RATE BELOW 50%.❕️
❗️LET THAT SINK IT...❗️
⚠️ 🟢SeekingPips🟢 SAYS SAVE THIS GOLD LESSON NOW YOU CAN THANK ME LATER⚠️

NVIDIA - Set for lift-off!NASDAQ:NVDA NASDAQ:NVDL
No imposters here 🕵️♂️
Fakeout👏 Breakout👏 Retest👏 Higher
Can you see the other pattern? 👀
Not financial advice
