#NVIDIA Take profits! The curse of Jim Cramer will strike U missed the move
A really good move
don't go chasing at these prices would be my suggestion
#cramer is named the inverse oracle for very good record
His track of wrong calls is outstanding!!! :)
Nvidiacorporation

Nvidia -> Squeezing The BearsHello Traders,
welcome to this free and educational multi-timeframe technical analysis .
On the weekly timeframe you can see that after Nvidia created and also confirmed the weekly inverted head and shoulders, which we created around the beginning of 2023, we had another rally of about 70% towards the upside.
In my opinion Nvidia is definitely ready for a short term correction, you can also see that we are about to retest previous weekly resistance at the $280 area which is turned resistance again so from there I do expect at least a short term rejection towards the downside.
On the daily timeframe you can see that market structure is still very bullish, there is no sign of a correction yet so I am now just waiting for a break below the previous daily support zone at $265 which is then turned resistance before I then do expect a short term correction towards the downside.
Thank you for watching and I will see you tomorrow!
You can also check out my previous analysis of this asset:

TARGET reached NVIDIA to $215.54 - and now we just waitCup and Handle formed and broke to the upside.
Since then we have had the price swim nicely to the target at $215.54.
Also, the price has continued up and up which hasn't given us another trade signal.
I guess, we need the price to consolidate and equilibrate before us breakout traders can do anything :)

Nvidia -> Time To Fill The GapHello Traders,
welcome to this free and educational multi-timeframe technical analysis .
On the weekly timeframe Nvidia stock just had a massive rally towards the upside, just the past 70 days the market is up about 75%.
You can also see that during this long move towards the upside, we didn't really have any weekly correction towards the downside, so from a weekly perspective I do expect at least a short term correction to retest the next weekly previous resistance area, which is now turned support.
On the daily timeframe you can see that Nvidia stock is starting to create resistance at the current $235 area, so from here it is quite likely that we will see a short term correction towards the downside to retest the next previous daily support zone, which should be turned support once again.
Thank you for watching and I will see you tomorrow!
You can also check out my previous analysis of this asset:

NVIDIAMonthly bias on this stocks, Im expecting more sell side to clear the previous buys.
Trade base on your own decissiosn.
Follow for more

Nvidia -> Breakout TimeHello Traders,
welcome to this free and educational multi-timeframe technical analysis .
On the weekly timeframe Nvidia stock just recently created a very obvious inverted head and shoulders and I uploaded a lot of analysis always pointing towards this bullish pattern which will lead to a longer term bullish move.
The past couple of weeks Nvidia already started this bullish move, we now just broke about a weekly resistance area so I simply do expect the continuation towards the upside from here.
With earnings coming out yesterday, the market today gapped higher 15%, breaking also a daily resistance area so I am now just expecting a retest of the previous resistance, now turned support, and then the continuation towards the upside.
Thank you for watching and I will see you tomorrow!
You can also check out my previous analysis of this asset:

NVDA BUY (NVIDIA CORPORATION)Hi there.
Price is forming a continuation pattern to the upside.
Wait for the price to complete the pattern and watch strong price action for buy.

NVDA NVIDIA Corporation Options Ahead of EarningsLooking at the NVDA NVIDIA Corporation options chain, i would buy the $180 strike price Calls with
2023-3-17 expiration date for about
$16.35 premium.
If the options turn out to be profitable Before the earnings release, i would sell at least 50%.
Remember, this is a medium term play, we could not necessarily see instant results.
Looking forward to read your opinion about it.

Nvidia -> Higher, Higher And HigherHello Traders,
welcome to this free and educational multi-timeframe technical analysis .
On the weekly timeframe you can see that Nvidia is actually quite overextended towards the upside, just the last couple of weeks the market had a pump of about 65% towards the upside.
Considering the fact that from a weekly perspective we are also retesting previous support which is now turned resistance, I do expect a short term rejection towards the downside and then the longer term continuation towards the upside.
On the daily timeframe you can see that we are currently retesting also previous resistance, so I am now just waiting for some bearish rejection which will then lead to a short term weekly correction towards the downside.
Thank you for watching and I will see you tomorrow!
You can also check out my previous analysis of this asset:

Nvidia Multi-Timeframe Analysis 29.01Hello Traders,
welcome to this free and educational technical analysis .
Nvidia is looking very bullish on the weekly timeframe, considering that we are creating a massively bullish inverted head and shoulders.
On the daily timeframe I am now just looking for a retest of the neckline of the head and shoulders and some bullish confirmation on the lower timeframes to enter a long
to capitalize on the next massive move towards the upside.
Thank you for watching and I will see you tomorrow!
You can also check out my previous analysis of this asset:

Nvidia Analysis 17.01.2023Hello Traders,
welcome to this free and educational analysis.
I am going to explain where I think this asset is going to go over the next few days and weeks and where I would look for trading opportunities.
If you have any questions or suggestions which asset I should analyse tomorrow, please leave a comment below.
I will personally reply to every single comment!
If you enjoyed this analysis, I would definitely appreciate it, if you smash that like button and maybe consider following my channel.
Thank you for watching and I will see you tomorrow!
You can also check out my previous analysis of this asset:

Nvidia Analysis 15.12.2022Hello Traders,
welcome to this free and educational analysis.
I am going to explain where I think this asset is going to go over the next few days and weeks and where I would look for trading opportunities.
If you have any questions or suggestions which asset I should analyse tomorrow, please leave a comment below.
I will personally reply to every single comment!
If you enjoyed this analysis, I would definitely appreciate it, if you smash that like button and maybe consider following my channel.
Thank you for watching and I will see you tomorrow!
You can also check out my previous analysis:

Nvidia Analysis 09.12.2022Hello Traders,
welcome to this free and educational analysis.
I am going to explain where I think this asset is going to go over the next few days and weeks and where I would look for trading opportunities.
If you have any questions or suggestions which asset I should analyse tomorrow, please leave a comment below.
I will personally reply to every single comment!
If you enjoyed this analysis, I would definitely appreciate it, if you smash that like button and maybe consider following my channel.
Thank you for watching and I will see you tomorrow!

NVIDIA Corporation | Strong Bullish Bias, Looking Like CryptoI remember NVIDIA from when I was a young kid... NVIDIA, Intel, AMD as they made the chips and graphic cards for all of our playing/gaming... Those days.
See how things converge, now NVIDIA is intertwined with Cryptocurrencies and once again this is our playground, with Cryptocurrencies we work and play.
NVIDIA Corporation (NVDA) Weekly Chart Analysis
There is a very strong bullish bias fully confirmed on this chart.
The classic signals go as follow:
- Trading above EMA50, EMA10 and MA200.
- Very strong RSI on a high timeframe.
- Multiple consecutive weeks of bullish action/green candle close.
Back in March 2020 NVDA produced a V shaped recovery and bounced right off the MA200 line. This lead to a strong bull-run.
Now, in October 2022 NVDA produced a V shaped recovery bouncing right off the MA200 line. Closing above 174.16 opens the door for additional growth.
What's more:
- We have a perfect 5 wave abcde correction preceding the current bullish action.
- The low also ended exactly at a -9 on the TD Sequential.
- The low/support also matches perfectly the 0.786 Fib. retracement level relative to the bullish wave from March 2020 to November 2021.
All these signals are telling us that a cycle is complete.
That support is strong.
That NVIDIA is ready for sustained growth.
Namaste.

NVIDIA Corporation Technical AnalysisAfter a drop of little over 60% in the past year, NVIDIA has created a bullish divergence on a previous support line.
1 Year analyst targets according to Tradingview is $202/share, which constitutes roughly a 60% price increase
from current price.
My plan for NVIDIA as of right now is a swing trade earning to make anywhere from 30-50% in the next couple of months,
I don't see the stock price falling drastically more as of right now, according to the fundamentals we have seen a
drop quite consistently with the drop we have seen thus far reflected in the stock price.
I'm looking to take profit around the previous high of $190/share, most likely liquidating my position at $185/share,
netting a total of +47% ROI from today's price.
If NVIDIA were to drop further, (although I don't see it dropping below $100/share without the help of external factors)
I still think NVIDIA is a solid company as well as they have a major market share in the computer
technology sector, and I will most likely retain my position were the price to drop further, although
this would have to depend on a revision of my current analysis.
Summary:
NVIDIA created a divergence on previous support on 4H chart.
Entry price: $125/share
Target price: $185/share
Long-term holding possible if swing trade does not
turn out as expected, granted fundamentals does not change.
Disclaimer:
It might not be a bad idea to conduct a qualitative analysis
of the computer sector if you want to follow my trade
as there is a lot of external factors happening in the world
that might affect the result of this trade.

NVDA NVIDIA Corporation Strongest SupportNVDA NVIDIA Corporation looks ready for a technical rebound.
A technical rebound refers to a recovery from a prior period of losses when technical signals indicate that the move was oversold.
In this case, the Relative Strength Index momentum indicator of NVDA is below 30.
Even though i am overall bearish on the economy, buying a strong financial instrument when the RSI is below 30, would make a case for a potential short term reversal.
Looking forward to read your opinion about it.

$NVDA Nvidia TECH Chart has not shown any signs of reversal$NVDA Nvidia Tech Company has a similar chart to $MU and $AMD - $MU earnings revealed negative sentiment sending both $AMD & $NVDA downward on relation of fear that the chip market is slowing growth.
Nvidia has not shown any technical signs of reversal on the lower timeframes yet.
Above I've marked important levels on the weekly timeframe.
With the slowing growth of $ETH and other crypto currencies, tech stocks like Nvidia and Micron are directly related and effected by the mega drop in value as demand for graphic processors and mining decreases.
It's pretty obvious that $NVDA is a top tier company in graphic processors and this decline is mostly due to the decline in our economy. As we progress into the digital age NVIDIA has high probability to bounce back to new heights (of course this could take 12-18 months unless they expand rapidly into different avenues of technology).
I will update if I catch any technical chart indications of possible reversal.

NVIDIA - key support FAILEDNVIDIA
Short Term
We look to Sell at 159.72 (stop at 170.83)
Our bespoke support of 156.00 has been clearly broken. Preferred trade is to sell into rallies. Rallies continue to attract sellers. There is scope for mild buying at the open but gains should be limited. Continued downward momentum from 174.40 resulted in the pair posting net daily losses yesterday.
Our profit targets will be 126.78 and 119.10
Resistance: 156.00 / 196.00 / 210.00
Support: 150.00 / 126.00 / 120.00
Disclaimer – Saxo Bank Group. Please be reminded – you alone are responsible for your trading – both gains and losses. There is a very high degree of risk involved in trading. The technical analysis , like any and all indicators, strategies, columns, articles and other features accessible on/though this site (including those from Signal Centre) are for informational purposes only and should not be construed as investment advice by you. Such technical analysis are believed to be obtained from sources believed to be reliable, but not warrant their respective completeness or accuracy, or warrant any results from the use of the information. Your use of the technical analysis , as would also your use of any and all mentioned indicators, strategies, columns, articles and all other features, is entirely at your own risk and it is your sole responsibility to evaluate the accuracy, completeness and usefulness (including suitability) of the information. You should assess the risk of any trade with your financial adviser and make your own independent decision(s) regarding any tradable products which may be the subject matter of the technical analysis or any of the said indicators, strategies, columns, articles and all other features.
Please also be reminded that if despite the above, any of the said technical analysis (or any of the said indicators, strategies, columns, articles and other features accessible on/through this site) is found to be advisory or a recommendation; and not merely informational in nature, the same is in any event provided with the intention of being for general circulation and availability only. As such it is not intended to and does not form part of any offer or recommendation directed at you specifically, or have any regard to the investment objectives, financial situation or needs of yourself or any other specific person. Before committing to a trade or investment therefore, please seek advice from a financial or other professional adviser regarding the suitability of the product for you and (where available) read the relevant product offer/description documents, including the risk disclosures. If you do not wish to seek such financial advice, please still exercise your mind and consider carefully whether the product is suitable for you because you alone remain responsible for your trading – both gains and losses.

NVIDIALooking for portential buying opportunities on the restest on the privious monthly Demand zones for a continuation.

Nvidia coming into resistance? NVIDIA
Short Term - We look to Sell at 210.20 (stop at 228.47)
Our bespoke support of 210.00 has been clearly broken. We look to sell rallies. Rallies continue to attract sellers. The 61.8% fibonacci extension level is the target.
Our profit targets will be 160.25 and 124.10
Resistance: 210.00 / 250.00 / 290.00
Support: 160.00 / 150.00 / 126.00
Disclaimer – Saxo Bank Group. Please be reminded – you alone are responsible for your trading – both gains and losses. There is a very high degree of risk involved in trading. The technical analysis, like any and all indicators, strategies, columns, articles and other features accessible on/though this site (including those from Signal Centre) are for informational purposes only and should not be construed as investment advice by you. Such technical analysis are believed to be obtained from sources believed to be reliable, but not warrant their respective completeness or accuracy, or warrant any results from the use of the information. Your use of the technical analysis, as would also your use of any and all mentioned indicators, strategies, columns, articles and all other features, is entirely at your own risk and it is your sole responsibility to evaluate the accuracy, completeness and usefulness (including suitability) of the information. You should assess the risk of any trade with your financial adviser and make your own independent decision(s) regarding any tradable products which may be the subject matter of the technical analysis or any of the said indicators, strategies, columns, articles and all other features.
Please also be reminded that if despite the above, any of the said technical analysis (or any of the said indicators, strategies, columns, articles and other features accessible on/through this site) is found to be advisory or a recommendation; and not merely informational in nature, the same is in any event provided with the intention of being for general circulation and availability only. As such it is not intended to and does not form part of any offer or recommendation directed at you specifically, or have any regard to the investment objectives, financial situation or needs of yourself or any other specific person. Before committing to a trade or investment therefore, please seek advice from a financial or other professional adviser regarding the suitability of the product for you and (where available) read the relevant product offer/description documents, including the risk disclosures. If you do not wish to seek such financial advice, please still exercise your mind and consider carefully whether the product is suitable for you because you alone remain responsible for your trading – both gains and losses.

NVDA Nvidia Buy NowAccording to my chart analysis , NVDA Nvidia Show strong signal to buy , buy max as you can .

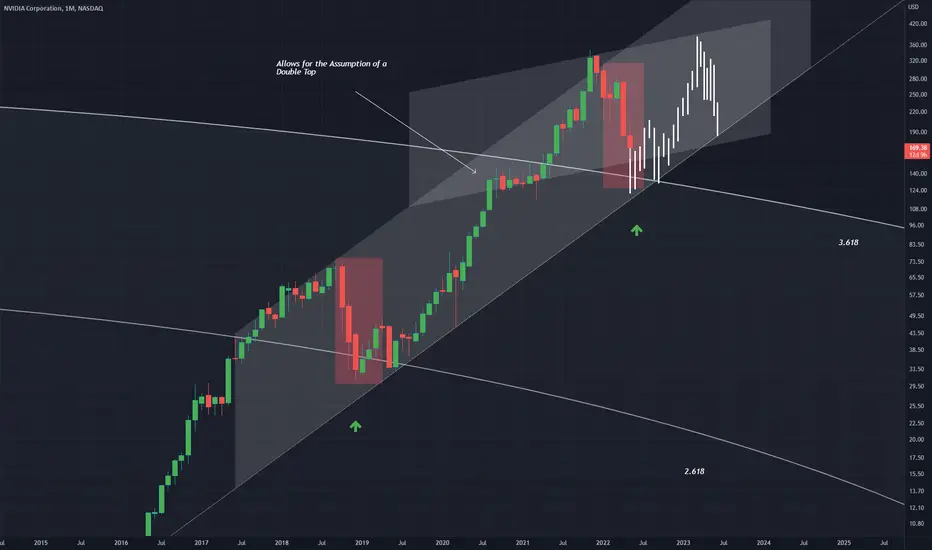
NVDA 3.618 Monthly Fibonacci BuyVery similar to price action at 2.618
It seems to just be repeating the same test of the prior fib level within the circle (indicated in red rectangle)
Buy the dip Monthly scenario
NVDA - MONTHLY ANALYSISFollowing the trend, I'd buy Nvidia if breaks the latest high
Stop Loss - Below the latest low
1st Target - R/R = 1,00 - 1/3 Position
2nd Target - R/R = 2,00 - 1/3 Position
3rd Target - R/R = 3,00 - 1/3 Position
