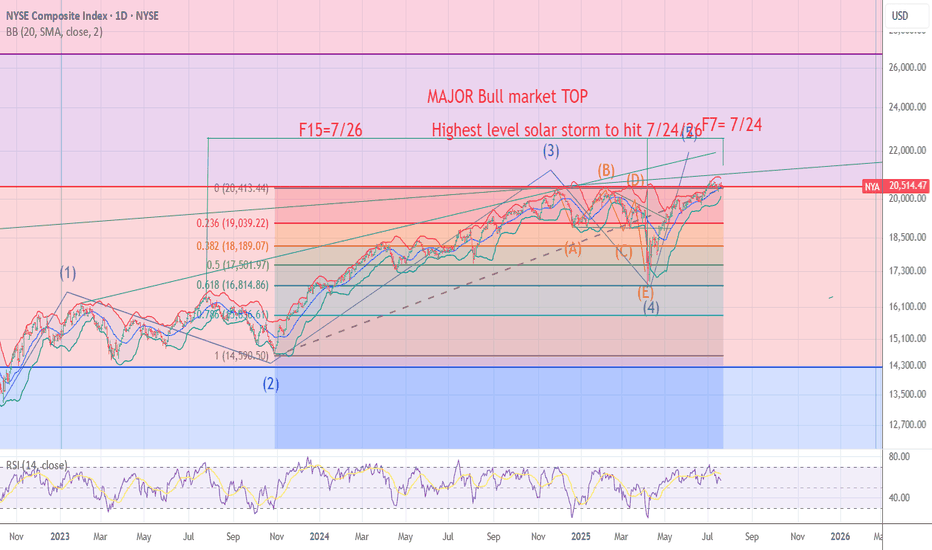
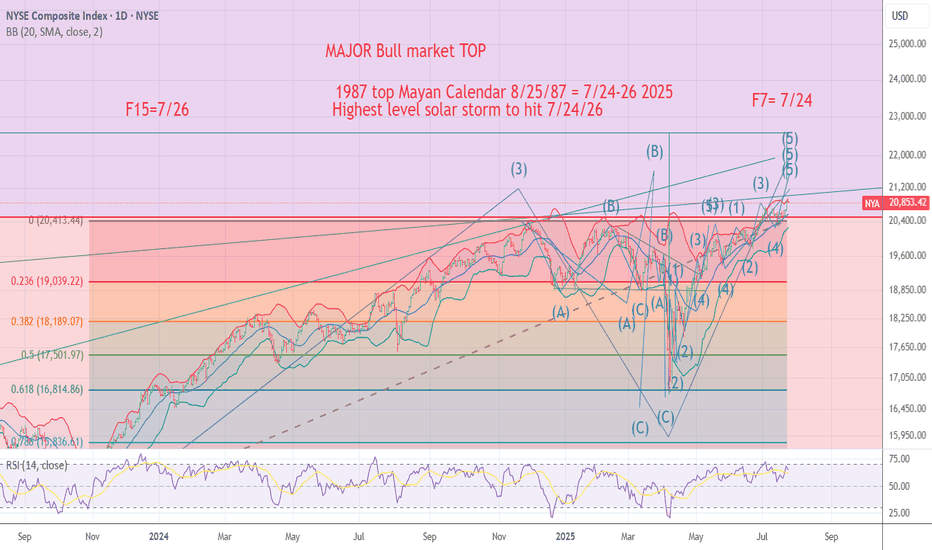
NYA chart Posted The signal for the Top is hours away .7/24/7/26The chart posted is my work based on the golden ratio and SPIRAL calendar work .We will be hit by one of if not the highest ever solar storms from 7/24 to 7/26 I will be re shorting into this date And will look for the markets worldwide to see a massive event .I have been talking a massive earthquake and the markets to begin a drop into OCT 10 to the 20th . best of trades .Wavetimer
NYA
2025 forecast NYA Wave B top nearing 20% decline plusThe chart posted is that of the NYA .12/8 /2024 Major wave B top forming target 20,190 alt 22130 . Cycles are bearish into 2025 and well into oct 2026 Depression Like decline . into oct 2026 . First big decline should take us down into the spiral turn date 3/10 2025 week . in what should be an 11.8 to 16.6 % decline we should then see a rally into Mid July to Sept 2nd Then cycles begin next bear cycle phase . Down hard in most of 2026 The market in this decline should take us down about another 26 to 35% in wave 3 , The final low if the big picture is correct should see a major low oct 10/20 2026 the total decline should be 38% to 44 % Gold should see 1050 to 1489 . Bonds should form a rally but will fail over n over . BMV:US should see 119 to 121 handle in 2025 by mid oct 2025 . . Tariffs and the trade war are the main reason . But the markets since 2009 have been Liquidity driven with zero rates forced money flows into Assets 2025 will see a Deleveraging of inflation assets as we decline in housing markets based on the 18.8 year cycle in housing . Unemployment will see a sharp rise into 5.5 -6.1% into oct 2025 . based on downsizing of the federal workers Bitcoin will see a drop min 42/35 and a final low is 18500 to 22100 peak to low . . In dec 2021 Forecast called for a 20 plus decline into oct 10 to the 20th 2022 into 3510 to 3490 in the sp 500 .Dec 2022 forecast was calling for a rally to new highs in all indexes . In dec 2023 forecast called for the sp to reach 5636 to 5818 and the year of a vix of 29 or better we saw 60 . What next is at most I have said is a target in the sp of 6183/6235 We may or may not reach that But if is going to it will be jan 2 to the 20th 2025 . The last of the money flow . Best of trades WAVETIMER
NYA THE ONLY BULLISH WAVE COUNT 4th WAVE TRIANGLE on NEWSThe chart posted is that of the NYSE NYA this is the only Elliot wave Structure that is BULLISH I have now moved into calls in the SPY 540 and QQQ calls 450 dec 2026 . This is a HIGH RISK TRADE BUT I AM WILLING TO TAKE A 25 % position the sp cash was at 5415and qqq were at BEST at 452 put call above 1 and vix above 28.5 the fear greed was at 9 best of trades WAVETIMER
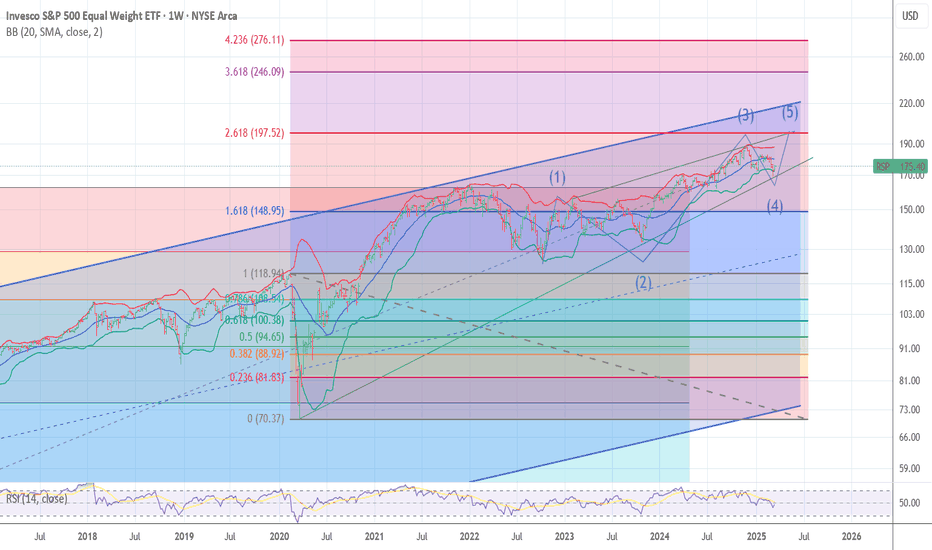
RSP and WHY I AM BULLISH STILL197/199 target The chart posted is the sp 500 equal weighted RSP has dropped to a trend line dated back to march 23 2020 . I have three clean points and all are major . Elliot Wave calls for a final 5th wave to end this advance in the area of 198 plus or minus 1.25 Fib relationship and PUT /CALL as well as most of my spiral and cycles point to the final advance to a Bull market top is now setup . BULL MARKETS TOP ON GOOD NEWS > Best of trades WAVETIMER
MAG7 MODEL Rally is going to be in the form of ABC up The chart posted is the Mag 7 .I feel strong that the super cycle Top in the mag 7 was seen like January 2000 in the internet Bubble . I am counting a clean 5 waves down and see a strong ABC rally phase like that in 2000 then we dropped about 30% in the first leg down followed by a huge Bearish rally back up first leg up moved to the 50% retracement and then had a abc down for wave b of B to be followed up to .618 of the decline to form THE B Wave TOP . I am looking forward in my work and my models to see a near prefect rematch in the formation . I stated in my dec 8th forecast How the market will unfold based on the Wave structure and cycles and the DATA . We are now set for that abc rally . next turn date in spirals in 3/28 best of trades WAVETIMER
DOW JONES INDUSTRIALS HAS TOPPED Wave 1 down is in The chart is that of the DJI similar to the NYA pattern . I have now a clean 5 waves down I would look for a ABC in the NYA and DIA the next 3 td and we should see new records highs in QQQ SPY and MAGS . I will wait to enter my positions in puts next week . I have said I am Bullish the US $ for 2025 and see 117/121 handle . Best of trades Wavetimer .
MAJOR MULTI YEAR TOP FORMING NYA The chart posted is that of the NYA index .I have Not changed my Labeling or the Spirals . The Math is and has been rather Clear over the last 10 years and in fact going into the target low of 2009 march 9th . We have now entered the MIN target for wave C up or wave 3 of 5 of 5 at 19564 The targets call for this wave to peak 19564 to 20178 if wave 1 from covid low is to peak at .786 of wave 1 Jan 2 top 2022 .And wave C or 3 up at the same targets 19564/20178 The TURN due 10/10 to 19th saw the peak of 19901 and can be counted as 5 wave up .YET I can and have counted the rally as a abc x abc up which would mean we have One more rally above 19901 with it being at 20178 plus or minus 100 . .What if we had a blowoff ?? based on the Fractal of 2018 . That would mean a target of 22196 and wave 1 and 3 would be Equal. But in Diagonal waves tend to be .786 or .887 of the preceding wave Most of which have been .786 .This give me reason the believe we have a LAST GASP of EUPHORIA In the market just after the election into the 19th of the month ! .If we break the NYA 18,036 which is .786 market I would then confirm SUPER CYCLE TOP of wave 3 or Wave B Both are DARK Times Just ahead I ask you to see Gold chart and ask yourself IF things are so stable then Why would anyone be in Gold??? BEST OF TRADES THE WAVETIMER !! GOD BLESS THIS GREAT NATION !!!!
SEVEN SPIRALS JAN !)to JAN 18 A MAJOR TURN EVENTThe chart posted is the NYSE and I have not alt one wave within the count and We have 7 golden ratio spirals in time pointing to a FOCUS Point the week of JAN 10 to the 18th 2024 I am LOOKING FOR A WORLD WIDE EVENT If you look at each one of the points The Markets had HUGE MOVES that started. We are now also above the monthly Bollinger bands in the dji Everytime we broke above the band back to 1902 by 1.4 to 3.45 % btw we only had once 4.4% in 121 years The DOW had a sharp move to the downside 10 % or more and most were the FINAL PEAKS we are now 1.25 % above . BEST of TRADES WAVETIMER
WAVE 4 low is in place wave 5 in the Diagonal still intact We seemed to have dropped in a another 3 wave structure this only happened in triangles or diagonals open a book and learn ELLIOT WAVE before you open your mouth and make a statement. I studied ew from A.J Frost in letters back and forth in my 20,s NOT BOB
NDQ | Hidden in plain sight...This is a period of recession, a period when hands change. Last becomes first and first becomes last.
Curiously, if you mix and match the main indices, you will get bored of the same shape appearing over and over again.
They all appear in the same period. This stuff is hidden in plain sight...
NDQ vs DJI
SPX vs NYA
NDQ vs RUI
RUI vs NYA
RUA vs DJI
This one is full of small HnS. A little rough but okay.
And an extra speculation:
DJI vs SPX
Question: Where do all these HnS lead to? Who is the final recipient? Since all these charts are comparative to one another.
Tread lightly, for this is hallowed ground.
-Father Grigori
TOP WAVE STRUCTURE NYA targets are 17570 /18100 Would be using the chart posted to Help you to be selling out of I.T. AND LONG TERM positions as the blow off should go thru the top of this channel equal or near equal as it did in the panic into march 23 2020 gold ratio and spirals in time panic due 3/18 to 3/21 2020 posted in feb 2020 .I will be posting the spirals and more over the weekend into the new year Best of Trades WAVETIMER
TROW Follow the Real MONEY wave e of B ending The chart posted is and has been a chart to which I have felt the real underlying market moves are true!! We are now fast approaching the final move up in wave E to end the B wave that started in SUPER CYCLE decline from My forecast 12/8 2021 the BULL MARKET ENDED from 1974 and maybe 1932 . So what next well the golden ratio spirals and cycles oct 10th to 20th focus on the 10th dec turn on the 24th and march 10/23 turns have been working well or should I say I been trusting my judgement of the cycles . What is a head we are now coming into the May 9th +or - 1 date then then the GRANDDADDY june 10 to the 23 this is the BIG one it is 6.5 to 7 spirals infact the peak sept 1929 and aug 25th 1987 as well as the other 5 all that week.
MAJOR CRASH CYCLE IS READY TO START NOW SPIRAL F17 The chart posted is that of RSP sp 500 equal weighed The spiral cycle are in the window from today to may 12 .I AM LOOKING FOR A CRASH TO BEGIN I AM MOVING TO A 75 TO 80 % NET SHORT TODAY HERE AT 4155 I WILL MOVE TO 90 % SHORT AT 4100 ON A STOP OR IF WE RALLY ABOVE 4171
GS WAVE C CRASH EARLY STAGEThe chart posted is my top wave count based on ew and cycles I do not in anyway see the Fed coming to the rescue the cycles I stated in dec 2021 are clear the deflation of ALL assets min downside is and will be at or about the march 23 low 2020. . I have been every clear based on 121 years of data the 20 month avg turned down and had 90 days to overcome the 4250 area in the sp 500 we have now passed it 3 days ago we are only mid point in the Bear Market and the worst has yet to come . The fed will reduce the balance sheet over the next 24/30 months and based on the Mandate of 1913 to keep INFLATION under control .I stated in dec 2021 the we ended a super cycle bull market dated back to 1974 and most likey to 1932 under both views my target of 3511/3490 was going to be the first leg down . We ended the abc rally into aug 16th as the forecast called for then dropped into the time cycle due oct 4th to the 20th focus oct 10th we have rallied into alt date for wave 2 into feb top the only way to view this drop at BEST is a wave B . I have moved all my funds into us T BILLS . the wave C CRASH based on all the data back to 1902 has min date is OCT 2023 and No New BULL MARKET till OCT 2024 The DEPRESSION LOW . BEST OF TRADES WAVETIMER . I ALWAYS SAID I WOULD BE HONEST AND STRAIGHT FORWARD


