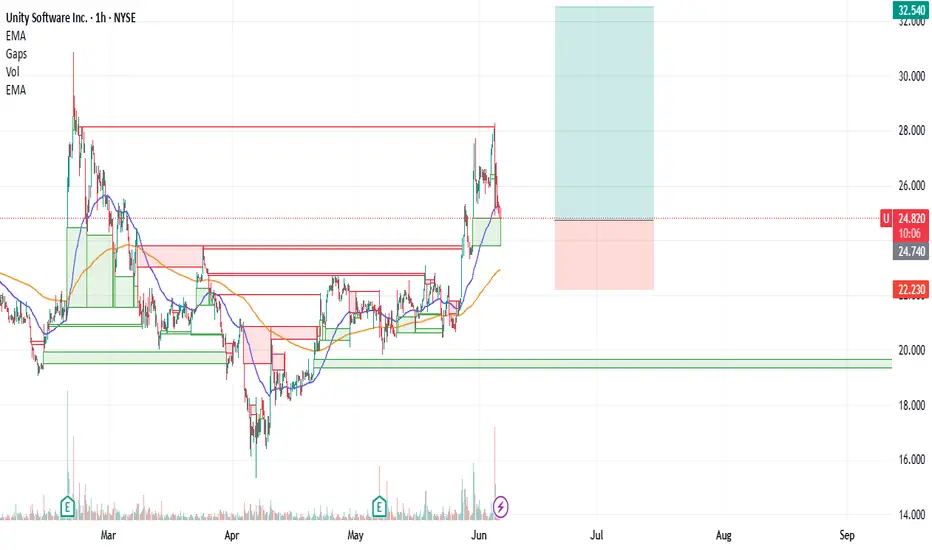
U : Long There were both good and bad developments for Unity.
While the joint project opportunity with BMW Group is very positive news,
Departure of the current CEO was negative news.
Technically, it is above the 50 and 200 period moving averages, and the 50 period ema is also above the 200 period ema.
A risk/reward ratio of 3.00 can be evaluated, with the Stop-Loss being close to the 200-period ema and the target price being targeted at the large gap closing value.(Small position size)
Entry : 24.76 - 24.81
Risk/Reward Ratio : 3.00
Stop-Loss : 22.23
Take Profit Level: 32.54
Nyse
NuScale Power Corp. (SMR) – Leading the Nuclear RenaissanceCompany Overview:
NuScale NYSE:SMR is pioneering small modular reactor (SMR) technology—offering a scalable, carbon-free solution for baseload energy at a time when AI, quantum computing, and data centers are driving unprecedented power demand.
Key Catalysts:
Regulatory Leadership 🏛️
Only SMR design approved by the U.S. Nuclear Regulatory Commission (NRC) ✅
Creates a regulatory moat—a multi-year head start over competitors
Enhances institutional credibility and accelerates deployment
Global Flagship Project: RoPower, Romania 🇷🇴
462 MW project → pre-orders already underway
Final investment decision by year-end could validate tech and unlock global markets
First major deployment in Europe signals international expansion readiness
Explosive Growth Outlook 🚀
77% forecasted revenue CAGR through 2025 vs. industry avg of 8.3%
62% reduction in per-share losses expected → strong operating leverage
Positioned to meet clean energy mandates and private sector demands for resilient, low-carbon power
Investment Outlook:
✅ Bullish Above: $27.00–$28.00
🎯 Price Target: $48.00–$50.00
📈 Thesis Drivers: First-mover advantage, regulatory approval, and global SMR project pipeline
⚛️ NuScale isn’t just building reactors—it’s building the future of energy. #SMR #NuclearEnergy #CleanPower

UNH : Are Bad Days Over ? (Cautious)UNH shares have moved above the 50-period moving average but are trading below the 200-period moving average.
For now, since the 200-period moving average is very high, a small trade can be tried by keeping the stop-loss level a little tight.
A few weak movements may pull the average down and the price may break the average.
Therefore, small position sizes are ideal.
NOTE : If we can maintain persistence on 376(Which will take a few days),
then we will look at the other gaps.
Risk/Reward Ratio : 2.39
Stop-Loss : 274.99
Take- Profit Level : 376.38
Regards.

Mastercard: Approaching the Top of Wave BMastercard has rebounded after a brief cooling period, and we now expect turquoise wave B to complete just below resistance at $620. Once that top is in, wave C should drive a meaningful retracement, ending with the low of magenta wave (4). Alternatively, if turquoise wave alt.(4) has already bottomed — which we estimate as a 40% probability — then a direct breakout above $620 would suggest a shift toward a much more aggressive advance. That path would take the stock straight into magenta wave (5), completing blue wave (I) with a strong rally.
📈 Over 190 precise analyses, clear entry points, and defined Target Zones - that's what we do.

Gold 01.06.2025, SundayExpecting bullish price delivery on gold to make a All Time Highs. Before the meltdown on the quarterly Fair Value Gap

NVDA looks to go downNVDA is not maintained its support level of 138.24 and its expect to fall support level of 129.12. Wait for fresh entry it it fall to 129.12 or rise to 138.24.
Note: This is not a buy/sell trade call.

Toast, Inc. (TOST) – Powering the Future of RestaurantsCompany Snapshot:
Toast NYSE:TOST is cementing its position as the go-to restaurant operating system, offering integrated solutions for payments, POS, inventory, and guest engagement—all tailored for food service businesses.
Key Catalysts:
Recurring Revenue Powerhouse 💸
ARR hit $1.7B in Q1 2025 — up 31% YoY
SaaS-driven model provides high visibility and stickiness
Expanding Client Base & Network Effects 📈
Serving ~140,000 locations, up 25% YoY
More locations = richer data + stronger product improvement + increased client lock-in
Enterprise-Grade Momentum 🏢🍔
Wins with Applebee’s (~1,500 locations) and Topgolf demonstrate Toast's scalability
Validates ability to support complex, high-volume operators
Operating Leverage in Motion ⚙️
As ARR scales, margins improve—positioning Toast for profitable growth over time
Investment Outlook:
✅ Bullish Above: $37.00–$38.00
🚀 Target: $60.00–$62.00
📈 Growth Drivers: Enterprise adoption, recurring revenue, SaaS scale, network effects
💡 Toast is becoming the digital backbone of modern restaurants—serving up growth with every seat. #TOST #SaaS #RestaurantTech

NQ Daily Orderflow, MMXM swing points Market Efficiency ParadigmDaily orderflow on NQ. How it formed why it formed. Using Internal Liquidity and sub Internal Liquidity

IBM: Bullish AttemptsIBM has made progress in our scenario: Currently, the price is rising above the crucial resistance at $265.72; clearly surpassing this mark is important in the ongoing wave (3) in magenta. While we cannot entirely remove our alternative scenario with a new low for wave alt. in green, it still holds a 33% probability. We primarily expect that the regular wave in green was already completed at $211.52 and are therefore preparing for a direct continuation of the increases in the broader wave in green.
📈 Over 190 precise analyses, clear entry points, and defined Target Zones - that's what we do.

Nasdaq 100. Mistakes and Daily Orderflow 27.05.25Covered the mistakes that I have made while reading the price. Wanted the shorts although the daily and the 4H suggested bullish price action. The good think was didn't forced. Just left the market after booking partials and breakeven
Post that took one long towards the Volume Imbalance

Weekly Walkthrough on Currencies & CommoditiesCovering weekly price action on majors and other assets. Outlined the weekly displacements along with proper reasoning. Go ahead check it out

BURL – Final Wave 5 in Rising Channel, Fake Breakout PossibleBURL has completed a full 5-wave advance within a rising channel, ending in wave (v) of C. Current price is testing the top of the channel with a minor upper wick breakout — a common occurrence in wave (5) tops.
Historically, wave (5) often ends with a fake breakout above the channel, followed by a rapid breakdown through the channel base. Price has not yet broken below the lower boundary of the rising structure, which remains the key level for confirmation.
The target zone for potential correction lies between $245–250, aligned with prior wave (iv) consolidation and visible support.
No trade is valid until a decisive break below the rising channel. As long as the lower bound holds, the structure remains intact.
Key Levels:
Resistance: $272 (fake breakout zone)
Support: Rising channel base (~$267)
Bearish Target (after breakdown): $245–250
Conclusion:
Watch for confirmation of breakdown. Fake breakouts above channel top are common in wave (5) endings. Entry valid only below lower trendline.

HSBC (HSBC) – $54 Risk Zone if ABC Correction Is Triggered HSBCHSBC is currently trading within a rising wedge, but a potential short-term drop of approximately 5% could trigger a full ABC correction pattern. This scenario is not confirmed yet, as the chart remains structurally bullish.
However, should the price reverse and break below the rising channel, it would likely mark the start of wave C, completing an A-B-C corrective sequence. This development could lead the price toward the $54 support zone, which aligns with a previous demand area.
While there is no immediate breakdown or weakness, traders should remain alert. A simple -5% drop might be all it takes to activate the next phase of correction.
Pattern: Potential ABC correction
Trigger: 5% decline from current levels
Target: $54
Bias: Neutral – watch for reaction if price softens

VIX SPY500 forecast until end of June 2025VIX S&P500 Index is in reversal. Downward movement has ended. Uptrend is starting now. All the way until end of June 2025 VIX will grow and steadily and surely.
Bottom is now at 18.18 and possible interim top is at 36.54
This view is supported by my forecast of S&P500 for June 2025.
For more updates on 1D chart click social media links in my profile.

S&P 500 1W forecast until mid June 2025It's in reversal now. Uptrend has finished and downtrend is starting. A fall downto 5105 is on the table. It may last until the middle of June 2025.
This view is also supported by my VIX forecast.
Weekly updates of 1D chart are available through social media links in my profile.

Nu Holdings (NU, 1D) — Technical AnalysisNu Holdings (NU, 1D) — Technical Analysis: Trendline Breakout, EMA/MA Confirmation, Recovery Toward Key Levels
On the daily chart, Nu Holdings has broken out of a descending trendline, signaling a potential structural reversal. The breakout was confirmed by a close above key exponential and simple moving averages (EMA 50/100/200), with the EMAs beginning to align in a bullish sequence. The price has held above the critical Fibonacci retracement level at $11.73 (0.618), which now serves as a key demand zone. Volume shows signs of increasing during upward impulses, suggesting accumulation interest. The current recovery structure indicates potential targets at $12.58 (0.5 Fibonacci), followed by $13.42 (0.382) and $14.46 (0.236). A more extended move could lead toward the previous supply zone near $16.15 if momentum persists.
From a fundamental standpoint, Nu Holdings continues to attract investor attention within the fintech sector, especially amid broader rotation back into growth and tech-driven financial platforms. The company's expanding market presence and improving financial metrics may support the current technical setup. As long as the price holds above the broken trendline and maintains strength above the key $11.73 level, the bullish scenario remains in focus with targets pointing toward the $13.42–$14.46 range and potentially higher in the medium term.

karman holdings (recent listing, new IPO)A chart view of the recent listing of Karman Holdings. The company appears to be headed in the right direction.

Merck & Company Potential Post Tariff Resolution Bullish RallyWith potential developments towards the resolution of global tariffs and pharma being defensive in general, MRK price action seems to exhibit signs of a potential Bullish reversal breakout as the price action may form a prominent Higher High with multiple confluences through key Fibonacci and Support levels which presents us with a potential Non-Leverage hold opportunity.
Entry: (Buy 1 CMP 76.2 & Buy 2 87.6)
Stop Loss: 45 or 0 (depends on trading style as Non-Leverage Buy & Hold is recommended)
Potential Range for Targets: 130 - 170

E mini Nasdaq 100. Weekly walkthroughWeekly walkthrough on NQ. Huge gap up and continuation weekly profile towards the Major Buyside Internal Liquidity

Clean Energy: The Power That Will Shape Our FutureEnergy is the lifeblood of civilization—it fuels innovation, sustains economies, and powers every aspect of modern life. As demand skyrockets, we face a crucial decision: continue relying on fossil fuels that damage our planet or embrace clean energy solutions that pave the way for a sustainable future.
Despite geopolitical tensions, trade wars, and shifting policies around ESG and the Paris Climate Agreement, the clean energy sector remains unstoppable. While industries like digital finance, artificial intelligence, robotics, space exploration, quantum computing, and cloud infrastructure are experiencing unprecedented growth, they all hinge on one fundamental resource: energy. Without it, progress would stall.
Yet, as we race toward technological advancement, one truth remains: our planet’s well-being is inextricably linked to our energy choices. Sustainability is not just an option—it is a necessity.
The Four Elements of Clean Energy
Nature has already gifted us four forces of life—the sun, wind, water, and earth—each holding the potential to drive a clean energy revolution.
Solar Energy ☀️: Every hour, the sun showers Earth with more energy than humanity consumes in a year. Advances in photovoltaic technology are making solar power more efficient and affordable than ever. Countries leading the solar revolution—like China, Germany, and the U.S.—are setting a precedent for global energy transformation.
Wind Energy 🌬️: Harnessing the wind is one of the most effective ways to generate clean electricity. Offshore wind farms are growing at an exponential rate, proving that sustainable energy is not limited to land. The beauty of wind energy? It is limitless.
Hydropower 🌊: Water is power. Hydroelectric dams, tidal energy, and wave power offer continuous energy supply, proving to be one of the most reliable renewable sources available.
Geothermal Energy 🌍: Deep within the earth, heat energy is waiting to be tapped. Countries like Iceland have perfected the art of using geothermal power for electricity and heating, demonstrating that sustainable energy is not just a dream—it’s already reality.
Overcoming Challenges: The Resilience of Clean Energy
Yes, clean energy faces obstacles—tariff disputes, political instability, and corporate resistance. But progress is relentless. Costs of renewables are dropping, supply chains are adapting, and governments know that fossil fuels will not sustain global economies forever.
The Paris Climate Agreement keeps nations accountable, pushing for policies that support decarbonization and incentivize clean energy innovation. Meanwhile, ESG-driven investors are demanding sustainable business practices, forcing corporations to rethink their energy strategies.
Even legacy industries like oil and gas are shifting toward renewables, investing billions in solar, wind, and hydrogen technology. This is not just a trend—it is the future.
A Future Powered by Clean Energy
Imagine cities illuminated by solar grids, transportation fueled by hydrogen, and industries driven by wind power. Clean energy is not just about reducing emissions—it is about progress, prosperity, and survival.
The global energy demand is rising, but so is innovation. If space exploration, AI, robotics, and quantum computing are to thrive, clean energy must be at the core. And it will be—because the world is waking up to its necessity.
A cleaner, brighter future is not wishful thinking—it is already unfolding. The only question is: will we accelerate the transition, or hesitate in the face of change?
The time to act is now.
NASDAQ:CLNE NASDAQ:CETY NASDAQ:ICLN NASDAQ:CELS NASDAQ:GWE AMEX:PBD TVC:DXY

NQ weekly review and Outlook. FOMC week CME_MINI:NQ1!
Expecting buyside expansion on NQ. Lets see how we react in here.

TSLA: Low Is In , Rally IncomingTSLA is showing signs of strong accumulation, with buyers consistently stepping in and volume expanding on up-moves. Price structure is improving, breakouts further confirm strength, increasing the likelihood that bears have been left behind. Based on the price action and volume alone, TSLA looks ready for a potential sustained move higher.

NVDA walkthrough. NDOG+SMT Divergence. Intermarket CorrelationNASDAQ:NVDA
Pairing the NVDA and NQ to understand the direction of the expansion. Although IOF is enough with ES. But if you want to trade the stocks primarily you can use this
