NZD hit 52W low | SHORT TRADE- Alright, I like this trade because it's trending towards the downside on the higher time frames. If we look at the daily TF, we can see multiple rejections off MA 20, suggesting that sellers are really in control of the market.
- On a 4-hour time frame, the price broke both moving averages and we have a recent 1-hour bearish engulfing candlestick suggesting further bearish movement.
- Both currency pairs are being sold off by the hedge funds, but NZD is being sold off more heavily since it hit a 52-week low.
- If support is broken, there is a possible push > exhaustion scenario, and the trade will continue to move down.
NZD-CHF

NZDCHF Short and CHF on the recovering path.Hey traders, in the coming week we are monitoring NZDCHF for a selling opportunity around 0.626 zone, once we will receive any bearish confirmation the trade will be executed.
Trade safe, Joe.

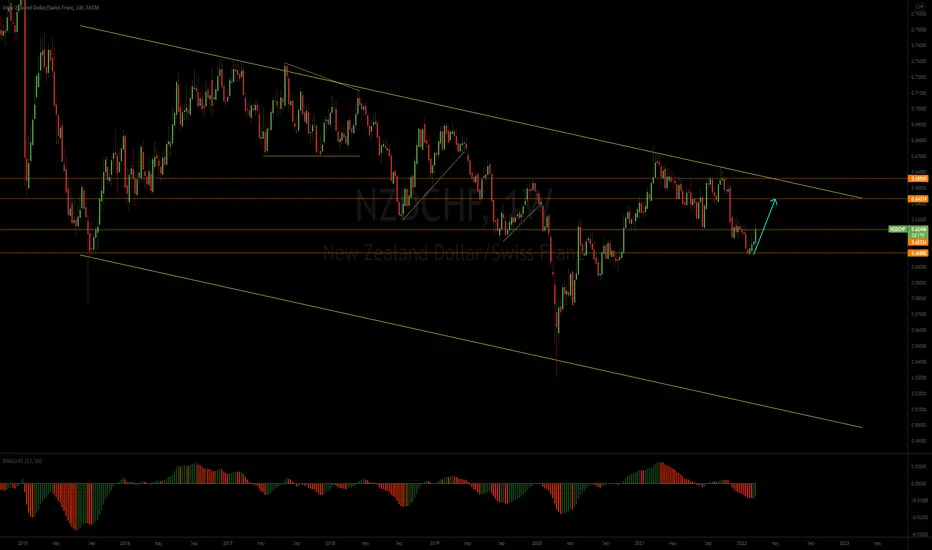
NZDCHF: Keep an eye on this up wave!Hey Traders, looks like NZDCHF will be pushing up soon, why are we expecting this up wave?
A complex corrective structure is completed and market is ready to push up.
So, should you jump in? No, wait for your buy setup and you go for the buy. What if market continue the fall? We will not enter before we get our buy setups.
What if you are already in the sell? You take all your profits and look for your buy setups.
For us, the structure needs an up move to target liquidity above previous highs, what after that? corrective structure and another push up but let's take it step by step.
Even if market wants to continue to the downside, a corrective structure upwards is needed so we will be looking for our buy setups for now anyway.
We hope all of you get in few of our previous charts/trades like USDCAD, USOIL, EURCAD, NZDUSD, GBPAUD and made money.
If you want us to post more charts, setups and explain more about the next move, make sure to follow us, like and comment.
What we are sharing here is only our point of view on what could be the next move in the market based on our wave analysis concept so this is a directional bias and not signals...
DO NOT FORGET OUR 4 GOLDEN RULES:
1) Do not over-risk
2) Do not over-trade
3) Do not trade without stop loss
4) Never ever add to losing position
Trade with care
We Trade Waves Team

NZD/CHF still in a downtrend, although pullback is expectedNZD/CHF bounced off the long-term downtrend trendline implying further downside pressure. Lower lows and lower highs are printed without any signs of a trend reversal.
While the prevailing trend remains bearish, we should expect a relatively strong pullback, potentially towards the 0.6326 zone. If NZD/CHF reaches this resistance, we will be looking for a selling opportunity.

NZDCHF | BEARISH trade OPPORTUNITY 📉- There's a solid chance for a short trade here.
- Multiple time frames show a downward trend, and a weekly bearish engulfing candlestick pattern is forming, indicating bearish power in the market.
- Closed bearish engulfing candle on the 1-hour time frame, it bounced off of a recent resistance area.
- In addition, NZD is being sold off by hedge funds, which is in our favor.

NZDCHF A safe long-term sell optionThe NZDCHF pair has been under the selling pressure of a Lower Highs zone for more than 5 years (since December 2016), forming a long-term bearish Channel that is more accurately illustrated by the Fibonacci Channel extensions and retracements. This zone has rejected the price 7 times with the most recent being on the March 28 2022 1W (weekly) candle. This chart is on the 1W time-frame.
What makes NZDCHF an even stronger long-term sell opportunity, is that the price action from December 2020 until today, resembles the sequence from May 2016 to August 2017. Common characteristics besides the price action and the three Lower Highs zone rejections, include the 1W RSI sequences and the 1W MA50 (blue trend-line)/ 1W MA200 (orange trend-line) convergence.
After the 3rd rejection, the price dropped to the Support of the last Lower Low of the Channel. Right now this Support is at 0.60800 and this is our target within Q3 of this year.
--------------------------------------------------------------------------------------------------------
Please like, subscribe and share your ideas and charts with the community!
--------------------------------------------------------------------------------------------------------

💡Don't miss the great buy opportunity in NZDCHFTrading suggestion:
". There is a possibility of temporary retracement to the suggested support line (0.6398).
. if so, traders can set orders based on Price Action and expect to reach short-term targets."
Technical analysis:
. NZDCHF is in a range bound, and the beginning of an uptrend is expected.
. The price is below the 21-Day WEMA, which acts as a dynamic resistance.
. The RSI is at 48.
Take Profits:
TP1= @ 0.6440
TP2= @ 0.6472
TP3= @ 0.6507
TP4= @ 0.6534
TP5= @ 0.6559
SL= Break below S2
❤️ If you find this helpful and want more FREE forecasts in TradingView
. . . . . Please show your support back,
. . . . . . . . Hit the 👍 LIKE button,
. . . . . . . . . . Drop some feedback below in the comment!
❤️ Your support is very much 🙏 appreciated! ❤️
💎 Want us to help you become a better Forex / Crypto trader ?
Now, It's your turn !
Be sure to leave a comment; let us know how you see this opportunity and forecast.
Trade well, ❤️
ForecastCity English Support Team ❤️

💡Don't miss the great buy opportunity in NZDCHFTrading suggestion:
". There is a possibility of temporary retracement to the suggested support line (0.6398).
. if so, traders can set orders based on Price Action and expect to reach short-term targets."
Technical analysis:
. NZDCHF is in a range bound, and the beginning of an uptrend is expected.
. The price is below the 21-Day WEMA, which acts as a dynamic resistance.
. The RSI is at 48.
Take Profits:
TP1= @ 0.6440
TP2= @ 0.6472
TP3= @ 0.6507
TP4= @ 0.6534
TP5= @ 0.6559
SL= Break below S2
❤️ If you find this helpful and want more FREE forecasts in TradingView
. . . . . Please show your support back,
. . . . . . . . Hit the 👍 LIKE button,
. . . . . . . . . . Drop some feedback below in the comment!
❤️ Your support is very much 🙏 appreciated!❤️
💎 Want us to help you become a better Forex / Crypto trader?
Now, It's your turn!
Be sure to leave a comment; let us know how you see this opportunity and forecast.
Trade well, ❤️
ForecastCity English Support Team ❤️

Sell NZDCHFAfter the price retested the Quarterly high we saw the price rally to the downside and the downtrend was confirmed by the breaker block that was created.
I am anticipating that there will be a continuation to the downside so the liquidity void below can be filled.
Like and Subscribe.

NZDCHF LongHey traders, in today's trading session we are monitoring NZDCHF for a buying opportunity around 0.63200 zone, once we will receive any bullish confirmation the trade will be executed.
Trade safe, Joe.

NZDCHF BUY SCALP OPPORTUNITY Welcome back! Here's a potential buy scalp opportunity for KiSS 2.0 Strategy or whatever entry criteria you use.
**NZDCHF - listen to video analysis.
We recommend that you keep this pair on your watchlist and enter when the entry criteria of your strategy is met.
Please support this idea with a LIKE and COMMENT if you find it useful and Click "Follow" on our profile if you'd like these trade ideas delivered straight to your email in the future.
Thanks for your continued support!
Brian & Kenya Horton, BK Forex Academy

NZDCHF LongHey traders, in today's trading session we are monitoring NZDCHF for a buying opportunity around 0.636 zone, once we will receive any bullish confirmation the trade will be executed.
Trade safe, Joe.

nzdchfhi every one we can see price break that trend line and we have 2 option for now
trading range or price break this support and price going down

⭕️SELL NZDCHF 🔻 🧐⭕️You see the analysis of the New Zealand dollar against the Swiss franc in Daily (NZDCHF , 1D)🔎
🔰Trend lines are shown in white. According to the price behavior and price collision with trend lines, a downward trend is predicted❗️The support line is marked in orange.
We set the target at the intersection of the downtrend line and the support line👌
⚠️⚠️Please observe capital management and open a low volume transaction❗️❗️
I hope this analysis is useful for you🙏🏻🌹
📌Please introduce the "TRADER STREET" to your friends 🙏🏻
__________________📈TRADER STREET📉_________________

NZDCHF - SHORTWe can see a rebound from the resistance on descending channel, while matching up with our Fib levels on a daily. Our first target will be the 0.6194 level

NZDCHF/ ShortMy idea today NZDCHF/Short
Sell now 0.64186
SL: 0.64314
TP1: 0.64107
TP2: 0.6400
TP3: 0.63893

NZDCHF - Purple War Zone!Hello everyone, if you like the idea, do not forget to support with a like and follow.
NZDCHF is overall bearish trading inside the brown trendlines .
Moreover, the zone 0.650 is a strong support turned into a resistance.
So the highlighted purple circle is a strong area to look for sell setups as it is the intersection of the green resistance and upper brown trendline. (acting as non-horizontal resistance)
As per my trading style:
As NZDCHF approaches the purple circle zone, I will be looking for bearish reversal setups (like a double top pattern, trendline break , and so on...)
Always follow your trading plan regarding entry, risk management, and trade management.
Good luck!
All Strategies Are Good; If Managed Properly!
~Rich

NZDCHF LongHey traders, in today's trading session we are monitoring NZDCHF for a buying opportunity around 0.649 zone, once we will receive any bullish confirmation the trade will be executed.
Trade safe, Joe.

NZDCHF 4h Trade Idea - Short Opportunity - Good R/RHi Traders,
Here's my view for the NZDCHF for the coming Days, Stoploss and Targets are mentioned in the chart.
STOPLOSS: 0.648$
Targets:
0.597$
0.577$
NFA, DYOR, and Good Luck.

NZDCHF ShortHey traders, in today's trading session we are monitoring NZDCHF for a selling opportunity around 0.645 zone, once we will receive any bearish confirmation the trade will be executed.
Trade safe, Joe.

NZDCHF MARCH 2022I anticipate the price to correct on Weekly time frame.
That Weekly correction may form buy setups on lower time frames.
NZDCHF Multi-Timeframe AnalysisHello Traders,
We are looking for long opportunities on NZDCHF
If all our entry rules are met we will be taking a Buy Entry from 15/5min timeframe.
BIAS: BUY (If our entry rules are met)
Timeframes for high precision entry: 5 mins
Follow for Free Entry Signals on this trade and others from Professional Traders.
IMPORTANT: Risk Management is integral in trading. Please make sure you're using safe risk management principles for your account for all trades.

Going long on NZDCHFTrading within a channel, going long on the short term. Use proper risk management. Happy trading!
