GBPNZD Breakdown – Smart Money Turns Fully Bearish🧠 Macro + COT + Sentiment Context
Commitment of Traders (COT) – Asset Managers
Institutional asset managers are significantly net short on GBPNZD, with positioning at its lowest level of the year and declining sharply since May. This reflects a clear bearish stance from smart money and reinforces the current downward pressure.
Sentiment & Momentum Indicators
DPO: -54.9 → Indicates a moderately bearish momentum phase.
Wyckoff: -20.3 → Price is in a distribution phase, suggesting weakness.
Speed: 3.2 → Low acceleration, but directional bias remains bearish.
Market Mood: Neutral, but leaning into oversold territory.
Seasonality (July 1st – Sept 30th)
Historically, GBPNZD performs positively in this period:
3Y: +1.7%, 5Y: +1.6%, 10Y: +2.3%, 15Y: +2.8%
However, in 2025, price is diverging sharply from seasonal norms. The pair is trading against historical patterns, suggesting a seasonal anomaly where institutional flow is dominating historical behavior.
🧱 Technical Outlook (Daily Chart)
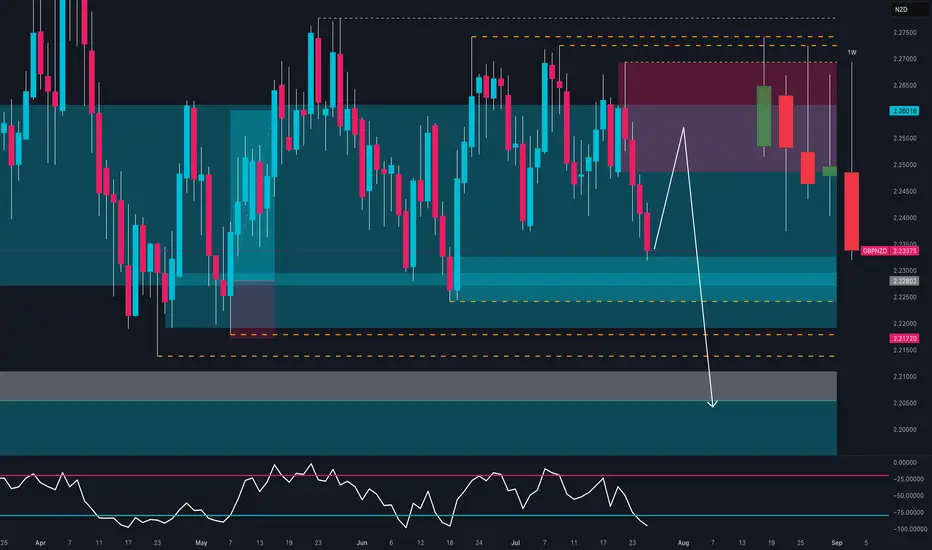
GBPNZD had been consolidating in a clear range between 2.2170 support and 2.2750 resistance since May. The pair has now broken down with a strong, full-bodied weekly candle, closing below the 2.2320 demand zone.
Key Technical Zones:
Supply zone (2.2494–2.2659) → A clear rejection zone that initiated the current selloff.
Demand zone (2.2170–2.2300) → Has been tested twice already, increasing the probability of a clean breakdown.
RSI (Daily) → Currently neutral, with a sequence of lower highs and no bullish divergence in sight — indicating weak momentum.
✅ Conclusion & Trade Plan
Directional Bias: Bearish (Short)
Although seasonality typically supports bullish price action for GBPNZD in Q3, the current context is decisively bearish. Institutional positioning, price structure, and sentiment all confirm a potential shift in direction, reinforced by a confirmed weekly breakdown.
Bearish Targets:
📍 First: 2.2170 (recent support test)
📍 Second: 2.2000–2.1900 (April swing low)
📍 Extension: 2.1750 (base of previous accumulation zone)
Invalidation Criteria:
A weekly close above 2.2490 (supply zone breached)
Bullish RSI divergence + weekly recovery candle
NZD (New Zealand Dollar)
GBP-NZD Will Keep Falling! Sell!
Hello,Traders!
GBP-NZD keeps falling down
And the pair made a strong
Bearish breakout of the key
Horizontal key level of 2.2400
And the breakout is confirmed
So we are bearish biased and
We will be expecting a further
Bearish move down on Monday
Sell!
Comment and subscribe to help us grow!
Check out other forecasts below too!
Disclosure: I am part of Trade Nation's Influencer program and receive a monthly fee for using their TradingView charts in my analysis.

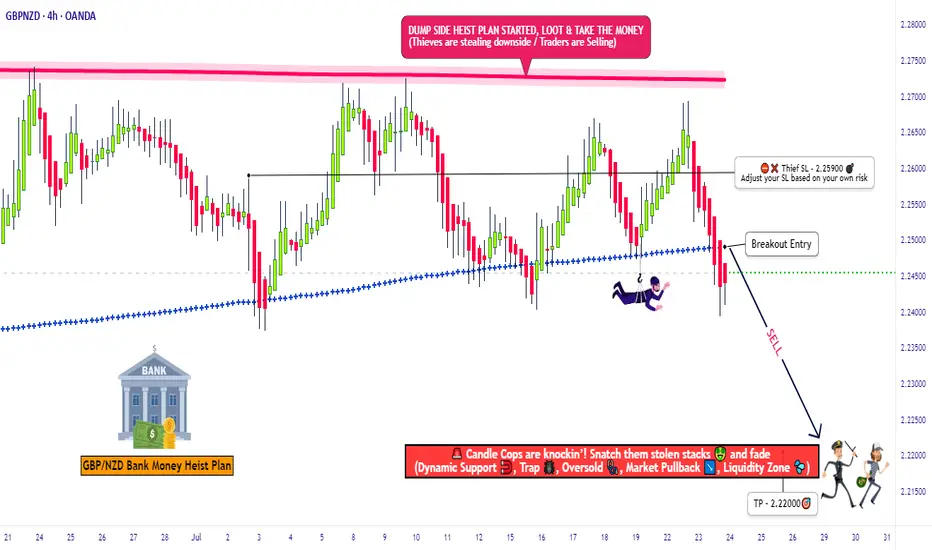
"GBP/NZD: Bearish Storm Brewing – Get Ready!🚨 GBP/NZD HEIST ALERT: "Pound vs Kiwi" Bearish Trap Setup! 🚨 (Scalping/Day Trade)
🌟 Attention, Market Robbers & Profit Pirates! 🌟
🔥 Thief Trading Strategy Activated – Time to short the GBP/NZD like a pro! This pair is setting up for a bearish heist, and we’re locking in entries before the drop. High-risk, high-reward? You bet.
🎯 TRADE PLAN (Bearish Ambush)
Entry Zone (Short) 📉:
Optimal: Sell limit orders on retests (15m/30m timeframe).
Thief’s Trick: Layer entries (DCA-style) near recent highs for max efficiency.
"Enter like a sniper, escape like a ghost." 👻
Stop Loss 🛑:
4H Swing High/Wick (Near 2.25900) – Adjust based on your risk & lot size.
"A smart thief always has an exit route." 🏃💨
Target 🎯: 2.22000 (or escape early if the trap snaps shut!)
💣 WHY THIS HEIST? (Bearish Triggers)
Technical Setup: Oversold bounce? Nah. Consolidation → Reversal trap.
Fundamentals: Weak GBP sentiment? Strong NZD data? Check the news!
Market Psychology: Bulls are getting trapped at resistance—time to fade them.
⚠️ THIEF’S WARNING
News = Volatility Bomb 💣 – Avoid new trades during high-impact events.
Trailing SLs = Your Best Friend – Lock profits & dodge reversals.
💎 BOOST THIS IDEA & JOIN THE HEIST!
🔥 Hit 👍 LIKE, 🚀 BOOST, and FOLLOW for more lucrative robberies!
💸 "Steal the market’s money—before it steals yours." 🏴☠️
🔔 Stay tuned—next heist coming soon! 🔔
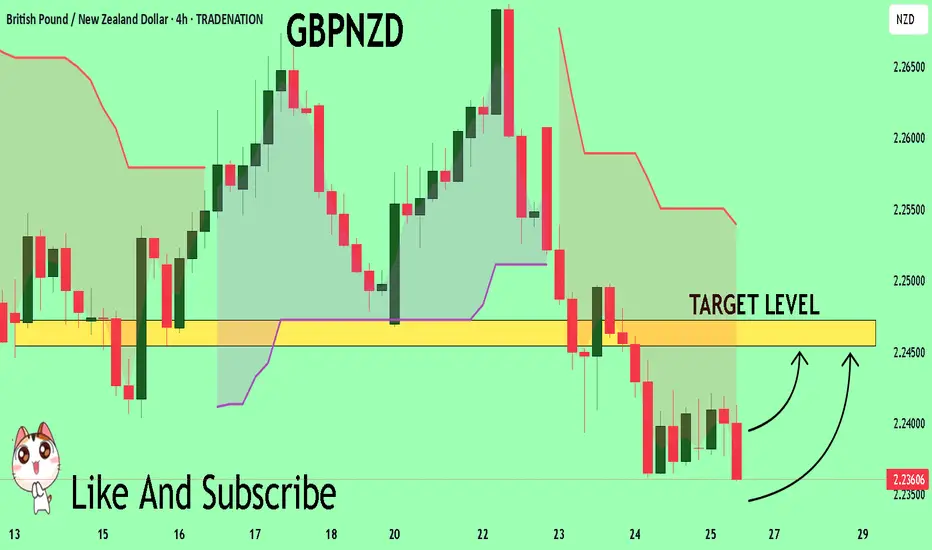
GBPNZD Bearish Breakout!
HI,Traders !
#GBPNZD is trading in a strong
Downtrend and the pair
Broke the key horizontal
Level around 2.23918 which
Reinforces our bearish
Bias and we will be
Expecting a further
Bearish move down
On Monday! !
Comment and subscribe to help us grow !

NZDCHF is in the Bearish Side due to Bearish TrendHello Traders
In This Chart NZDCHF HOURLY Forex Forecast By FOREX PLANET
today NZDCHF analysis 👆
🟢This Chart includes_ (NZDCHF market update)
🟢What is The Next Opportunity on NZDCHF Market
🟢how to Enter to the Valid Entry With Assurance Profit
This CHART is For Trader's that Want to Improve Their Technical Analysis Skills and Their Trading By Understanding How To Analyze The Market Using Multiple Timeframes and Understanding The Bigger Picture on the Chart

NZD/JPY BEARS ARE STRONG HERE|SHORT
Hello, Friends!
Previous week’s green candle means that for us the NZD/JPY pair is in the uptrend. And the current movement leg was also up but the resistance line will be hit soon and upper BB band proximity will signal an overbought condition so we will go for a counter-trend short trade with the target being at 88.302.
Disclosure: I am part of Trade Nation's Influencer program and receive a monthly fee for using their TradingView charts in my analysis.
✅LIKE AND COMMENT MY IDEAS✅

"NZD/CAD Reversal Play – Ride the Bullish Wave!🦹♂️💰 "THE KIWI-LOONIE HEIST: High-Voltage Forex Robbery Plan (NZD/CAD)" 💰🦹♂️
🌍 Attention all Market Pirates, Thieves & Profit Bandits! 🌍
🔥 Thief Trading Alert – NZD/CAD Bullish Heist Setup! 🔥
The "Kiwi vs Loonie" is setting up for a high-risk, high-reward robbery—and we’re locking in the master plan. Long entry is the play, but this ain’t for the weak hands. Overbought? Consolidation? Reversal trap? Perfect. That’s where we strike.
🎯 THE HEIST BLUEPRINT
🔑 ENTRY ZONE (Breakout & Retest Strategy)
"Wait for the 4H candle to CLOSE ABOVE 0.82600 (MA Breakout + Retest)."
Option 1: Place a BUY STOP above the MA (momentum confirmation).
Option 2: BUY LIMIT near recent swing lows (15M/30M precision).
🚨 Set an ALERT! Don’t miss the breakout—timing is everything.
🛑 STOP LOSS (Escape Route)
SL at 0.82000 (near swing low wick on 4H).
⚠️ Golden Rule: NO ORDERS BEFORE BREAKOUT! Wait for confirmation.
Adjust SL based on your risk, lot size, and multi-order strategy.
🎯 TARGETS (Profit Escape Plan)
Take Profit 1: 0.83300 (First resistance).
Or… Exit Early if the market turns shaky.
Scalpers: Long-only scalp plays! Use trailing SL to lock in gains.
⚡ THIEF TRADER PRO TIPS
✅ Fundamental Backing: Check COT reports, macro trends, intermarket signals.
✅ News Alert: Avoid new trades during high-impact news—protect open positions with trailing stops.
✅ Risk Management: Small lots, multiple entries = smarter heist.
💥 BOOST THE HEIST! (Let’s Get Rich Together) 💥
👉 Smash that 👍 LIKE button to fuel our next robbery plan!
👉 Follow for daily high-voltage setups.
👉 Comment "🚀" if you’re joining the heist!
🤑 NEXT HEIST COMING SOON… STAY TUNED, BANDITS! 🤑
🔥 WHY THIS TRADE? (Thief’s Edge)
Bullish momentum but trapped bears = perfect robbery setup.
Institutional levels + retail traps = our opportunity.
Not financial advice—just a well-planned theft. 😉
⚠️ Warning: Trading = Risk. Only play with funds you can afford to lose.

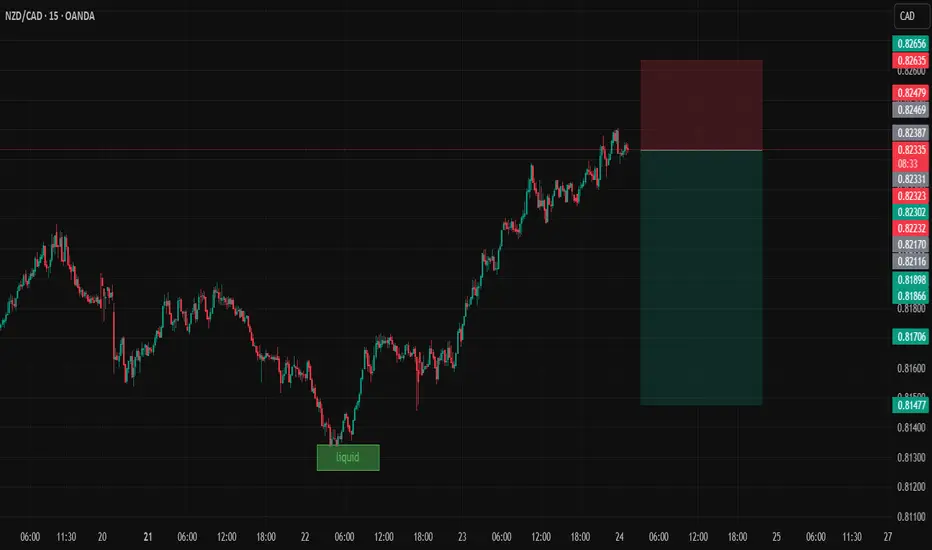
NZDCADDate:
July 24,2025
Session:
Tokyo and London session
Pair:
NZDCAD
Bias:
Short
liquidity pool that is waiting to be swept this week. Looks like price is gonna be magnetized towards that pool level during London and Tokyo. The trade may even stretch into NYC.
Entry: 0.82331
Stop Loss: 0.82635
Target: 0.81475
RR: 2.81
GBP_NZD BEARISH BREAKOUT|SHORT|
✅GBP_NZD is going down currently
As the pair broke the key structure level of 2.2400
Which is now a resistance, and after the pullback
And retest, I think the price will go further down
SHORT🔥
✅Like and subscribe to never miss a new idea!✅
Disclosure: I am part of Trade Nation's Influencer program and receive a monthly fee for using their TradingView charts in my analysis.

NZDCHF – Bullish Breakout Sets Stage for ReversalNZDCHF has broken decisively out of a long-term descending channel, signaling a potential trend reversal. Price action confirmed multiple bullish flags within the falling structure, followed by a clean breakout and higher low retest, supporting a bullish continuation bias.
Currently, the pair is stabilizing just above prior resistance turned support around 0.4760–0.4780, forming a potential launchpad for the next leg higher.
Upside Targets:
TP1: 0.48336
TP2: 0.48844
TP3: 0.49319
Invalidation Zone:
A drop below 0.4720 would invalidate the breakout structure and expose the downside.
Fundamental Drivers:
🇳🇿 NZD Strength: RBNZ remains relatively hawkish compared to other central banks, and the Kiwi may gain from improving risk sentiment and easing global recession fears.
🇨🇭 CHF Weakness: Swiss Franc is under mild pressure as safe-haven flows weaken amid improving tone on US-China-EU trade headlines and fading ECB rate cut bets.
🗓️ Macro Flow: Upcoming risk events (Fed comments, trade updates, and NZ economic prints) could inject momentum into the pair, especially if risk appetite improves.
Bias: ✅ Bullish (Buy)
Confidence: ★★★★☆
Watch for: Clean hold above 0.4770 zone + bullish momentum continuation.

GBPNZD Will Explode! BUY!
My dear friends,
My technical analysis for GBPNZD is below:
The market is trading on 2.2361 pivot level.
Bias - Bullish
Technical Indicators: Both Super Trend & Pivot HL indicate a highly probable Bullish continuation.
Target - 2.2454
About Used Indicators:
A pivot point is a technical analysis indicator, or calculations, used to determine the overall trend of the market over different time frames.
Disclosure: I am part of Trade Nation's Influencer program and receive a monthly fee for using their TradingView charts in my analysis.
———————————
WISH YOU ALL LUCK
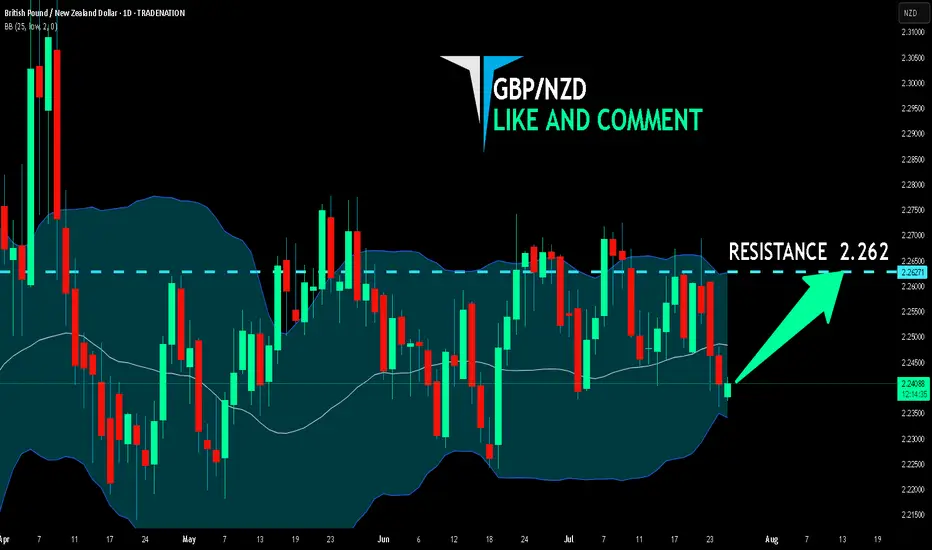
GBP/NZD BEST PLACE TO BUY FROM|LONG
Hello, Friends!
We are going long on the GBP/NZD with the target of 2.262 level, because the pair is oversold and will soon hit the support line below. We deduced the oversold condition from the price being near to the lower BB band. However, we should use low risk here because the 1W TF is red and gives us a counter-signal.
Disclosure: I am part of Trade Nation's Influencer program and receive a monthly fee for using their TradingView charts in my analysis.
✅LIKE AND COMMENT MY IDEAS✅
NZDUSD Potential UpsidesHey Traders, in today's trading session we are monitoring NZDUSD for a buying opportunity around 0.59800 zone, NZDUSD is trading in an uptrend and currently is in a correction phase in which it is approaching the trend at 0.59800 support and resistance area.
Trade safe, Joe.

NZD-CHF Local Bearish Bias! Sell!
Hello,Traders!
NZD-CHF made a retest of
The horizontal resistance
of 0.4810 so we are locally
Bearish biased and we
Will be expecting a
Further bearish move down
Sell!
Comment and subscribe to help us grow!
Check out other forecasts below too!
Disclosure: I am part of Trade Nation's Influencer program and receive a monthly fee for using their TradingView charts in my analysis.

NZD_CAD POTENTIAL SHORT|
✅NZD_CAD has been growing recently
And the pair seems locally overbought
So as the pair is approaching
A horizontal resistance of 0.8260
Price decline is to be expected
SHORT🔥
✅Like and subscribe to never miss a new idea!✅
Disclosure: I am part of Trade Nation's Influencer program and receive a monthly fee for using their TradingView charts in my analysis.

NZD_JPY SHORT FROM RESISTANCE|
✅NZD_JPY is going up now
But a strong resistance level is ahead at 88.900
Thus I am expecting a pullback
And a move down towards the target of 88.572
SHORT🔥
✅Like and subscribe to never miss a new idea!✅
Disclosure: I am part of Trade Nation's Influencer program and receive a monthly fee for using their TradingView charts in my analysis.

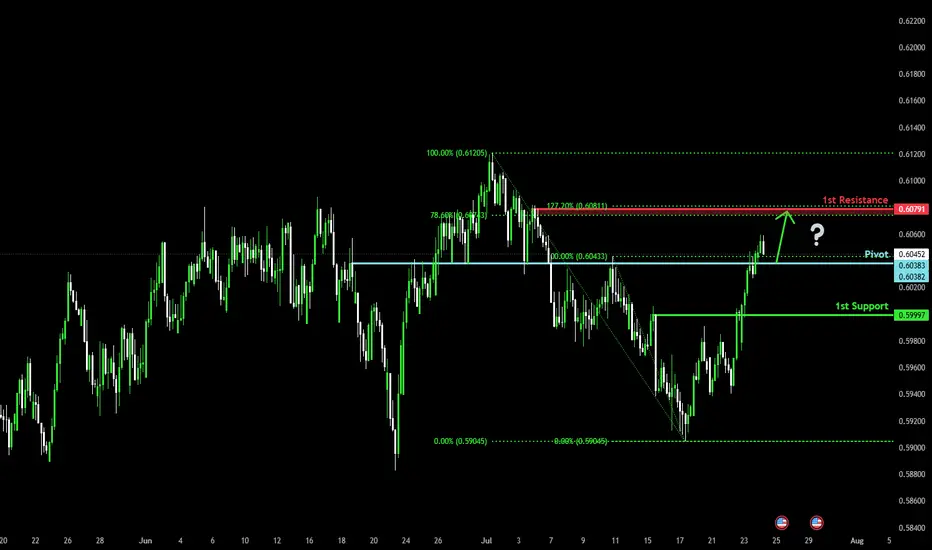
Bullish bounce for the Kiwi?The price is falling towards the pivot, which has been identified as an overlap support and could bounce to the 1st resistance, which acts as a pullback resistance.
Pivot: 0.6038
1st Support: 0.5999
1st Resistance: 0.6079
Risk Warning:
Trading Forex and CFDs carries a high level of risk to your capital and you should only trade with money you can afford to lose. Trading Forex and CFDs may not be suitable for all investors, so please ensure that you fully understand the risks involved and seek independent advice if necessary.
Disclaimer:
The above opinions given constitute general market commentary, and do not constitute the opinion or advice of IC Markets or any form of personal or investment advice.
Any opinions, news, research, analyses, prices, other information, or links to third-party sites contained on this website are provided on an "as-is" basis, are intended only to be informative, is not an advice nor a recommendation, nor research, or a record of our trading prices, or an offer of, or solicitation for a transaction in any financial instrument and thus should not be treated as such. The information provided does not involve any specific investment objectives, financial situation and needs of any specific person who may receive it. Please be aware, that past performance is not a reliable indicator of future performance and/or results. Past Performance or Forward-looking scenarios based upon the reasonable beliefs of the third-party provider are not a guarantee of future performance. Actual results may differ materially from those anticipated in forward-looking or past performance statements. IC Markets makes no representation or warranty and assumes no liability as to the accuracy or completeness of the information provided, nor any loss arising from any investment based on a recommendation, forecast or any information supplied by any third-party.
SELL NZDUSDIn todays session we are actively monitoring NZDUSD for selling opportunity. Our first entry in ASIA session is at 0.60478 we anticipate a short rally up to our second re-entry at 0.60750. Our stops are above 0.6100 and our targets are at 0.59540. Use your own risk management and entry criteria and best of luck.
New algo entry model is under testing.

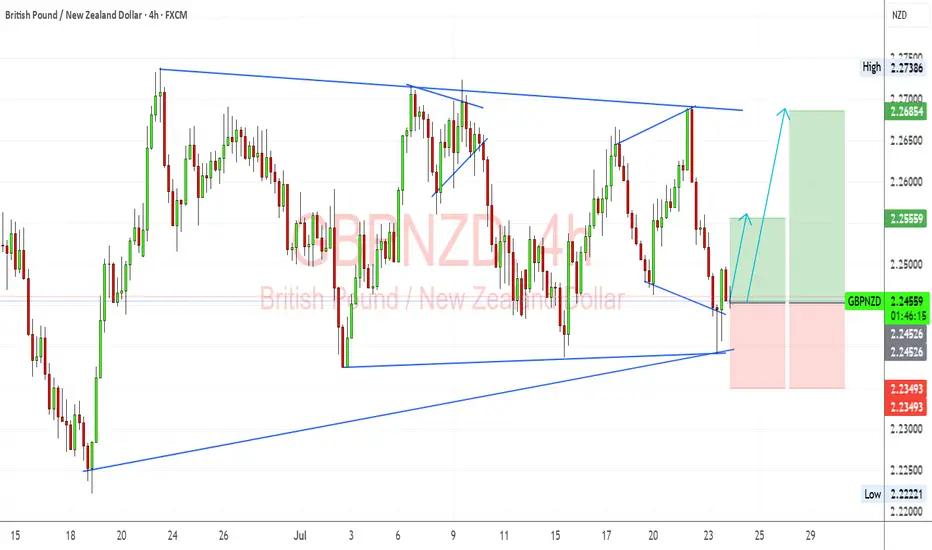
GBPNZD Analysis — 4H Chart ReviewI’m watching GBPNZD for a potential bullish continuation after a successful retest of the long-term ascending trendline. Price rejected near the lower boundary of the symmetrical triangle and showed bullish momentum right off that support. My structure suggests potential upside targets at 2.25559 (minor resistance) and 2.26854 (upper triangle boundary/major resistance zone).
🔍 Fundamental Context:
🇬🇧 GBP Fundamentals:
UK CPI came in softer than expected, and BoE rate cuts are slowly being priced in for late 2025.
However, BoE still sounds relatively hawkish compared to RBNZ due to inflation persistence in services.
Strong UK wage growth and sticky inflation give GBP some near-term yield support.
🇳🇿 NZD Fundamentals:
RBNZ remains on hold, but dovish tilt noted in recent communications.
NZD under pressure from falling dairy prices and weak global growth sentiment (especially China).
Risk-off flows and Fed hawkishness keep NZD vulnerable as a high-beta currency.
⚠️ Risks to the Setup:
A surprise hawkish turn from RBNZ or better-than-expected NZ data could boost NZD.
Renewed UK political instability or weak retail sales data may pressure GBP.
Broader market risk sentiment — NZD may strengthen if risk-on returns and US yields drop.
🗓️ Key News/Events to Monitor:
UK Retail Sales (July 25)
RBNZ Governor Orr Speech (if scheduled)
US PCE (for global risk impact)
Chinese macro data (indirect NZD driver)
🔁 Leader/Lagger Perspective:
GBPNZD often leads EURNZD during GBP-specific catalysts (BoE speeches, UK CPI).
It lags NZDUSD and NZDCAD when risk sentiment or commodity cycles dominate.
📌 Summary: Bias and Watchpoints
I'm bullish on GBPNZD in the short term, especially after a strong trendline retest and recovery off the 2.2450 zone. Fundamentals support GBP resilience over NZD due to relatively hawkish BoE stance and weaker New Zealand data. The main risk to this setup would be a dovish BoE surprise or strong NZ commodity-led rebound. I'll be watching UK Retail Sales and general risk sentiment closely. This pair can act as a leader during UK-specific news but becomes a lagger when risk flows dominate broader NZD direction.
NZDCAD Bullish Breakout!
HI,Traders !
#NZDCAD was trading
Beneath the falling resistance
Line but now we are seeing a
Bullish breakout so we are
Now locally bullish biased
And we will be expecting a
Further bullish move up !
Comment and subscribe to help us grow !

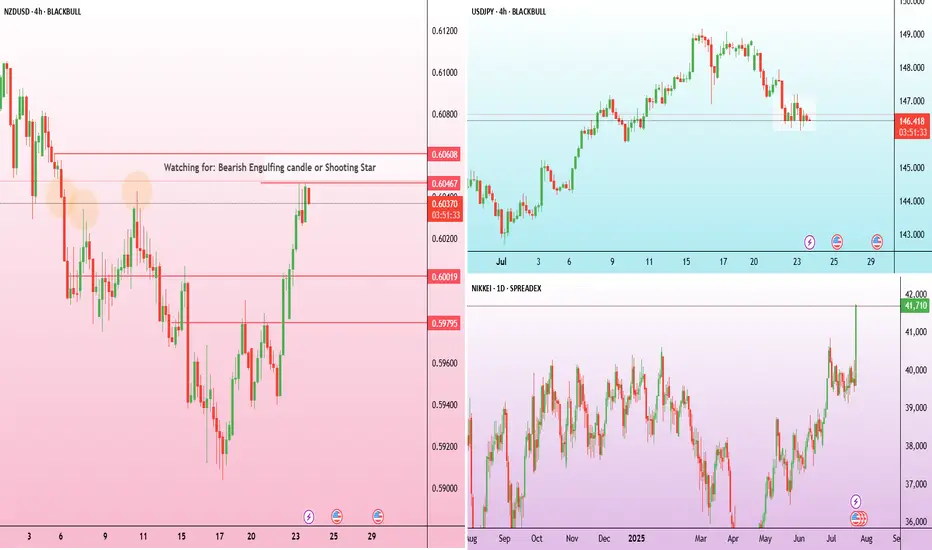
Kiwi climbs on risk-on flow – chart says more to come? The New Zealand dollar strengthened to around 0.6045, its highest level in over a week, supported by improved global risk sentiment following a breakthrough U.S.–Japan trade agreement.
The agreement, which lowers tariffs and boosts bilateral investment, triggered a surge in Japanese markets. Japan’s Nikkei 225 index jumped more than 3%, hitting a one-year high.
The breakout in NZDUSD was accompanied by a series of bullish candles with little to no upper wicks, evidence of minimal rejection from sellers. The most recent candles are consolidating just below the 0.6055 zone, which aligns with minor resistance from July 4.
Rejection from this area—especially if it prints a bearish engulfing or shooting star pattern—could signal a short-term pullback. On the downside, immediate support is now at 0.6000. If broken, the next support potentially lies around 0.5980, which was the last major swing low before the breakout.
NZD-JPY Resistance Ahead! Sell!
Hello,Traders!
NZD-JPY is trading in an
Uptrend but the pair is locally
Overbought so after the pair
Hits the horizontal resistance
Level of 88.900 we will be
Expecting a local bearish
Move down
Sell!
Comment and subscribe to help us grow!
Check out other forecasts below too!
Disclosure: I am part of Trade Nation's Influencer program and receive a monthly fee for using their TradingView charts in my analysis.

