GBP/NZD - Triangle Breakout (05.06.2025)The GBP/NZD Pair on the M30 timeframe presents a Potential Selling Opportunity due to a recent Formation of a Triangle Breakout Pattern. This suggests a shift in momentum towards the downside in the coming hours.
Possible Short Trade:
Entry: Consider Entering A Short Position around Trendline Of The Pattern.
Target Levels:
1st Support – 2.2345
2nd Support – 2.2285
🎁 Please hit the like button and
🎁 Leave a comment to support for My Post !
Your likes and comments are incredibly motivating and will encourage me to share more analysis with you.
Best Regards, KABHI_TA_TRADING
Thank you.
Disclosure: I am part of Trade Nation's Influencer program and receive a monthly fee for using their TradingView charts in my analysis.
NZD (New Zealand Dollar)

NZDCAD Selling Trading IdeaHello Traders
In This Chart nzdcad HOURLY Forex Forecast By FOREX PLANET
today NZDCAD analysis 👆
🟢This Chart includes_ (NZDCAD market update)
🟢What is The Next Opportunity on NZDCAD Market
🟢how to Enter to the Valid Entry With Assurance Profit
This CHART is For Trader's that Want to Improve Their Technical Analysis Skills and Their Trading By Understanding How To Analyze The Market Using Multiple Timeframes and Understanding The Bigger Picture on the Charts

NZDJPY: Short Trading Opportunity
NZDJPY
- Classic bearish pattern
- Our team expects retracement
SUGGESTED TRADE:
Swing Trade
Sell NZDJPY
Entry - 86.342
Stop - 86.782
Take - 85.565
Our Risk - 1%
Start protection of your profits from lower levels
Disclosure: I am part of Trade Nation's Influencer program and receive a monthly fee for using their TradingView charts in my analysis.
❤️ Please, support our work with like & comment! ❤️

NZDUSD to find buyers around trend line support?NZDUSD - 24h expiry
Price action looks to be forming a bottom.
The primary trend remains bullish.
This is positive for sentiment and the uptrend has potential to return.
We look for a temporary move lower.
Further upside is expected although we prefer to buy into dips close to the 0.5975 level.
We look to Buy at 0.5975 (stop at 0.5940)
Our profit targets will be 0.6074 and 0.6220
Resistance: 0.6006 / 0.6080 / 0.6220
Support: 0.5955 / 0.5850 / 0.5775
Risk Disclaimer
The trade ideas beyond this page are for informational purposes only and do not constitute investment advice or a solicitation to trade. This information is provided by Signal Centre, a third-party unaffiliated with OANDA, and is intended for general circulation only. OANDA does not guarantee the accuracy of this information and assumes no responsibilities for the information provided by the third party. The information does not take into account the specific investment objectives, financial situation, or particular needs of any particular person. You should take into account your specific investment objectives, financial situation, and particular needs before making a commitment to trade, including seeking advice from an independent financial adviser regarding the suitability of the investment, under a separate engagement, as you deem fit.
You accept that you assume all risks in independently viewing the contents and selecting a chosen strategy.
Where the research is distributed in Singapore to a person who is not an Accredited Investor, Expert Investor or an Institutional Investor, Oanda Asia Pacific Pte Ltd (“OAP“) accepts legal responsibility for the contents of the report to such persons only to the extent required by law. Singapore customers should contact OAP at 6579 8289 for matters arising from, or in connection with, the information/research distributed.

Potential bearish drop?NZD/USD is reacting off the resistance level which is a pullback resistance and could drop from this level to our take profit.
Entry: 0.6011
Why we like it:
There is a pullback resistance level.
Stop loss: 0.6051
Why we like it:
There is a pullback resistance level.
Take profit: 0.5950
Why we like it:
There is a pullback support level.
Enjoying your TradingView experience? Review us!
Please be advised that the information presented on TradingView is provided to Vantage (‘Vantage Global Limited’, ‘we’) by a third-party provider (‘Everest Fortune Group’). Please be reminded that you are solely responsible for the trading decisions on your account. There is a very high degree of risk involved in trading. Any information and/or content is intended entirely for research, educational and informational purposes only and does not constitute investment or consultation advice or investment strategy. The information is not tailored to the investment needs of any specific person and therefore does not involve a consideration of any of the investment objectives, financial situation or needs of any viewer that may receive it. Kindly also note that past performance is not a reliable indicator of future results. Actual results may differ materially from those anticipated in forward-looking or past performance statements. We assume no liability as to the accuracy or completeness of any of the information and/or content provided herein and the Company cannot be held responsible for any omission, mistake nor for any loss or damage including without limitation to any loss of profit which may arise from reliance on any information supplied by Everest Fortune Group.

GBPNZD is in Selling DirectionHello Traders
In This Chart GBPNZD 4 HOURLY Forex Forecast By FOREX PLANET
today GBPNZD analysis 👆
🟢This Chart includes GBPNZD market update)
🟢What is The Next Opportunity on GBPNZD Market
🟢how to Enter to the Valid Entry With Assurance Profit
This CHART is For Trader's that Want to Improve Their Technical Analysis Skills and Their Trading By Understanding How To Analyze The Market Using Multiple Timeframes and Understanding The Bigger Picture on the Charts

NZDCAD - Lucrative Range!Hello TradingView Family / Fellow Traders. This is Richard, also known as theSignalyst.
📈NZDCAD has been hovering within a range between the red support and blue resistance.
This week, NZDCAD has been bearish and approaching the red support.
Moreover, it is retesting the lower bound of its rising wedge pattern in blue.
🏹 Thus, the highlighted blue circle is a strong area to look for buy setups as it is the intersection of support and lower blue trendline acting as a non-horizontal support.
📚 As per my trading style:
As #NZDCAD approaches the blue circle zone, I will be looking for bullish reversal setups (like a double bottom pattern, trendline break , and so on...)
📚 Always follow your trading plan regarding entry, risk management, and trade management.
Good luck!
All Strategies Are Good; If Managed Properly!
~Rich
Disclosure: I am part of Trade Nation's Influencer program and receive a monthly fee for using their TradingView charts in my analysis.

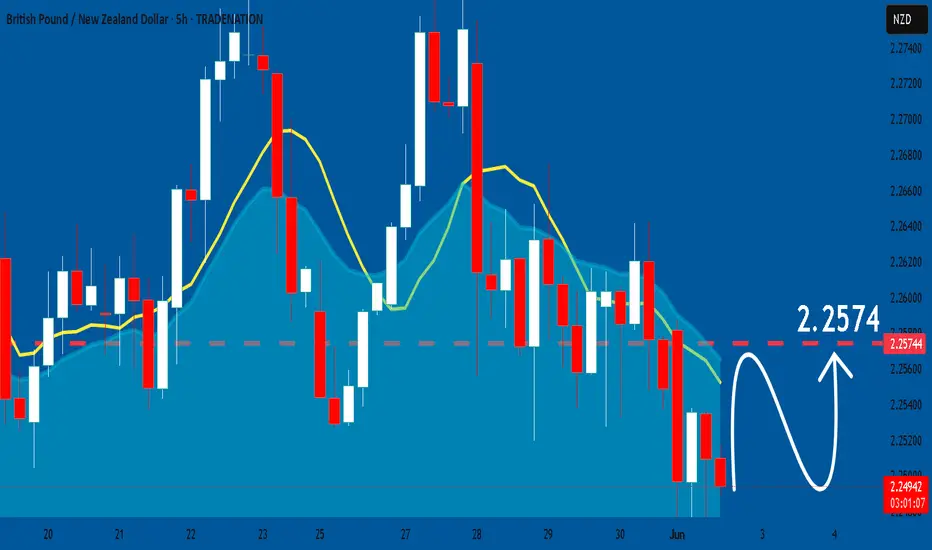
"GBP/NZD: The Perfect Long Trade (Risk-Managed Heist Plan)"🏦💰 GBP/NZD BANK HEIST: The Ultimate Sterling vs. Kiwi Money Grab! 💰🏦
🌟 Hi! Hola! Ola! Bonjour! Hallo! Marhaba! 🌟
Attention all Money Makers & Market Robbers! 🤑💸✈️
Based on the 🔥Thief Trading Style🔥 (technical + fundamental analysis), here’s our master plan to loot the GBP/NZD "Sterling vs Kiwi" Forex Bank Heist!
📜 THE HEIST BLUEPRINT:
✅ Entry Strategy (Long Only!) 📈
"The heist is ON! Wait for the breakout above the previous high (2.25500) – then strike! Bullish profits await!"
Option 1: Place Buy Stop orders above the Moving Average.
Option 2: Use Buy Limit orders near recent swing lows (15-30 min timeframe) for pullback entries.
📌 Pro Tip: Set an ALERT for the breakout entry—don’t miss the robbery window!
🛑 Stop Loss (Listen Up!)
"Yo, thieves! 🗣️ If you’re entering on a Buy Stop, DO NOT set your SL until after the breakout! 🚀 Place it where I say (or wherever you dare 😈), but remember—your risk, your rules! ⚠️🔥"
📍 Thief SL Placement: Nearest swing low (1H timeframe) – 2.23700 (adjust based on risk & lot size).
🎯 Profit Target: 2.28700 (Time to escape with the loot!)
⚡ Scalpers’ Note: Only scalp LONG! Big wallets? Go all in. Small wallets? Ride the swing. Use trailing SL to protect your stolen cash! 💰
📰 WHY THIS HEIST? (Fundamental Edge)
GBP/NZD is showing bullish momentum due to:
Macroeconomic factors
COT Report insights
Sentiment shifts & intermarket trends
🔗 Full analysis? Check our bio0 for the deep dive!
⚠️ Trading Alert: News = Danger Zone! 📰🚫
Avoid new trades during high-impact news.
Use trailing stops to lock in profits & dodge volatility traps.
💥 BOOST THE HEIST!
💖 Support the robbery crew—SMASH THAT LIKE BUTTON! 💖
🚀 More heists coming soon—stay tuned, thieves! 🏆🤝🎉

NZDCHF Will Go Lower! Short!
Here is our detailed technical review for NZDCHF.
Time Frame: 10h
Current Trend: Bearish
Sentiment: Overbought (based on 7-period RSI)
Forecast: Bearish
The market is trading around a solid horizontal structure 0.492.
The above observations make me that the market will inevitably achieve 0.488 level.
P.S
Please, note that an oversold/overbought condition can last for a long time, and therefore being oversold/overbought doesn't mean a price rally will come soon, or at all.
Disclosure: I am part of Trade Nation's Influencer program and receive a monthly fee for using their TradingView charts in my analysis.
Like and subscribe and comment my ideas if you enjoy them!

Waiting for a Short-Term Pullback Before the Next Bullish Leg? NZDUSD – Waiting for a Short-Term Pullback Before the Next Bullish Leg?
As global markets await the upcoming U.S. Non-Farm Payrolls (NFP) report later this week, NZDUSD is showing early signs of short-term weakness following a strong bullish rally from the 0.5905 low. While the broader structure remains bullish, a corrective move may be necessary to shake out weak hands and reload liquidity before a renewed surge.
🌐 Macro & Fundamental Outlook:
New Zealand: Recent economic releases from New Zealand have been lackluster, yet the RBNZ's hawkish policy stance (high interest rates) continues to support the Kiwi. However, pressure from China – New Zealand’s top trading partner – remains a drag.
United States: The U.S. Dollar remains under pressure due to rising expectations that the Fed will start cutting rates by Q3 2025, despite some hawkish tones from FOMC officials. This week’s NFP report will be a decisive factor.
Market Sentiment: After a ~150-pip rally, traders are beginning to take profits. The correction could offer a golden re-entry opportunity.
📊 Technical Analysis:
Trend Bias: The market structure is still in an uptrend, maintaining Higher Highs and Higher Lows.
Fibonacci Retracement: Price is currently pulling back toward the 0.5 – 0.618 Fibo zone (0.5992 – 0.5978), aligning with the H1 89 & 200 EMAs.
EMA Structure (13 – 34 – 89 – 200): Still bullish but currently signaling a short-term pullback.
🔑 Key Price Zones:
Resistance Levels: 0.6014 – 0.6052
Support Levels: 0.5973 – 0.5951 – 0.5932
🧭 Trade Plan
📌 Buy Setup (trend continuation):
BUY ZONE: 0.5951 – 0.5932
SL: 0.5900
TP: 0.5978 → 0.6014 → 0.6052
📌 Expecting a bullish bounce off the 61.8% Fibo + EMA 200 confluence ahead of NFP.
📌 Sell Setup (short-term countertrend scalp):
SELL ZONE: 0.6014 – 0.6025
SL: 0.6060
TP: 0.5978 → 0.5951
📌 Anticipating a reaction at a key resistance zone – ideal for intraday scalpers.
⚠️ Risk Management Notes:
Stay cautious ahead of high-impact U.S. data (ADP, Jobless Claims, NFP).
Favor buying the dip in line with the higher-timeframe trend.
Maintain discipline with tight SLs (30–35 pips max per setup).

NZDJPY to find sellers at previous resistance?NZDJPY - 24h expiry
Trading has been mixed and volatile. Price action looks to be forming a top. We look for a temporary move higher. Preferred trade is to sell into rallies. Bespoke resistance is located at 86.50.
We look to Sell at 86.50 (stop at 86.75)
Our profit targets will be 85.50 and 85.25
Resistance: 86.30 / 86.70 / 87.00
Support: 85.50 / 85.20 / 84.80
Risk Disclaimer
The trade ideas beyond this page are for informational purposes only and do not constitute investment advice or a solicitation to trade. This information is provided by Signal Centre, a third-party unaffiliated with OANDA, and is intended for general circulation only. OANDA does not guarantee the accuracy of this information and assumes no responsibilities for the information provided by the third party. The information does not take into account the specific investment objectives, financial situation, or particular needs of any particular person. You should take into account your specific investment objectives, financial situation, and particular needs before making a commitment to trade, including seeking advice from an independent financial adviser regarding the suitability of the investment, under a separate engagement, as you deem fit.
You accept that you assume all risks in independently viewing the contents and selecting a chosen strategy.
Where the research is distributed in Singapore to a person who is not an Accredited Investor, Expert Investor or an Institutional Investor, Oanda Asia Pacific Pte Ltd (“OAP“) accepts legal responsibility for the contents of the report to such persons only to the extent required by law. Singapore customers should contact OAP at 6579 8289 for matters arising from, or in connection with, the information/research distributed.

NZDUSD Potential UpsidesHey Traders, in today's trading we are monitoring NZDUSD for a buying opportunity around 0.59400 zone, NZDUSD is trading in an uptrend and currently is in a correction phase in which it is approaching the trend at 0.59400 support and resistance area.
Trade safe, Joe.

gbpnzd buy signal. Don't forget about stop-loss.
Write in the comments all your questions and instruments analysis of which you want to see.
Friends, push the like button, write a comment, and share with your mates - that would be the best THANK YOU.
P.S. I personally will open entry if the price will show it according to my strategy.
Always make your analysis before a trade

GBP_NZD BEARISH BREAKOUT|SHORT|
✅GBP_NZD made a bearish
Breakout of the key horizontal
Level around 2.2540 and the
Breakout is confirmed so after
A potential pullback we will
Be expecting a further
Bearish move down
SHORT🔥
✅Like and subscribe to never miss a new idea!✅
Disclosure: I am part of Trade Nation's Influencer program and receive a monthly fee for using their TradingView charts in my analysis.

NZD_CAD RISKY SHORT|
✅NZD_CAD went up to retest
A horizontal resistance of 0.8276
Which makes me locally bearish biased
And I think that we will see a pullback
And a move down from the level
Towards the target below at 0.8251
SHORT🔥
✅Like and subscribe to never miss a new idea!✅
Disclosure: I am part of Trade Nation's Influencer program and receive a monthly fee for using their TradingView charts in my analysis.

GBPNZD: Market of Buyers
The charts are full of distraction, disturbance and are a graveyard of fear and greed which shall not cloud our judgement on the current state of affairs in the GBPNZD pair price action which suggests a high likelihood of a coming move up.
Disclosure: I am part of Trade Nation's Influencer program and receive a monthly fee for using their TradingView charts in my analysis.
❤️ Please, support our work with like & comment! ❤️
GBPNZD TANK BEFORE THE SURGEGBPNZD is expected to fall o the daily dynamic support before the surgeto break the next high.
the pair keeps tanking from a a dailt TF quasimodo LEVEL
Bullish bounce?NZD/USD is has bounced off the support level which is a pullback support and could rise from this level to our take profit.
Entry: 0.5931
Why we like it:
There is a pullback support level.
Stop loss: 0.5898
Why we like it:
There is a pullback support level.
Take profit: 0.6017
Why we like it:
There is a pullback resistance level.
Enjoying your TradingView experience? Review us!
Please be advised that the information presented on TradingView is provided to Vantage (‘Vantage Global Limited’, ‘we’) by a third-party provider (‘Everest Fortune Group’). Please be reminded that you are solely responsible for the trading decisions on your account. There is a very high degree of risk involved in trading. Any information and/or content is intended entirely for research, educational and informational purposes only and does not constitute investment or consultation advice or investment strategy. The information is not tailored to the investment needs of any specific person and therefore does not involve a consideration of any of the investment objectives, financial situation or needs of any viewer that may receive it. Kindly also note that past performance is not a reliable indicator of future results. Actual results may differ materially from those anticipated in forward-looking or past performance statements. We assume no liability as to the accuracy or completeness of any of the information and/or content provided herein and the Company cannot be held responsible for any omission, mistake nor for any loss or damage including without limitation to any loss of profit which may arise from reliance on any information supplied by Everest Fortune Group.

GBPNZD Pushing itself in a buy directionHello Traders
In This Chart GBPNZD 4 HOURLY Forex Forecast By FOREX PLANET
today GBPNZD analysis 👆
🟢This Chart includes GBPNZD market update)
🟢What is The Next Opportunity on EURNZD Market
🟢how to Enter to the Valid Entry With Assurance Profit
This CHART is For Trader's that Want to Improve Their Technical Analysis Skills and Their Trading By Understanding How To Analyze The Market Using Multiple Timeframes and Understanding The Bigger Picture on the Charts

GBP-NZD Local Long! Buy!
Hello,Traders!
GBP-NZD will soon hit a
Horizontal support level
Of 2.0518 and as we have
Seem multiple rebounds
From the level we can
Bet on a one more rebound
And go long from the level
On Monday
Buy!
Comment and subscribe to help us grow!
Check out other forecasts below too!
Disclosure: I am part of Trade Nation's Influencer program and receive a monthly fee for using their TradingView charts in my analysis.

NZDUSD: weekly overviewTraders, this is weekly view of the pair.
Our long-term TP is the 0.6300 but for now we have a strong trendline on our way! the only tradable zone for this week is 0.58497.
In case of bullish trades, from 0.60264 level. Please consider the trend line as mid-way TPS.
*******************************************************************
The indicated levels are determined based on the most reaction points and the assumption of approximately equal distance between the zones.
Some of these points can also be confirmed by the mathematical intervals of Murray.
You can enter with/without confirmation. IF you want to take confirmation you can use LTF analysis, Spike move confirmation, Trend Strength confirmation and ETC.
SL could be placed below the zone or regarding the LTF swings.
TP is the next zone or the nearest moving S&R, which are median and borders of the drawn channels.
*******************************************************************
Role of different zones:
GREEN: Just long trades allowed on them.
RED: Just Short trades allowed on them.
BLUE: both long and short trades allowed on them.
WHITE: No trades allowed on them! just use them as TP points

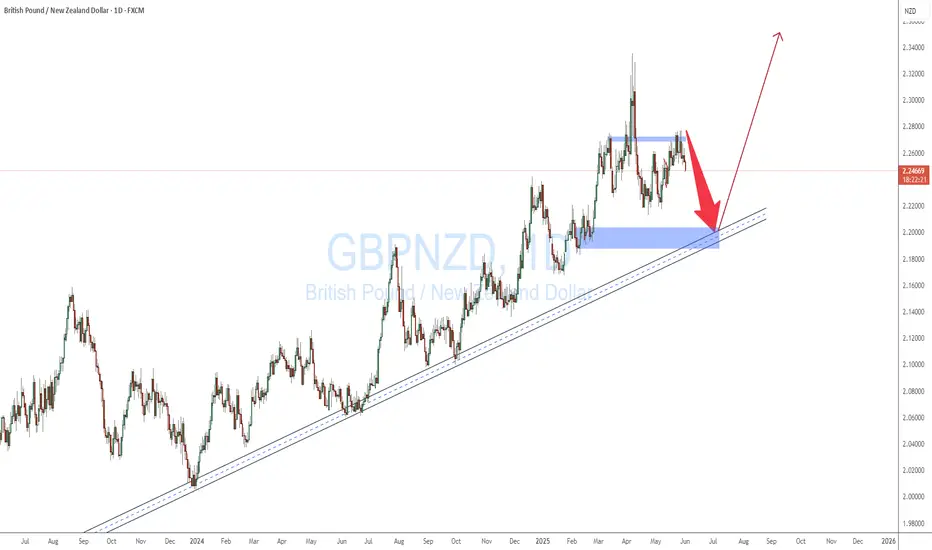
GBP/NZD SHORT FROM RESISTANCE
Hello, Friends!
The BB upper band is nearby so GBP-NZD is in the overbought territory. Thus, despite the uptrend on the 1W timeframe I think that we will see a bearish reaction from the resistance line above and a move down towards the target at around 2.218.
Disclosure: I am part of Trade Nation's Influencer program and receive a monthly fee for using their TradingView charts in my analysis.
✅LIKE AND COMMENT MY IDEAS✅

NZDJPY A Fall Expected! SELL!
My dear friends,
Please, find my technical outlook for NZDJPY below:
The price is coiling around a solid key level - 86.642
Bias - Bearish
Technical Indicators: Pivot Points Low anticipates a potential price reversal.
Super trend shows a clear sell, giving a perfect indicators' convergence.
Goal - 85.925
Safe Stop Loss - 87.013
About Used Indicators:
The pivot point itself is simply the average of the high, low and closing prices from the previous trading day.
Disclosure: I am part of Trade Nation's Influencer program and receive a monthly fee for using their TradingView charts in my analysis.
———————————
WISH YOU ALL LUCK
