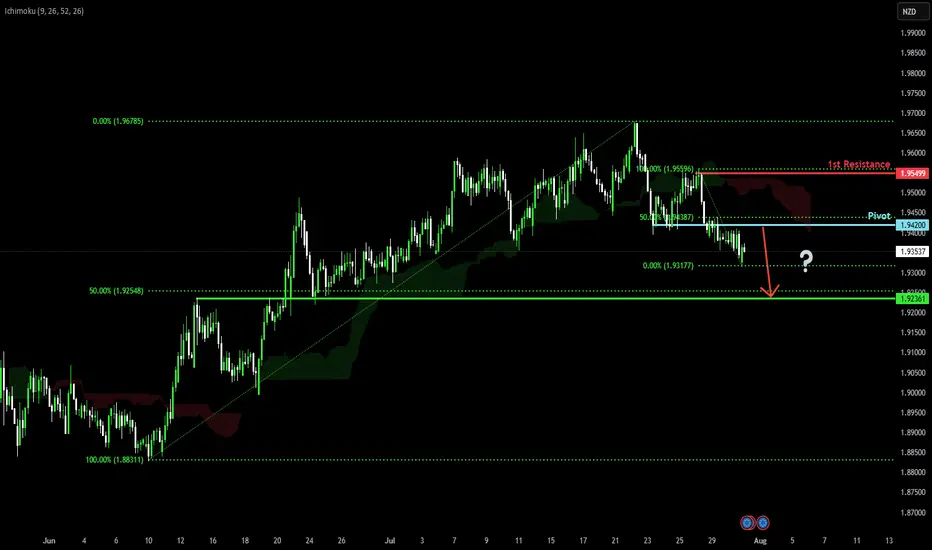
Potential bearish drop?EUR/NZD has rejected off the pivot and could drop to the overlap support.
Pivot: 1.94200
1st Support: 1.92361
1st Resistance: 1.95499
Risk Warning:
Trading Forex and CFDs carries a high level of risk to your capital and you should only trade with money you can afford to lose. Trading Forex and CFDs may not be suitable for all investors, so please ensure that you fully understand the risks involved and seek independent advice if necessary.
Disclaimer:
The above opinions given constitute general market commentary, and do not constitute the opinion or advice of IC Markets or any form of personal or investment advice.
Any opinions, news, research, analyses, prices, other information, or links to third-party sites contained on this website are provided on an "as-is" basis, are intended only to be informative, is not an advice nor a recommendation, nor research, or a record of our trading prices, or an offer of, or solicitation for a transaction in any financial instrument and thus should not be treated as such. The information provided does not involve any specific investment objectives, financial situation and needs of any specific person who may receive it. Please be aware, that past performance is not a reliable indicator of future performance and/or results. Past Performance or Forward-looking scenarios based upon the reasonable beliefs of the third-party provider are not a guarantee of future performance. Actual results may differ materially from those anticipated in forward-looking or past performance statements. IC Markets makes no representation or warranty and assumes no liability as to the accuracy or completeness of the information provided, nor any loss arising from any investment based on a recommendation, forecast or any information supplied by any third-party.
NZD (New Zealand Dollar)
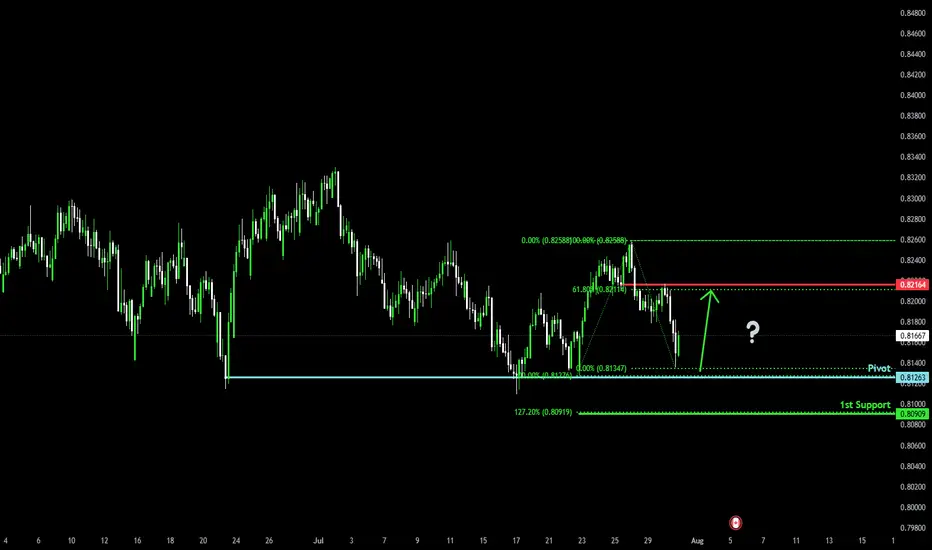
Bullish reversal?NZD/CAD is falling towards the pivot an could bounce to the 1st resistance.
Pivot: 0.81263
1st Support: 0.80909
1st Resistance: 0.82164
Risk Warning:
Trading Forex and CFDs carries a high level of risk to your capital and you should only trade with money you can afford to lose. Trading Forex and CFDs may not be suitable for all investors, so please ensure that you fully understand the risks involved and seek independent advice if necessary.
Disclaimer:
The above opinions given constitute general market commentary, and do not constitute the opinion or advice of IC Markets or any form of personal or investment advice.
Any opinions, news, research, analyses, prices, other information, or links to third-party sites contained on this website are provided on an "as-is" basis, are intended only to be informative, is not an advice nor a recommendation, nor research, or a record of our trading prices, or an offer of, or solicitation for a transaction in any financial instrument and thus should not be treated as such. The information provided does not involve any specific investment objectives, financial situation and needs of any specific person who may receive it. Please be aware, that past performance is not a reliable indicator of future performance and/or results. Past Performance or Forward-looking scenarios based upon the reasonable beliefs of the third-party provider are not a guarantee of future performance. Actual results may differ materially from those anticipated in forward-looking or past performance statements. IC Markets makes no representation or warranty and assumes no liability as to the accuracy or completeness of the information provided, nor any loss arising from any investment based on a recommendation, forecast or any information supplied by any third-party.
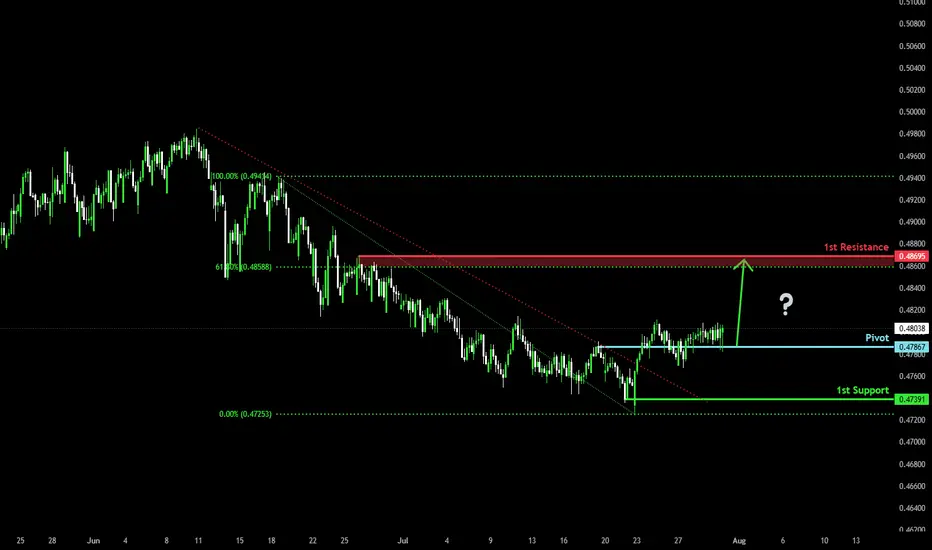
Bullish bounce?NZD/CHF is reacting off the pivot, which is a pullback support and could rise to the 1st resistance.
Pivot: 0.47867
1st Support: 0.47391
1st Resistance: 0.48695
Risk Warning:
Trading Forex and CFDs carries a high level of risk to your capital and you should only trade with money you can afford to lose. Trading Forex and CFDs may not be suitable for all investors, so please ensure that you fully understand the risks involved and seek independent advice if necessary.
Disclaimer:
The above opinions given constitute general market commentary, and do not constitute the opinion or advice of IC Markets or any form of personal or investment advice.
Any opinions, news, research, analyses, prices, other information, or links to third-party sites contained on this website are provided on an "as-is" basis, are intended only to be informative, is not an advice nor a recommendation, nor research, or a record of our trading prices, or an offer of, or solicitation for a transaction in any financial instrument and thus should not be treated as such. The information provided does not involve any specific investment objectives, financial situation and needs of any specific person who may receive it. Please be aware, that past performance is not a reliable indicator of future performance and/or results. Past Performance or Forward-looking scenarios based upon the reasonable beliefs of the third-party provider are not a guarantee of future performance. Actual results may differ materially from those anticipated in forward-looking or past performance statements. IC Markets makes no representation or warranty and assumes no liability as to the accuracy or completeness of the information provided, nor any loss arising from any investment based on a recommendation, forecast or any information supplied by any third-party.
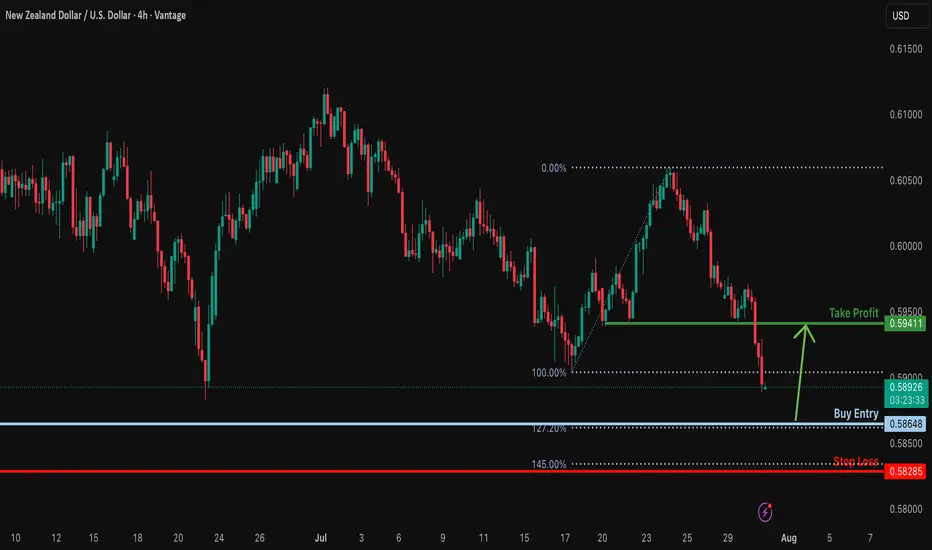
Bullish reversal?NZD/USD is falling towards the support level, which is a swing low support that lines up with the 127.2% Fibonacci extension. Could NZD/USD bounce from this level to our take profit?
Entry: 0.5864
Why we like it:
There is a swing low support that lines up with the 127.2% Fibonacci extension.
Stop loss: 0.5828
Why we like it:
There is a pullback support that lines up with the 145% Fibonacci extension.
Takeprofit: 0.5941
Why we like it:
There is a pullback resistance level.
Enjoying your TradingView experience? Review us!
Please be advised that the information presented on TradingView is provided to Vantage (‘Vantage Global Limited’, ‘we’) by a third-party provider (‘Everest Fortune Group’). Please be reminded that you are solely responsible for the trading decisions on your account. There is a very high degree of risk involved in trading. Any information and/or content is intended entirely for research, educational and informational purposes only and does not constitute investment or consultation advice or investment strategy. The information is not tailored to the investment needs of any specific person and therefore does not involve a consideration of any of the investment objectives, financial situation or needs of any viewer that may receive it. Kindly also note that past performance is not a reliable indicator of future results. Actual results may differ materially from those anticipated in forward-looking or past performance statements. We assume no liability as to the accuracy or completeness of any of the information and/or content provided herein and the Company cannot be held responsible for any omission, mistake nor for any loss or damage including without limitation to any loss of profit which may arise from reliance on any information supplied by Everest Fortune Group.
NZDCAD; Heikin Ashi Trade IdeaIn this video, I’ll be sharing my analysis of NZDCAD, using FXAN's proprietary algo indicators with my unique Heikin Ashi strategy. I’ll walk you through the reasoning behind my trade setup and highlight key areas where I’m anticipating potential opportunities.
I’m always happy to receive any feedback.
Like, share and comment! ❤️
Thank you for watching my videos! 🙏

NZDCAD: Bullish Continuation is Expected! Here is Why:
The analysis of the NZDCAD chart clearly shows us that the pair is finally about to go up due to the rising pressure from the buyers.
Disclosure: I am part of Trade Nation's Influencer program and receive a monthly fee for using their TradingView charts in my analysis.
❤️ Please, support our work with like & comment! ❤️

NZDUSD Potential UpsidesHey Traders, in today's trading session we are monitoring NZDUSD for a buying opportunity around 0.59200 zone, NZDUSD is trading in an uptrend and currently is in a correction phase in which it is approaching the trend at 0.59200 support and resistance area.
Trade safe, Joe.

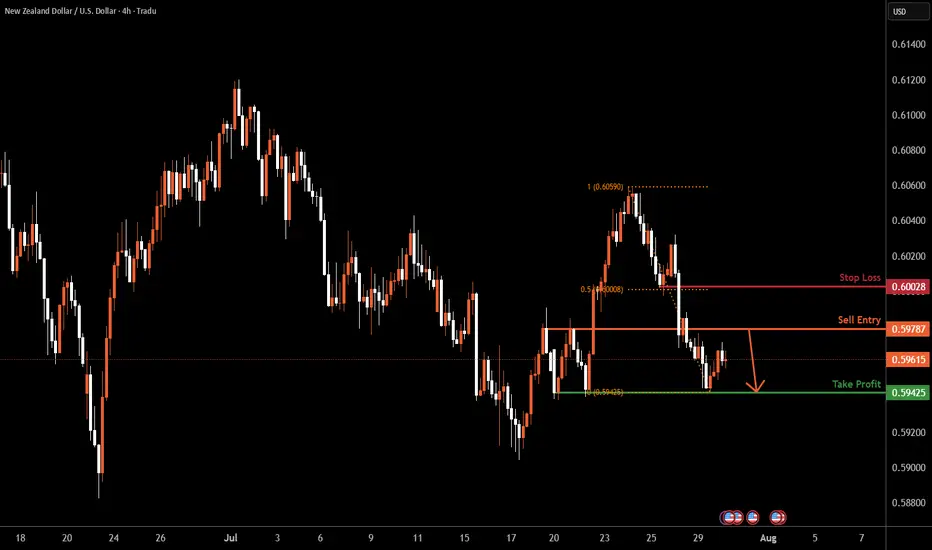
NZDUSD H4 | Bearish dropKiwi (NZD/USD) is rising towards the sell entry, which is a pullback resistance and could reverse from this level and drop lower.
Sell entry is at 0.5978, which is a pullback resistance.
Stop loss is at 0.6002, which is a pullback resistance that lines up with the 50% Fibonacci retracement.
Take profit is at 0.5942, which is a multi-swing low support.
High Risk Investment Warning
Trading Forex/CFDs on margin carries a high level of risk and may not be suitable for all investors. Leverage can work against you.
Stratos Markets Limited (tradu.com ):
CFDs are complex instruments and come with a high risk of losing money rapidly due to leverage. 65% of retail investor accounts lose money when trading CFDs with this provider. You should consider whether you understand how CFDs work and whether you can afford to take the high risk of losing your money.
Stratos Europe Ltd (tradu.com ):
CFDs are complex instruments and come with a high risk of losing money rapidly due to leverage. 66% of retail investor accounts lose money when trading CFDs with this provider. You should consider whether you understand how CFDs work and whether you can afford to take the high risk of losing your money.
Stratos Global LLC (tradu.com ):
Losses can exceed deposits.
Please be advised that the information presented on TradingView is provided to Tradu (‘Company’, ‘we’) by a third-party provider (‘TFA Global Pte Ltd’). Please be reminded that you are solely responsible for the trading decisions on your account. There is a very high degree of risk involved in trading. Any information and/or content is intended entirely for research, educational and informational purposes only and does not constitute investment or consultation advice or investment strategy. The information is not tailored to the investment needs of any specific person and therefore does not involve a consideration of any of the investment objectives, financial situation or needs of any viewer that may receive it. Kindly also note that past performance is not a reliable indicator of future results. Actual results may differ materially from those anticipated in forward-looking or past performance statements. We assume no liability as to the accuracy or completeness of any of the information and/or content provided herein and the Company cannot be held responsible for any omission, mistake nor for any loss or damage including without limitation to any loss of profit which may arise from reliance on any information supplied by TFA Global Pte Ltd.
The speaker(s) is neither an employee, agent nor representative of Tradu and is therefore acting independently. The opinions given are their own, constitute general market commentary, and do not constitute the opinion or advice of Tradu or any form of personal or investment advice. Tradu neither endorses nor guarantees offerings of third-party speakers, nor is Tradu responsible for the content, veracity or opinions of third-party speakers, presenters or participants.
Heading into 50% Fibonacci resistance?The Kiwi (NZD/USD) is rising towards the pivot, which is an overlap resistance that lines up with the 50% Fibonacci retracement and could reverse to the 1st support.
Pivot: 0.5999
1st Support: 0.5941
1st Resistance: 0.6030
Risk Warning:
Trading Forex and CFDs carries a high level of risk to your capital and you should only trade with money you can afford to lose. Trading Forex and CFDs may not be suitable for all investors, so please ensure that you fully understand the risks involved and seek independent advice if necessary.
Disclaimer:
The above opinions given constitute general market commentary, and do not constitute the opinion or advice of IC Markets or any form of personal or investment advice.
Any opinions, news, research, analyses, prices, other information, or links to third-party sites contained on this website are provided on an "as-is" basis, are intended only to be informative, is not an advice nor a recommendation, nor research, or a record of our trading prices, or an offer of, or solicitation for a transaction in any financial instrument and thus should not be treated as such. The information provided does not involve any specific investment objectives, financial situation and needs of any specific person who may receive it. Please be aware, that past performance is not a reliable indicator of future performance and/or results. Past Performance or Forward-looking scenarios based upon the reasonable beliefs of the third-party provider are not a guarantee of future performance. Actual results may differ materially from those anticipated in forward-looking or past performance statements. IC Markets makes no representation or warranty and assumes no liability as to the accuracy or completeness of the information provided, nor any loss arising from any investment based on a recommendation, forecast or any information supplied by any third-party.

NZDUSD to form a higher low?NZDUSD - 24h expiry
Pivot support is at 0.5935.
We expect a reversal in this move.
Risk/Reward would be poor to call a buy from current levels.
A move through 0.5975 will confirm the bullish momentum.
The measured move target is 0.6000.
We look to Buy at 0.5935 (stop at 0.5910)
Our profit targets will be 0.5985 and 0.6000
Resistance: 0.5975 / 0.5985 / 0.6000
Support: 0.5935 / 0.5925 / 0.5910
Risk Disclaimer
The trade ideas beyond this page are for informational purposes only and do not constitute investment advice or a solicitation to trade. This information is provided by Signal Centre, a third-party unaffiliated with OANDA, and is intended for general circulation only. OANDA does not guarantee the accuracy of this information and assumes no responsibilities for the information provided by the third party. The information does not take into account the specific investment objectives, financial situation, or particular needs of any particular person. You should take into account your specific investment objectives, financial situation, and particular needs before making a commitment to trade, including seeking, under a separate engagement, as you deem fit.
You accept that you assume all risks in independently viewing the contents and selecting a chosen strategy.
Where the research is distributed in Singapore to a person who is not an Accredited Investor, Expert Investor or an Institutional Investor, Oanda Asia Pacific Pte Ltd (“OAP“) accepts legal responsibility for the contents of the report to such persons only to the extent required by law. Singapore customers should contact OAP at 6579 8289 for matters arising from, or in connection with, the information/research distributed.

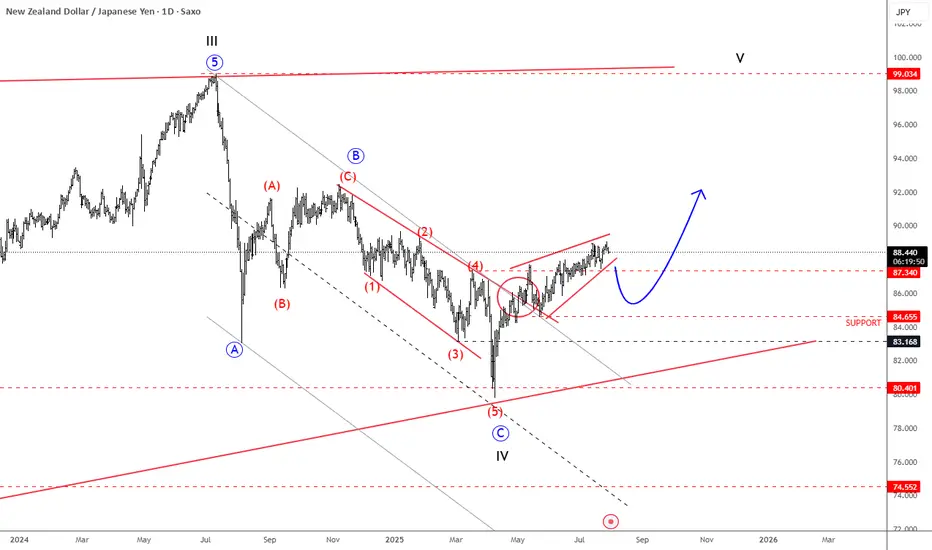
NZDJPY Is Back To Bullish ModeNZDJPY Is Back To Bullish Mode from technical and Elliott wave perspective, as we see it breaking back above trendline after a corrective decline.
NZDJPY is nicely recovering over the last few weeks after a strong rebound from 80.40 support, a key level going back to March 2023. Notice that it’s recovering after a three-wave ABC corrective decline that belongs to a higher degree wave IV correction. Current recovery looks to be in five waves, as a leading diagonal; so its a motive wave structure that already pushed above the 87.34 resistance, which is a strong bullish signal, suggesting more upside ahead. Of course, short-term pullbacks are always possible and welcome, and in that case, the 86 – 84 area could act as a nice support. But overall, we think that sooner or later the pair will target the 90 or even 92 levels, which are still possible this year. Wave V is eyeing even 100 area.
NZDCHF is in the Bearish Side due to Bearish TrendHello Traders
In This Chart NZDCHF HOURLY Forex Forecast By FOREX PLANET
today NZDCHF analysis 👆
🟢This Chart includes_ (NZDCHF market update)
🟢What is The Next Opportunity on NZDCHF Market
🟢how to Enter to the Valid Entry With Assurance Profit
This CHART is For Trader's that Want to Improve Their Technical Analysis Skills and Their Trading By Understanding How To Analyze The Market Using Multiple Timeframes and Understanding The Bigger Picture on the Chart

NZD/CHF SHORT FROM RESISTANCE
Hello, Friends!
NZD/CHF pair is trading in a local uptrend which we know by looking at the previous 1W candle which is green. On the 12H timeframe the pair is going up too. The pair is overbought because the price is close to the upper band of the BB indicator. So we are looking to sell the pair with the upper BB line acting as resistance. The next target is 0.473 area.
Disclosure: I am part of Trade Nation's Influencer program and receive a monthly fee for using their TradingView charts in my analysis.
✅LIKE AND COMMENT MY IDEAS✅

NZDCHF – Bullish Breakout Sets Stage for ReversalNZDCHF has broken decisively out of a long-term descending channel, signaling a potential trend reversal. Price action confirmed multiple bullish flags within the falling structure, followed by a clean breakout and higher low retest, supporting a bullish continuation bias.
Currently, the pair is stabilizing just above prior resistance turned support around 0.4760–0.4780, forming a potential launchpad for the next leg higher.
Upside Targets:
TP1: 0.48336
TP2: 0.48844
TP3: 0.49319
Invalidation Zone:
A drop below 0.4720 would invalidate the breakout structure and expose the downside.
Fundamental Drivers:
🇳🇿 NZD Strength: RBNZ remains relatively hawkish compared to other central banks, and the Kiwi may gain from improving risk sentiment and easing global recession fears.
🇨🇭 CHF Weakness: Swiss Franc is under mild pressure as safe-haven flows weaken amid improving tone on US-China-EU trade headlines and fading ECB rate cut bets.
🗓️ Macro Flow: Upcoming risk events (Fed comments, trade updates, and NZ economic prints) could inject momentum into the pair, especially if risk appetite improves.
Bias: ✅ Bullish (Buy)
Confidence: ★★★★☆
Watch for: Clean hold above 0.4770 zone + bullish momentum continuation.

NZDJPY: Free Trading Signal
NZDJPY
- Classic bullish pattern
- Our team expects retracement
SUGGESTED TRADE:
Swing Trade
Buy NZDJPY
Entry - 88.612
Stop - 88.524
Take - 88.757
Our Risk - 1%
Start protection of your profits from lower levels
Disclosure: I am part of Trade Nation's Influencer program and receive a monthly fee for using their TradingView charts in my analysis.
❤️ Please, support our work with like & comment! ❤️

NZD/CAD Setup Price broke below the consolidation channel, retested the support at 0.82330, and is expected to continue down toward the target at 0.81599. Bearish momentum is in play.

NZD/CAD BULLS ARE GAINING STRENGTH|LONG
NZD/CAD SIGNAL
Trade Direction: long
Entry Level: 0.820
Target Level: 0.824
Stop Loss: 0.817
RISK PROFILE
Risk level: medium
Suggested risk: 1%
Timeframe: 2h
Disclosure: I am part of Trade Nation's Influencer program and receive a monthly fee for using their TradingView charts in my analysis.
✅LIKE AND COMMENT MY IDEAS✅

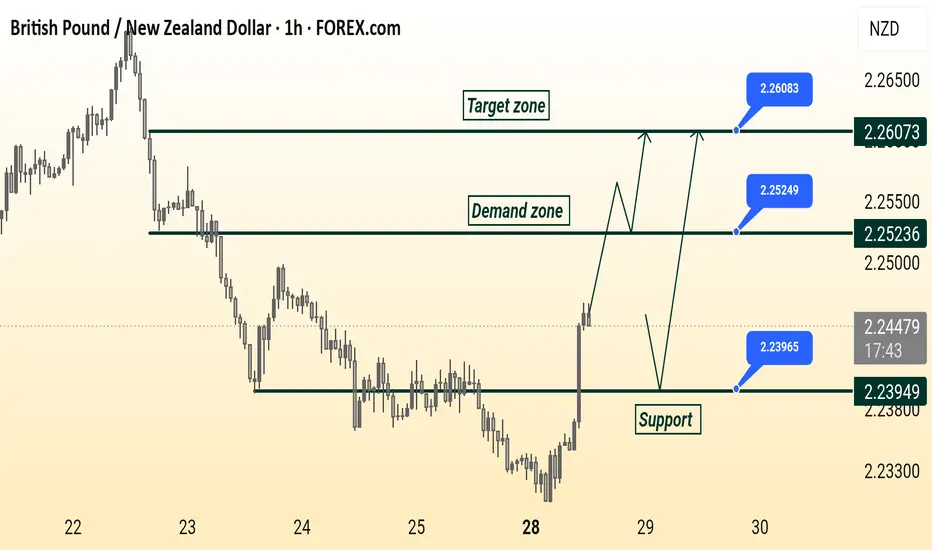
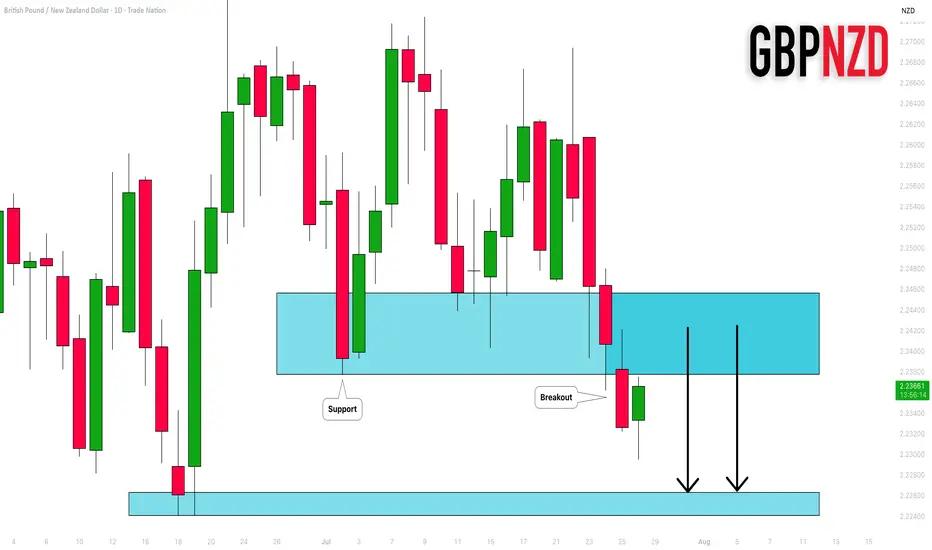
GBP/ NZD Ready Read The Captions This 1-hour chart analysis of GBP/NZD highlights key trading zones:
Support level: 2.23949
Demand zone: 2.25236
Target zone: 2.26073
The price is currently rising from support and approaching the demand zone. Two possible scenarios are shown: a breakout toward the target zone or a pullback to the support before a new upward attempt.
GBPNZD: Important Breakout 🇬🇧🇳🇿
GBPNZD broke and closed below a significant support cluster on a daily.
The broken structure turned into a strong resistance.
I will expect a bearish move from that.
Next support - 2.2264
❤️Please, support my work with like, thank you!❤️
I am part of Trade Nation's Influencer program and receive a monthly fee for using their TradingView charts in my analysis.
NZDCHF is in the Bearish Side due to Bearish TrendHello Traders
In This Chart NZDCHF HOURLY Forex Forecast By FOREX PLANET
today NZDCHF analysis 👆
🟢This Chart includes_ (NZDCHF market update)
🟢What is The Next Opportunity on NZDCHF Market
🟢how to Enter to the Valid Entry With Assurance Profit
This CHART is For Trader's that Want to Improve Their Technical Analysis Skills and Their Trading By Understanding How To Analyze The Market Using Multiple Timeframes and Understanding The Bigger Picture on the Chart

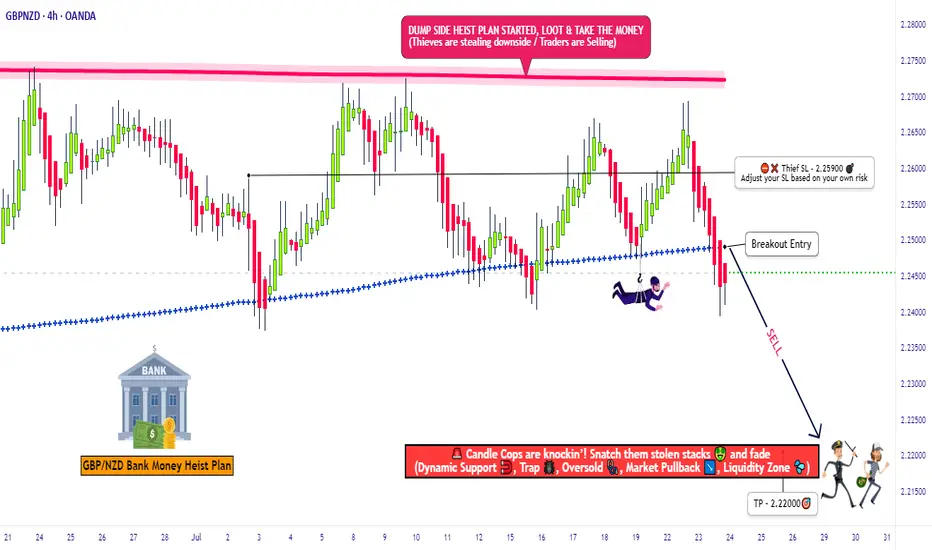
"GBP/NZD: Bearish Storm Brewing – Get Ready!🚨 GBP/NZD HEIST ALERT: "Pound vs Kiwi" Bearish Trap Setup! 🚨 (Scalping/Day Trade)
🌟 Attention, Market Robbers & Profit Pirates! 🌟
🔥 Thief Trading Strategy Activated – Time to short the GBP/NZD like a pro! This pair is setting up for a bearish heist, and we’re locking in entries before the drop. High-risk, high-reward? You bet.
🎯 TRADE PLAN (Bearish Ambush)
Entry Zone (Short) 📉:
Optimal: Sell limit orders on retests (15m/30m timeframe).
Thief’s Trick: Layer entries (DCA-style) near recent highs for max efficiency.
"Enter like a sniper, escape like a ghost." 👻
Stop Loss 🛑:
4H Swing High/Wick (Near 2.25900) – Adjust based on your risk & lot size.
"A smart thief always has an exit route." 🏃💨
Target 🎯: 2.22000 (or escape early if the trap snaps shut!)
💣 WHY THIS HEIST? (Bearish Triggers)
Technical Setup: Oversold bounce? Nah. Consolidation → Reversal trap.
Fundamentals: Weak GBP sentiment? Strong NZD data? Check the news!
Market Psychology: Bulls are getting trapped at resistance—time to fade them.
⚠️ THIEF’S WARNING
News = Volatility Bomb 💣 – Avoid new trades during high-impact events.
Trailing SLs = Your Best Friend – Lock profits & dodge reversals.
💎 BOOST THIS IDEA & JOIN THE HEIST!
🔥 Hit 👍 LIKE, 🚀 BOOST, and FOLLOW for more lucrative robberies!
💸 "Steal the market’s money—before it steals yours." 🏴☠️
🔔 Stay tuned—next heist coming soon! 🔔
GBP-NZD Will Keep Falling! Sell!
Hello,Traders!
GBP-NZD keeps falling down
And the pair made a strong
Bearish breakout of the key
Horizontal key level of 2.2400
And the breakout is confirmed
So we are bearish biased and
We will be expecting a further
Bearish move down on Monday
Sell!
Comment and subscribe to help us grow!
Check out other forecasts below too!
Disclosure: I am part of Trade Nation's Influencer program and receive a monthly fee for using their TradingView charts in my analysis.

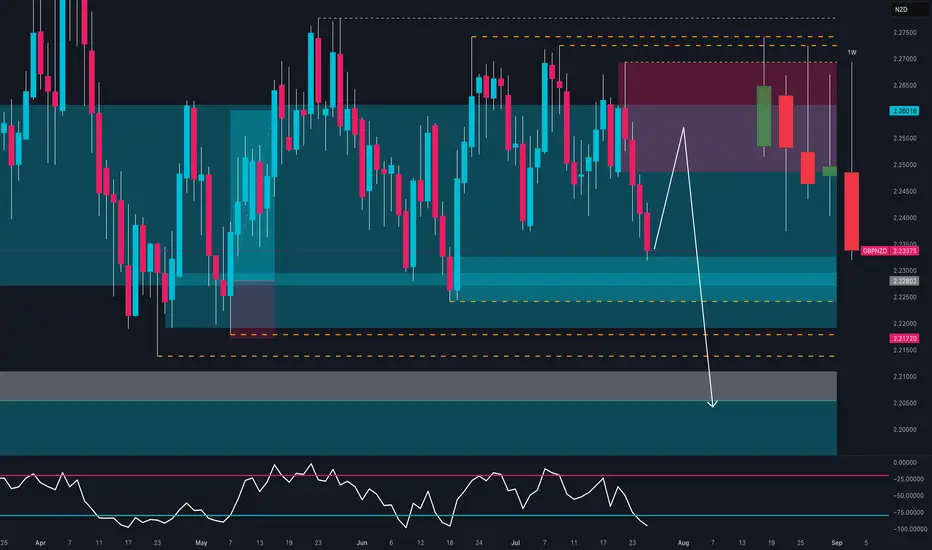
GBPNZD Breakdown – Smart Money Turns Fully Bearish🧠 Macro + COT + Sentiment Context
Commitment of Traders (COT) – Asset Managers
Institutional asset managers are significantly net short on GBPNZD, with positioning at its lowest level of the year and declining sharply since May. This reflects a clear bearish stance from smart money and reinforces the current downward pressure.
Sentiment & Momentum Indicators
DPO: -54.9 → Indicates a moderately bearish momentum phase.
Wyckoff: -20.3 → Price is in a distribution phase, suggesting weakness.
Speed: 3.2 → Low acceleration, but directional bias remains bearish.
Market Mood: Neutral, but leaning into oversold territory.
Seasonality (July 1st – Sept 30th)
Historically, GBPNZD performs positively in this period:
3Y: +1.7%, 5Y: +1.6%, 10Y: +2.3%, 15Y: +2.8%
However, in 2025, price is diverging sharply from seasonal norms. The pair is trading against historical patterns, suggesting a seasonal anomaly where institutional flow is dominating historical behavior.
🧱 Technical Outlook (Daily Chart)
GBPNZD had been consolidating in a clear range between 2.2170 support and 2.2750 resistance since May. The pair has now broken down with a strong, full-bodied weekly candle, closing below the 2.2320 demand zone.
Key Technical Zones:
Supply zone (2.2494–2.2659) → A clear rejection zone that initiated the current selloff.
Demand zone (2.2170–2.2300) → Has been tested twice already, increasing the probability of a clean breakdown.
RSI (Daily) → Currently neutral, with a sequence of lower highs and no bullish divergence in sight — indicating weak momentum.
✅ Conclusion & Trade Plan
Directional Bias: Bearish (Short)
Although seasonality typically supports bullish price action for GBPNZD in Q3, the current context is decisively bearish. Institutional positioning, price structure, and sentiment all confirm a potential shift in direction, reinforced by a confirmed weekly breakdown.
Bearish Targets:
📍 First: 2.2170 (recent support test)
📍 Second: 2.2000–2.1900 (April swing low)
📍 Extension: 2.1750 (base of previous accumulation zone)
Invalidation Criteria:
A weekly close above 2.2490 (supply zone breached)
Bullish RSI divergence + weekly recovery candle