NZDCHF - Weekly Forecast - Technical Analysis & Trading IdeasMidterm forecast:
While the price is above the support 0.49439, beginning of uptrend is expected.
We make sure when the resistance at 0.52680 breaks.
If the support at 0.49439 is broken, the short-term forecast -beginning of uptrend- will be invalid.
OANDA:NZDCHF
Technical analysis:
A peak is formed in daily chart at 0.51845 on 02/20/2025, so more losses to support(s) 0.49950 and minimum to Major Support (0.49439) is expected.
Take Profits:
0.51043
0.51780
0.52680
0.53798
0.55094
0.56221
0.56728
0.57630
0.58900
0.60187
0.65051
__________________________________________________________________
❤️ If you find this helpful and want more FREE forecasts in TradingView,
. . . . . . . . Hit the 'BOOST' button 👍
. . . . . . . . . . . Drop some feedback in the comments below! (e.g., What did you find most useful? How can we improve?)
🙏 Your support is appreciated!
Now, it's your turn!
Be sure to leave a comment; let us know how you see this opportunity and forecast.
Have a successful week,
ForecastCity Support Team
NZD (New Zealand Dollar)

NZDCAD NICE SHORT OPPORTUNITY its an amazing opportunity for short nzdcad with a nice R/R
i beleive we will hit the target

NZDJPY: Expecting Bearish Movement! Here is Why:
The analysis of the NZDJPY chart clearly shows us that the pair is finally about to tank due to the rising pressure from the sellers.
Disclosure: I am part of Trade Nation's Influencer program and receive a monthly fee for using their TradingView charts in my analysis.
❤️ Please, support our work with like & comment! ❤️

GBP_NZD BEARISH BREAKOUT|SHORT|
✅GBP_NZD was trading in
An uptrend but now we are
Seeing a bearish breakout
From the bearish wedge
Pattern so we are bearish
Biased and we will be expecting
A further move down
SHORT🔥
✅Like and subscribe to never miss a new idea!✅

NZD/JPY BEARS ARE STRONG HERE|SHORT
NZDJPY SIGNAL
Trade Direction: short
Entry Level: 85.167
Target Level: 84.161
Stop Loss: 85.834
RISK PROFILE
Risk level: medium
Suggested risk: 1%
Timeframe: 9h
Disclosure: I am part of Trade Nation's Influencer program and receive a monthly fee for using their TradingView charts in my analysis.

Could the Kiwi reverse from here?The price is rising towards the pivot which has been identified as a pullback resistance and could drop to the pullback support.
Pivot: 0.5722
1st Support: 0.5677
1st Resistance: 0.5750
Risk Warning:
Trading Forex and CFDs carries a high level of risk to your capital and you should only trade with money you can afford to lose. Trading Forex and CFDs may not be suitable for all investors, so please ensure that you fully understand the risks involved and seek independent advice if necessary.
Disclaimer:
The above opinions given constitute general market commentary, and do not constitute the opinion or advice of IC Markets or any form of personal or investment advice.
Any opinions, news, research, analyses, prices, other information, or links to third-party sites contained on this website are provided on an "as-is" basis, are intended only to be informative, is not an advice nor a recommendation, nor research, or a record of our trading prices, or an offer of, or solicitation for a transaction in any financial instrument and thus should not be treated as such. The information provided does not involve any specific investment objectives, financial situation and needs of any specific person who may receive it. Please be aware, that past performance is not a reliable indicator of future performance and/or results. Past Performance or Forward-looking scenarios based upon the reasonable beliefs of the third-party provider are not a guarantee of future performance. Actual results may differ materially from those anticipated in forward-looking or past performance statements. IC Markets makes no representation or warranty and assumes no liability as to the accuracy or completeness of the information provided, nor any loss arising from any investment based on a recommendation, forecast or any information supplied by any third-party.

GBPNZD Bullish Continuation - Will Buyers Push Toward 2.28000?OANDA:GBPNZD is trading within a well-defined ascending channel, with price action consistently respecting both the upper and lower boundaries. The recent bullish impulse suggests that buyers are maintaining control, indicating a potential continuation toward the upper boundary.
The price has recently broken above a key resistance zone and may come back for a retest. If this level holds as support, it would reinforce the bullish structure and increase the likelihood of a move toward 2.28000, which aligns with the channel’s upper boundary.
As long as the price remains above this support zone, the bullish outlook remains valid. However, a failure to hold the support zone would invalidate the bullish scenario and open the possibility for a deeper pullback toward the channel’s lower boundary.
Remember, always confirm your setups and trade with solid risk management.
Best of luck!

GBP/NZD BEARISH BIAS RIGHT NOW| SHORT
Hello, Friends!
We are now examining the GBP/NZD pair and we can see that the pair is going up locally while also being in a uptrend on the 1W TF. But there is also a powerful signal from the BB upper band being nearby, indicating that the pair is overbought so we can go short from the resistance line above and a target at 2.240 level.
Disclosure: I am part of Trade Nation's Influencer program and receive a monthly fee for using their TradingView charts in my analysis.
✅LIKE AND COMMENT MY IDEAS✅

Bearish drop?NZD/JPY has reacted off the pivot and could drop to the 1st support.
Pivot: 86.22
1st Support: 83.43
1st Resistance: 86.10
Risk Warning:
Trading Forex and CFDs carries a high level of risk to your capital and you should only trade with money you can afford to lose. Trading Forex and CFDs may not be suitable for all investors, so please ensure that you fully understand the risks involved and seek independent advice if necessary.
Disclaimer:
The above opinions given constitute general market commentary, and do not constitute the opinion or advice of IC Markets or any form of personal or investment advice.
Any opinions, news, research, analyses, prices, other information, or links to third-party sites contained on this website are provided on an "as-is" basis, are intended only to be informative, is not an advice nor a recommendation, nor research, or a record of our trading prices, or an offer of, or solicitation for a transaction in any financial instrument and thus should not be treated as such. The information provided does not involve any specific investment objectives, financial situation and needs of any specific person who may receive it. Please be aware, that past performance is not a reliable indicator of future performance and/or results. Past Performance or Forward-looking scenarios based upon the reasonable beliefs of the third-party provider are not a guarantee of future performance. Actual results may differ materially from those anticipated in forward-looking or past performance statements. IC Markets makes no representation or warranty and assumes no liability as to the accuracy or completeness of the information provided, nor any loss arising from any investment based on a recommendation, forecast or any information supplied by any third-party.

Bullish bounce off overlap support?NZD/JPY has bounced off the support level which is an overlap support and could rise from this level to our take profit.
Entry: 84.57
Why we like it:
There is an overlap support level.
Stop loss: 83.93
Why we like it:
There is a pullback support level that is slightly below the 61.8% Fibonacci retracement.
Take profit: 85.61
Why we like it:
There is a pullback resistance level.
Enjoying your TradingView experience? Review us!
Please be advised that the information presented on TradingView is provided to Vantage (‘Vantage Global Limited’, ‘we’) by a third-party provider (‘Everest Fortune Group’). Please be reminded that you are solely responsible for the trading decisions on your account. There is a very high degree of risk involved in trading. Any information and/or content is intended entirely for research, educational and informational purposes only and does not constitute investment or consultation advice or investment strategy. The information is not tailored to the investment needs of any specific person and therefore does not involve a consideration of any of the investment objectives, financial situation or needs of any viewer that may receive it. Kindly also note that past performance is not a reliable indicator of future results. Actual results may differ materially from those anticipated in forward-looking or past performance statements. We assume no liability as to the accuracy or completeness of any of the information and/or content provided herein and the Company cannot be held responsible for any omission, mistake nor for any loss or damage including without limitation to any loss of profit which may arise from reliance on any information supplied by Everest Fortune Group.

Bullish rise?NZD/CHF has bounced off the support level which is a pullback support that lines up with the 38.2% Fibonacci retracement and could rise from this level to our take profit.
Entry: 0.50307
Why we like it:
There is a pullback support level that lines up with the 38.2% Fibonacci retracement.
Stop loss: 0.50055
Why we like it:
There is a pullback support level.
Take profit: 0.5093
Why we like it:
There is a pullback resistance level that is slightly above the 78.6% Fibonacci retracement.
Enjoying your TradingView experience? Review us!
Please be advised that the information presented on TradingView is provided to Vantage (‘Vantage Global Limited’, ‘we’) by a third-party provider (‘Everest Fortune Group’). Please be reminded that you are solely responsible for the trading decisions on your account. There is a very high degree of risk involved in trading. Any information and/or content is intended entirely for research, educational and informational purposes only and does not constitute investment or consultation advice or investment strategy. The information is not tailored to the investment needs of any specific person and therefore does not involve a consideration of any of the investment objectives, financial situation or needs of any viewer that may receive it. Kindly also note that past performance is not a reliable indicator of future results. Actual results may differ materially from those anticipated in forward-looking or past performance statements. We assume no liability as to the accuracy or completeness of any of the information and/or content provided herein and the Company cannot be held responsible for any omission, mistake nor for any loss or damage including without limitation to any loss of profit which may arise from reliance on any information supplied by Everest Fortune Group.

WHY NZDJPY BULLISH, DETAILED TECHNICAL AND FUNDAMENTALS ANALYSISNZDJPY is currently trading at 84.8, forming a descending channel pattern, a classic technical setup that often signals a bullish reversal upon breakout. If the pair successfully breaks above the upper trendline, we can anticipate strong upward momentum, with a potential target of 88.8, offering a gain of over 300 pips. Traders should closely monitor key resistance levels, as a breakout confirmation could trigger a significant price surge.
From a technical standpoint, the descending channel pattern indicates a series of lower highs and lower lows, reflecting a temporary downtrend. However, once price action breaks above this structure, a sharp bullish rally is often observed. The breakout zone to watch is around 85.5-86.0, with initial resistance at 86.5 before the final target of 88.8. Support remains strong around 83.5, where buyers are expected to step in if any pullback occurs before the breakout.
On the fundamental side, NZDJPY is heavily influenced by risk sentiment, global economic trends, and monetary policy differences between the Reserve Bank of New Zealand (RBNZ) and the Bank of Japan (BOJ). The yen remains weak due to BOJ’s ultra-loose monetary policy, while NZD could strengthen on improving commodity demand and a stable interest rate outlook. If risk appetite increases, NZDJPY could see further bullish momentum, accelerating the breakout.
With technicals aligning for a breakout and fundamentals supporting further gains, NZDJPY presents a strong trading opportunity. A confirmed breakout above the descending channel could fuel rapid upside movement, making this a high-probability setup for traders looking to capitalize on the next bullish wave.

Bearish reversal off 50% Fibonacci resistance?NZD/CHF is rising towards the pivot and could reverse to the 1st support.
Pivot: 0.50612
1st Support: 0.50042
1st Resistance: 0.51128
Risk Warning:
Trading Forex and CFDs carries a high level of risk to your capital and you should only trade with money you can afford to lose. Trading Forex and CFDs may not be suitable for all investors, so please ensure that you fully understand the risks involved and seek independent advice if necessary.
Disclaimer:
The above opinions given constitute general market commentary, and do not constitute the opinion or advice of IC Markets or any form of personal or investment advice.
Any opinions, news, research, analyses, prices, other information, or links to third-party sites contained on this website are provided on an "as-is" basis, are intended only to be informative, is not an advice nor a recommendation, nor research, or a record of our trading prices, or an offer of, or solicitation for a transaction in any financial instrument and thus should not be treated as such. The information provided does not involve any specific investment objectives, financial situation and needs of any specific person who may receive it. Please be aware, that past performance is not a reliable indicator of future performance and/or results. Past Performance or Forward-looking scenarios based upon the reasonable beliefs of the third-party provider are not a guarantee of future performance. Actual results may differ materially from those anticipated in forward-looking or past performance statements. IC Markets makes no representation or warranty and assumes no liability as to the accuracy or completeness of the information provided, nor any loss arising from any investment based on a recommendation, forecast or any information supplied by any third-party.

#NZDJPYWe are breaking this strong resistance
As long as we're holding above we'll see it hit 85.630

NZD/JPY Giving Amazing Bullish P.A , Best Place To Buy Cleared !This Is An Educational + Analytic Content That Will Teach Why And How To Enter A Trade
Make Sure You Watch The Price Action Closely In Each Analysis As This Is A Very Important Part Of Our Method
Disclaimer : This Analysis Can Change At Anytime Without Notice And It Is Only For The Purpose Of Assisting Traders To Make Independent Investments Decisions.

GBPNZD: Weak Market & Bearish Continuation
The charts are full of distraction, disturbance and are a graveyard of fear and greed which shall not cloud our judgement on the current state of affairs in the GBPNZD pair price action which suggests a high likelihood of a coming move down.
Disclosure: I am part of Trade Nation's Influencer program and receive a monthly fee for using their TradingView charts in my analysis.
❤️ Please, support our work with like & comment! ❤️

Bullish bounce off overlap support?NZD/CAD is falling towards the pivot and could bounce to the 1st resistance.
Pivot: 0.81661
1st Support: 0.81118
1st Resistance: 0.82660
Risk Warning:
Trading Forex and CFDs carries a high level of risk to your capital and you should only trade with money you can afford to lose. Trading Forex and CFDs may not be suitable for all investors, so please ensure that you fully understand the risks involved and seek independent advice if necessary.
Disclaimer:
The above opinions given constitute general market commentary, and do not constitute the opinion or advice of IC Markets or any form of personal or investment advice.
Any opinions, news, research, analyses, prices, other information, or links to third-party sites contained on this website are provided on an "as-is" basis, are intended only to be informative, is not an advice nor a recommendation, nor research, or a record of our trading prices, or an offer of, or solicitation for a transaction in any financial instrument and thus should not be treated as such. The information provided does not involve any specific investment objectives, financial situation and needs of any specific person who may receive it. Please be aware, that past performance is not a reliable indicator of future performance and/or results. Past Performance or Forward-looking scenarios based upon the reasonable beliefs of the third-party provider are not a guarantee of future performance. Actual results may differ materially from those anticipated in forward-looking or past performance statements. IC Markets makes no representation or warranty and assumes no liability as to the accuracy or completeness of the information provided, nor any loss arising from any investment based on a recommendation, forecast or any information supplied by any third-party.

Potential bearish drop?NZD/CAD has reacted off the resistance level which lines up with the 127.2% Fibonacci extension and could drop from this level to our take profit.
Entry: 0.82762
Why we like it:
There is a resistance level at the 127.2% Fibonacci extension.
Stop loss: 0.83048
Why we like it:
There is a resistance level that aligns with the 161.8% Fibonacci extension.
Take profit: 0.81723
Why we like it:
There is an overlap support level that lines up with the 509% Fibonacci retracement.
Enjoying your TradingView experience? Review us!
Please be advised that the information presented on TradingView is provided to Vantage (‘Vantage Global Limited’, ‘we’) by a third-party provider (‘Everest Fortune Group’). Please be reminded that you are solely responsible for the trading decisions on your account. There is a very high degree of risk involved in trading. Any information and/or content is intended entirely for research, educational and informational purposes only and does not constitute investment or consultation advice or investment strategy. The information is not tailored to the investment needs of any specific person and therefore does not involve a consideration of any of the investment objectives, financial situation or needs of any viewer that may receive it. Kindly also note that past performance is not a reliable indicator of future results. Actual results may differ materially from those anticipated in forward-looking or past performance statements. We assume no liability as to the accuracy or completeness of any of the information and/or content provided herein and the Company cannot be held responsible for any omission, mistake nor for any loss or damage including without limitation to any loss of profit which may arise from reliance on any information supplied by Everest Fortune Group.

NZD/CAD Triangle BreakoutThe NZD/CAD pair on the M30 timeframe presents a Potential Buying Opportunity due to a recent Formation of a Triangle Pattern. This suggests a shift in momentum towards the upside and a higher likelihood of further advances in the coming hours.
Possible Long Trade:
Entry: Consider Entering A Long Position around Trendline Of The Pattern.
Target Levels:
1st Resistance – 0.8268
2nd Resistance – 0.8301
🎁 Please hit the like button and
🎁 Leave a comment to support for My Post !
Your likes and comments are incredibly motivating and will encourage me to share more analysis with you.
Best Regards, KABHI_TA_TRADING
Thank you.

NZDUSD Potential UpsidesHey Traders, in today's trading session we are monitoring NZDUSD for a buying opportunity around 0.57100 zone, NZDUSD is trading in an uptrend and currently is in a correction phase in which it is approaching the trend at 0.57100 support and resistance area.
Trade safe, Joe.

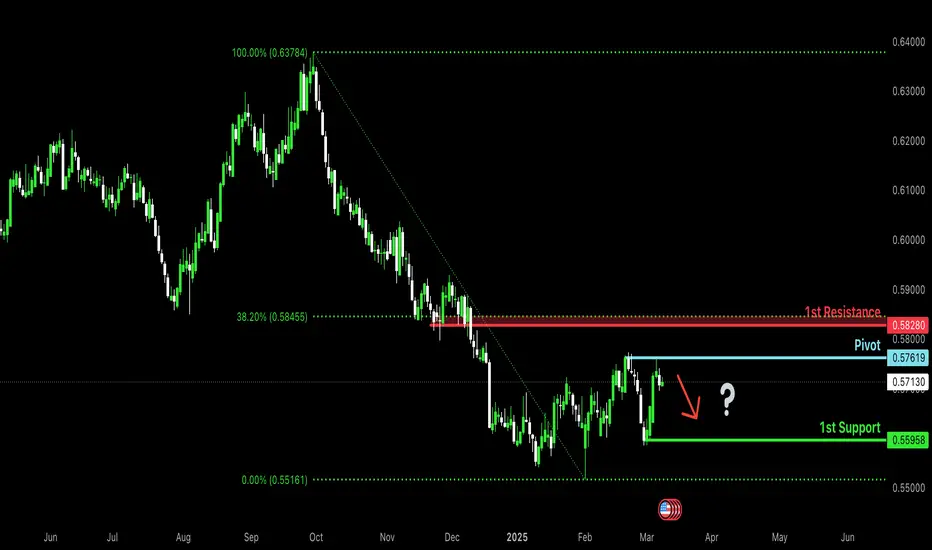
Bearish drop?The Kiwi (NZD/USD) has reacted off the pivot and could drop to the 1st support.
Pivot: 0.5761
1st Support: 0.5595
1st Resistance: 0.5828
Risk Warning:
Trading Forex and CFDs carries a high level of risk to your capital and you should only trade with money you can afford to lose. Trading Forex and CFDs may not be suitable for all investors, so please ensure that you fully understand the risks involved and seek independent advice if necessary.
Disclaimer:
The above opinions given constitute general market commentary, and do not constitute the opinion or advice of IC Markets or any form of personal or investment advice.
Any opinions, news, research, analyses, prices, other information, or links to third-party sites contained on this website are provided on an "as-is" basis, are intended only to be informative, is not an advice nor a recommendation, nor research, or a record of our trading prices, or an offer of, or solicitation for a transaction in any financial instrument and thus should not be treated as such. The information provided does not involve any specific investment objectives, financial situation and needs of any specific person who may receive it. Please be aware, that past performance is not a reliable indicator of future performance and/or results. Past Performance or Forward-looking scenarios based upon the reasonable beliefs of the third-party provider are not a guarantee of future performance. Actual results may differ materially from those anticipated in forward-looking or past performance statements. IC Markets makes no representation or warranty and assumes no liability as to the accuracy or completeness of the information provided, nor any loss arising from any investment based on a recommendation, forecast or any information supplied by any third-party.
NZDCAD BUY The MACD is below its signal line and positiveNZDCAD The price could retrace, the RSI is above its neutrality area at 50. The MACD is below its signal line and positive. Moreover the price jumped from the 8EMA.

NZD_CAD POTENTIAL LONG|
✅NZD_CAD is trading in a
Local uptrend and the made
A bullish breakout of the falling
Resistance line which is now
A support and the pair made a
Retest of the line and is already
Making a bullish rebound
So we will be expecting a
Further bullish move up
LONG🚀
✅Like and subscribe to never miss a new idea!✅
