Bearish drop off pullback resistance?NZD/JPY has rejected on the pivot and could drop to the 1st support.
Pivot: 86.70
1st Support: 85.11
1st Resistance: 87.37
Risk Warning:
Trading Forex and CFDs carries a high level of risk to your capital and you should only trade with money you can afford to lose. Trading Forex and CFDs may not be suitable for all investors, so please ensure that you fully understand the risks involved and seek independent advice if necessary.
Disclaimer:
The above opinions given constitute general market commentary, and do not constitute the opinion or advice of IC Markets or any form of personal or investment advice.
Any opinions, news, research, analyses, prices, other information, or links to third-party sites contained on this website are provided on an "as-is" basis, are intended only to be informative, is not an advice nor a recommendation, nor research, or a record of our trading prices, or an offer of, or solicitation for a transaction in any financial instrument and thus should not be treated as such. The information provided does not involve any specific investment objectives, financial situation and needs of any specific person who may receive it. Please be aware, that past performance is not a reliable indicator of future performance and/or results. Past Performance or Forward-looking scenarios based upon the reasonable beliefs of the third-party provider are not a guarantee of future performance. Actual results may differ materially from those anticipated in forward-looking or past performance statements. IC Markets makes no representation or warranty and assumes no liability as to the accuracy or completeness of the information provided, nor any loss arising from any investment based on a recommendation, forecast or any information supplied by any third-party.
NZD (New Zealand Dollar)

Bearish drop?NZD/JPY has reacted off the resistance level which is a pullback resistance that lines up with the 61.8% Fibonacci retracement and could drop from this level to our take profit.
Entry: 86.64
Why we like it:
There is a pullback resistance level that line sup with the 61.8% Fibonacci retracement.
Stop loss: 87.39
Why we like it:
There is a pullback resistance level.
Take profit: 85.55
Why we like it:
There is an overlap support level.
Enjoying your TradingView experience? Review us!
Please be advised that the information presented on TradingView is provided to Vantage (‘Vantage Global Limited’, ‘we’) by a third-party provider (‘Everest Fortune Group’). Please be reminded that you are solely responsible for the trading decisions on your account. There is a very high degree of risk involved in trading. Any information and/or content is intended entirely for research, educational and informational purposes only and does not constitute investment or consultation advice or investment strategy. The information is not tailored to the investment needs of any specific person and therefore does not involve a consideration of any of the investment objectives, financial situation or needs of any viewer that may receive it. Kindly also note that past performance is not a reliable indicator of future results. Actual results may differ materially from those anticipated in forward-looking or past performance statements. We assume no liability as to the accuracy or completeness of any of the information and/or content provided herein and the Company cannot be held responsible for any omission, mistake nor for any loss or damage including without limitation to any loss of profit which may arise from reliance on any information supplied by Everest Fortune Group.

Bullish bounce?NZD/CHF is falling towards the support level which is an overlap support and could bounce from this level to our take profit.
Entry: 0.50509
Why we like it:
There is an overlap support level.
Stop loss: 0.50258
Why we like it:
There is a pullback support level that is slightly below the 138.2% Fibonacci retracement.
Take profit: 0.50903
Why we like it:
There is a pullback resistance level.
Enjoying your TradingView experience? Review us!
Please be advised that the information presented on TradingView is provided to Vantage (‘Vantage Global Limited’, ‘we’) by a third-party provider (‘Everest Fortune Group’). Please be reminded that you are solely responsible for the trading decisions on your account. There is a very high degree of risk involved in trading. Any information and/or content is intended entirely for research, educational and informational purposes only and does not constitute investment or consultation advice or investment strategy. The information is not tailored to the investment needs of any specific person and therefore does not involve a consideration of any of the investment objectives, financial situation or needs of any viewer that may receive it. Kindly also note that past performance is not a reliable indicator of future results. Actual results may differ materially from those anticipated in forward-looking or past performance statements. We assume no liability as to the accuracy or completeness of any of the information and/or content provided herein and the Company cannot be held responsible for any omission, mistake nor for any loss or damage including without limitation to any loss of profit which may arise from reliance on any information supplied by Everest Fortune Group.

GBPNZD Sell GBPNZD is showing a Change of Character (ChoCh) on the Daily, signaling a potential shift in market structure. This is further reinforced by a double top confirmation on the 4-hour timeframe, indicating strong resistance and potential exhaustion of buyers. With price rejecting key levels and bearish momentum building, this setup presents a high-probability sell opportunity, especially if we see a strong bearish break and retest.

GBPNZD is in Selling DirectionHello Traders
In This Chart GBPNZD 4 HOURLY Forex Forecast By FOREX PLANET
today GBPNZD analysis 👆
🟢This Chart includes GBPNZD market update)
🟢What is The Next Opportunity on GBPNZD Market
🟢how to Enter to the Valid Entry With Assurance Profit
This CHART is For Trader's that Want to Improve Their Technical Analysis Skills and Their Trading By Understanding How To Analyze The Market Using Multiple Timeframes and Understanding The Bigger Picture on the Charts

NZD/CAD BEST PLACE TO SELL FROM|SHORT
Hello, Friends!
NZD/CAD is making a bullish rebound on the 1H TF and is nearing the resistance line above while we are generally bearish biased on the pair due to our previous 1W candle analysis, thus making a trend-following short a good option for us with the target being the 0.817 level.
Disclosure: I am part of Trade Nation's Influencer program and receive a monthly fee for using their TradingView charts in my analysis.
✅LIKE AND COMMENT MY IDEAS✅

Bearish breakout?NZD/CAD is reacting off the pivot and a breakout could potentially lead the price to drop to the 1st support.
Pivot: 0.8194
1st Support: 0.80792
1st Resistance: 0.82654
Risk Warning:
Trading Forex and CFDs carries a high level of risk to your capital and you should only trade with money you can afford to lose. Trading Forex and CFDs may not be suitable for all investors, so please ensure that you fully understand the risks involved and seek independent advice if necessary.
Disclaimer:
The above opinions given constitute general market commentary, and do not constitute the opinion or advice of IC Markets or any form of personal or investment advice.
Any opinions, news, research, analyses, prices, other information, or links to third-party sites contained on this website are provided on an "as-is" basis, are intended only to be informative, is not an advice nor a recommendation, nor research, or a record of our trading prices, or an offer of, or solicitation for a transaction in any financial instrument and thus should not be treated as such. The information provided does not involve any specific investment objectives, financial situation and needs of any specific person who may receive it. Please be aware, that past performance is not a reliable indicator of future performance and/or results. Past Performance or Forward-looking scenarios based upon the reasonable beliefs of the third-party provider are not a guarantee of future performance. Actual results may differ materially from those anticipated in forward-looking or past performance statements. IC Markets makes no representation or warranty and assumes no liability as to the accuracy or completeness of the information provided, nor any loss arising from any investment based on a recommendation, forecast or any information supplied by any third-party.

Bearish reversal?NZD/CHF is rising towards the pivot and could reverse to the 1st support.
Pivot: 0.50899
1st Support: 0.50213
1st Resistance: 0.51110
Risk Warning:
Trading Forex and CFDs carries a high level of risk to your capital and you should only trade with money you can afford to lose. Trading Forex and CFDs may not be suitable for all investors, so please ensure that you fully understand the risks involved and seek independent advice if necessary.
Disclaimer:
The above opinions given constitute general market commentary, and do not constitute the opinion or advice of IC Markets or any form of personal or investment advice.
Any opinions, news, research, analyses, prices, other information, or links to third-party sites contained on this website are provided on an "as-is" basis, are intended only to be informative, is not an advice nor a recommendation, nor research, or a record of our trading prices, or an offer of, or solicitation for a transaction in any financial instrument and thus should not be treated as such. The information provided does not involve any specific investment objectives, financial situation and needs of any specific person who may receive it. Please be aware, that past performance is not a reliable indicator of future performance and/or results. Past Performance or Forward-looking scenarios based upon the reasonable beliefs of the third-party provider are not a guarantee of future performance. Actual results may differ materially from those anticipated in forward-looking or past performance statements. IC Markets makes no representation or warranty and assumes no liability as to the accuracy or completeness of the information provided, nor any loss arising from any investment based on a recommendation, forecast or any information supplied by any third-party.

NZDUSD to find buyers at market price?NZDUSD - 24h expiry
Price action has stalled at good support levels and currently trades just above here (0.5725).
We expect a reversal in this move.
Risk/Reward would be poor to call a buy from current levels.
A move through 0.5775 will confirm the bullish momentum.
The measured move target is 0.5800.
We look to Buy at 0.5725 (stop at 0.5690)
Our profit targets will be 0.5795 and 0.5800
Resistance: 0.5775 / 0.5795 / 0.5800
Support: 0.5725 / 0.5700 / 0.5690
Risk Disclaimer
The trade ideas beyond this page are for informational purposes only and do not constitute investment advice or a solicitation to trade. This information is provided by Signal Centre, a third-party unaffiliated with OANDA, and is intended for general circulation only. OANDA does not guarantee the accuracy of this information and assumes no responsibilities for the information provided by the third party. The information does not take into account the specific investment objectives, financial situation, or particular needs of any particular person. You should take into account your specific investment objectives, financial situation, and particular needs before making a commitment to trade, including seeking advice from an independent financial adviser regarding the suitability of the investment, under a separate engagement, as you deem fit.
You accept that you assume all risks in independently viewing the contents and selecting a chosen strategy.
Where the research is distributed in Singapore to a person who is not an Accredited Investor, Expert Investor or an Institutional Investor, Oanda Asia Pacific Pte Ltd (“OAP“) accepts legal responsibility for the contents of the report to such persons only to the extent required by law. Singapore customers should contact OAP at 6579 8289 for matters arising from, or in connection with, the information/research distributed.

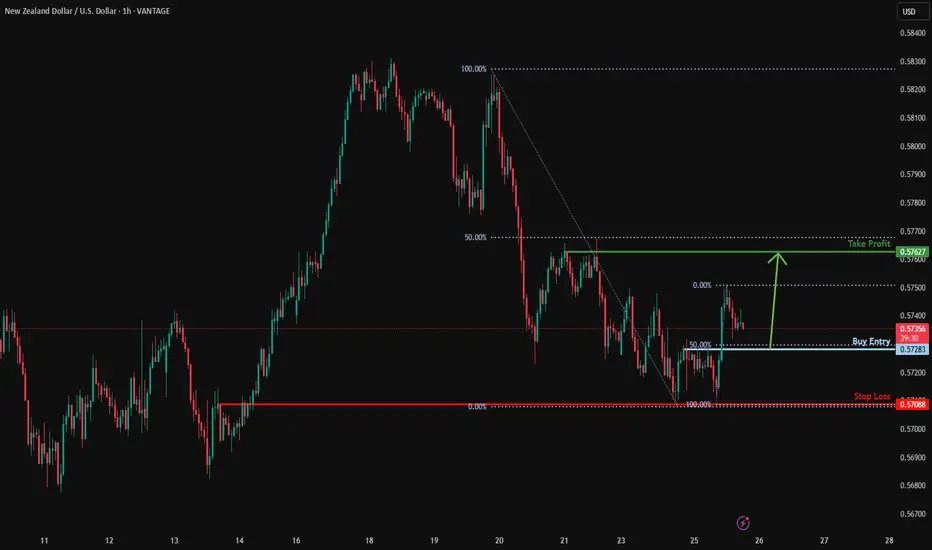
Falling towards 50% Fibonacci support?NZD/USD is falling towards the support level which is a pullback support that lines up with the 50% Fibonacci retracement and could bounce from this level to our take profit.
Entry: 0.5728
Why we like it:
There is a pullback support level that lines up with the 50% Fibonacci retracement.
Stop loss: 0.5708
Why we like it:
There is a pullback support level.
Take profit: 0.5762
Why we like it:
There is a pullback resistance.
Enjoying your TradingView experience? Review us!
NZDCAD: Bullish Continuation & Long Trade
NZDCAD
- Classic bullish formation
- Our team expects growth
SUGGESTED TRADE:
Swing Trade
Buy NZDCAD
Entry Level - 0.8206
Sl - 0.8171
Tp - 0.8262
Our Risk - 1%
Start protection of your profits from lower levels
Disclosure: I am part of Trade Nation's Influencer program and receive a monthly fee for using their TradingView charts in my analysis.
❤️ Please, support our work with like & comment! ❤️

GBPNZD: Fractured Ascent Signals Potential ReversalGBPNZD 4-hour chart reveals a compelling narrative of a weakening bullish trend potentially poised for a significant reversal. The pair's recent price action exhibits characteristics of a rising wedge pattern, a formation often indicative of an impending downside breakout.
Key Technical Observations:
Rising Wedge Formation: The converging trendlines point to a potential exhaustion of the upward momentum. The upper trendline has seen repeated rejections, suggesting a lack of sustained buying pressure.
Critical Support Level: The 2.25359 level is acting as a crucial support zone. A decisive break below this level would confirm the wedge breakdown and likely trigger a sharp bearish move.
Resistance Zone: The area around 2.27505 represents a significant resistance zone. Failure to break above this level reinforces the bearish outlook.
Potential Downside Targets: The chart indicates potential targets at 2.22934 and the low of 2.16774. These levels could act as significant support zones during a potential downtrend.
Trading Implications:
Short Entry Consideration: Traders should closely monitor the price action for a decisive break below the 2.25359 support. A confirmed breakdown could signal a strong short entry opportunity.
Stop-Loss Placement: A prudent stop-loss should be positioned above the recent swing high or the upper trendline of the wedge to mitigate risk.
Risk Management: Given the potential for increased volatility during a breakout, sound risk management is paramount.
Considerations:
Confirmation of Breakdown: A break below the 2.25359 support should be accompanied by strong bearish momentum and ideally, an increase in trading volume to validate the signal.
Fundamental Factors: Upcoming economic data releases from both the UK and New Zealand should be closely monitored, as they could significantly impact the pair's price action.
Conclusion:
The GBPNZD chart presents a compelling case for a potential bearish reversal. The rising wedge pattern, coupled with the critical support at 2.25359, suggests a high probability of a downside breakout. Traders should exercise caution and await confirmation of the breakdown before initiating short positions. Effective risk management is crucial to navigate the potential volatility associated with this trade setup.

ShortOn the 1D GBPNZD hit the resistance, which in previous cases afterwards it hit the support trendline and then bounced.
And then on the 4H it made a double top afterwards from which it made a bull trap and price went down by making a lower low and now it bounced right off the FVG and broke the 4H trendline, so for me GBPNZD should be going even lower, maybe to support.
www.tradingview.com

NZD/JPY BEARS WILL DOMINATE THE MARKET|SHORT
NZD/JPY SIGNAL
Trade Direction: short
Entry Level: 86.142
Target Level: 82.808
Stop Loss: 88.356
RISK PROFILE
Risk level: medium
Suggested risk: 1%
Timeframe: 1D
Disclosure: I am part of Trade Nation's Influencer program and receive a monthly fee for using their TradingView charts in my analysis.
✅LIKE AND COMMENT MY IDEAS✅

NZD-CAD Risky Long! Buy!
Hello,Traders!
NZD-CAD made a retest
Of the horizontal support
Of 0.8170 and we are already
Seeing a bullish rebound
So we are bullish biased
And we will be expecting
A further bullish move up
Buy!
Comment and subscribe to help us grow!
Check out other forecasts below too!
Disclosure: I am part of Trade Nation's Influencer program and receive a monthly fee for using their TradingView charts in my analysis.

NZDJPY rallies to continue attract sellers?NZDJPY - 24h expiry
The primary trend remains bearish.
We look for a temporary move higher.
Preferred trade is to sell into rallies.
The RSI is trending higher.
Bespoke resistance is located at 86.55.
We look to Sell at 86.55 (stop at 86.95)
Our profit targets will be 84.95 and 84.70
Resistance: 86.70 / 87.15 / 87.65
Support: 85.20 / 84.75 / 84.40
Risk Disclaimer
The trade ideas beyond this page are for informational purposes only and do not constitute investment advice or a solicitation to trade. This information is provided by Signal Centre, a third-party unaffiliated with OANDA, and is intended for general circulation only. OANDA does not guarantee the accuracy of this information and assumes no responsibilities for the information provided by the third party. The information does not take into account the specific investment objectives, financial situation, or particular needs of any particular person. You should take into account your specific investment objectives, financial situation, and particular needs before making a commitment to trade, including seeking advice from an independent financial adviser regarding the suitability of the investment, under a separate engagement, as you deem fit.
You accept that you assume all risks in independently viewing the contents and selecting a chosen strategy.
Where the research is distributed in Singapore to a person who is not an Accredited Investor, Expert Investor or an Institutional Investor, Oanda Asia Pacific Pte Ltd (“OAP“) accepts legal responsibility for the contents of the report to such persons only to the extent required by law. Singapore customers should contact OAP at 6579 8289 for matters arising from, or in connection with, the information/research distributed.

Bearish reversal?EUR/NZD is rising towards the resistance level which is a pullback resistance that aligns with the 61.8% Fibonacci retracement and could reverse from this level to our take profit.
Entry: 1.89747
Why we like it:
There is a pullback resistance level that line sup with the 61.8% Fibonacci retracement.
Stop loss: 1.90810
Why we like it:
There is a pullback resistance level that lines up with he 78.6% Fibonacci retracement.
Take profit: 1.8743
Why we like it:
There is a pullback support level.
Enjoying your TradingView experience? Review us!
Please be advised that the information presented on TradingView is provided to Vantage (‘Vantage Global Limited’, ‘we’) by a third-party provider (‘Everest Fortune Group’). Please be reminded that you are solely responsible for the trading decisions on your account. There is a very high degree of risk involved in trading. Any information and/or content is intended entirely for research, educational and informational purposes only and does not constitute investment or consultation advice or investment strategy. The information is not tailored to the investment needs of any specific person and therefore does not involve a consideration of any of the investment objectives, financial situation or needs of any viewer that may receive it. Kindly also note that past performance is not a reliable indicator of future results. Actual results may differ materially from those anticipated in forward-looking or past performance statements. We assume no liability as to the accuracy or completeness of any of the information and/or content provided herein and the Company cannot be held responsible for any omission, mistake nor for any loss or damage including without limitation to any loss of profit which may arise from reliance on any information supplied by Everest Fortune Group.

Potential bullish rise?NZD/JPY has bounced off the support level which is an overlap support and could rise from this level to our take profit.
Entry: 85.54
Why we like it:
There is an overlap support level.
Stop loss: 85.10
Why we like it:
There is an overlap support level that tis slightly above the 61.8% Fibonacci retracement.
Take profit: 86.65
Why we like it:
There is a pullback resistance level that is slightly above the 61.8% Fibonacci retracement.
Enjoying your TradingView experience? Review us!
Please be advised that the information presented on TradingView is provided to Vantage (‘Vantage Global Limited’, ‘we’) by a third-party provider (‘Everest Fortune Group’). Please be reminded that you are solely responsible for the trading decisions on your account. There is a very high degree of risk involved in trading. Any information and/or content is intended entirely for research, educational and informational purposes only and does not constitute investment or consultation advice or investment strategy. The information is not tailored to the investment needs of any specific person and therefore does not involve a consideration of any of the investment objectives, financial situation or needs of any viewer that may receive it. Kindly also note that past performance is not a reliable indicator of future results. Actual results may differ materially from those anticipated in forward-looking or past performance statements. We assume no liability as to the accuracy or completeness of any of the information and/or content provided herein and the Company cannot be held responsible for any omission, mistake nor for any loss or damage including without limitation to any loss of profit which may arise from reliance on any information supplied by Everest Fortune Group.

NZDCHF: Bullish Continuation
Looking at the chart of NZDCHF right now we are seeing some interesting price action on the lower timeframes. Thus a local move up seems to be quite likely.
Disclosure: I am part of Trade Nation's Influencer program and receive a monthly fee for using their TradingView charts in my analysis.
❤️ Please, support our work with like & comment! ❤️

GBP/NZD BEARS ARE STRONG HERE|SHORT
Hello, Friends!
GBP/NZD pair is trading in a local uptrend which we know by looking at the previous 1W candle which is green. On the 5H timeframe the pair is going up too. The pair is overbought because the price is close to the upper band of the BB indicator. So we are looking to sell the pair with the upper BB line acting as resistance. The next target is 2.240 area.
Disclosure: I am part of Trade Nation's Influencer program and receive a monthly fee for using their TradingView charts in my analysis.
✅LIKE AND COMMENT MY IDEAS✅

NZD/JPY "Kiwi vs Yen" Forex Market Heist Plan🌟Hi! Hola! Ola! Bonjour! Hallo! Marhaba!🌟
Dear Money Makers & Thieves, 🤑💰💸✈️
Based on 🔥Thief Trading style technical and fundamental analysis🔥, here is our master plan to heist the NZD/JPY "Kiwi vs Yen" Forex market. Please adhere to the strategy I've outlined in the chart, which emphasizes long entry. Our aim is the high-risk Red Zone. Risky level, overbought market, consolidation, trend reversal, trap at the level where traders and bearish robbers are stronger. 🏆💸Book Profits wealthy and safe trade.💪🏆🎉
Entry 📈 : "The heist is on! Wait for the MA breakout (85.000) then make your move - Bullish profits await!"
however I advise to Place Buy stop orders above the Moving average (or) Place buy limit orders within a 15 or 30 minute timeframe most recent or swing, low or high level.
📌I strongly advise you to set an alert on your chart so you can see when the breakout entry occurs.
Stop Loss 🛑:
Thief SL placed at the recent/swing low or high level Using the 4H timeframe (83.800) swing trade basis.
SL is based on your risk of the trade, lot size and how many multiple orders you have to take.
Target 🎯: 87.000 (or) Escape Before the Target
🧲Scalpers, take note 👀 : only scalp on the Long side. If you have a lot of money, you can go straight away; if not, you can join swing traders and carry out the robbery plan. Use trailing SL to safeguard your money 💰.
📰🗞️Read the Fundamental, Macro, COT Report, Quantitative Analysis, Intermarket Analysis, Sentimental Outlook, Future Trend Move:
NZD/JPY "Kiwi vs Yen" Forex Market is currently experiencing a Bullish trend., driven by several key factors.
⭐☀🌟Fundamental Analysis⭐☀🌟
Fundamental analysis focuses on economic and political factors influencing NZD (New Zealand Dollar) and JPY (Japanese Yen).
New Zealand (NZD):
Interest Rates: The Reserve Bank of New Zealand (RBNZ) sets the Official Cash Rate (OCR). As of early 2025, assume the OCR is around 4.5% (based on prior tightening cycles). Higher rates typically support NZD, but if inflation is cooling (e.g., below 3%), rate cuts could loom, pressuring NZD downward.
Economic Data: Key drivers include dairy prices (a major export), GDP growth (projected ~2% in 2025), and employment (assume ~4% unemployment). Weak dairy prices or slowing growth could weaken NZD.
Trade Balance: NZ relies heavily on exports to China. If China’s economy slows in 2025, NZD may face headwinds.
Political Stability: New Zealand is stable, so no major political risk unless unexpected elections or policy shifts occur.
Japan (JPY):
Interest Rates: The Bank of Japan (BOJ) has historically kept rates near zero (e.g., 0.1% in 2024). If 2025 sees a shift to 0.5% due to inflation pressures (e.g., above 2%), JPY could strengthen, but gradualism is likely.
Economic Data: Japan’s GDP growth is slow (~1%), with deflation risks fading. Strong export data (e.g., machinery, autos) supports JPY.
Safe-Haven Status: JPY gains in risk-off scenarios (e.g., geopolitical tensions or equity sell-offs).
Yen Carry Trade: Low rates make JPY a funding currency. If global risk appetite rises, JPY weakens as traders borrow yen to buy higher-yielding assets like NZD.
NZD/JPY Impact: Higher NZD yields vs. JPY favor bullishness, but JPY strength could emerge if global risk aversion spikes or BOJ tightens unexpectedly.
⭐☀🌟Macro Economics⭐☀🌟
Macro factors extend beyond fundamentals to broader economic cycles:
Global Growth: Assume 2025 global GDP growth is ~3%. Strong growth favors NZD (commodity currency), while slowdowns boost JPY (safe haven).
Inflation Trends: NZ inflation cooling (e.g., 2.5%) vs. Japan’s rising (e.g., 2%) could narrow the yield gap, pressuring NZD/JPY lower.
Monetary Policy Divergence: RBNZ pausing or cutting vs. BOJ tightening could shift NZD/JPY bearish.
Commodity Prices: NZD benefits from rising dairy, meat, and lumber prices. A commodity rally supports bullish NZD/JPY.
Currency Intervention: Japan may intervene if JPY weakens past 150 vs. USD (NZD/JPY less directly affected but still relevant).
⭐☀🌟Global Market Analysis⭐☀🌟
Equity Markets: Bullish global stocks (e.g., S&P 500 up 5% YTD) favor NZD (risk-on) over JPY (risk-off).
Bond Yields: Rising NZ 10-year yields (e.g., 4.8%) vs. Japan’s (e.g., 1%) support NZD/JPY upside.
Forex Trends: If USD/JPY is climbing (e.g., 148), JPY weakness could lift NZD/JPY. Conversely, USD/NZD strength signals NZD weakness.
Geopolitical Risks: Tensions (e.g., U.S.-China trade war escalation) boost JPY, capping NZD/JPY gains.
⭐☀🌟COT Data (Commitment of Traders)⭐☀🌟
COT reports from the CFTC show speculative positioning:
NZD Futures: If net long positions are rising (e.g., +10,000 contracts), bulls dominate. Net short (-5,000) signals bearish pressure.
JPY Futures: Heavy net short positions (e.g., -50,000) indicate JPY weakness (carry trade unwind risk). Net long suggests safe-haven buying.
NZD/JPY Inference: Bullish if NZD longs increase and JPY shorts persist; bearish if reversed.
Note: Exact COT data requires real-time access (e.g., CFTC release March 7, 2025). Check the latest report for precision.
⭐☀🌟Intermarket Analysis⭐☀🌟
NZD Correlations: Positive with AUD (0.8 correlation) and commodity indices (e.g., CRB). AUD/NZD strength or commodity rallies lift NZD/JPY.
JPY Correlations: Negative with equities (-0.7 vs. Nikkei). Equity declines strengthen JPY, pressuring NZD/JPY.
Gold: Rising gold prices signal risk-off, favoring JPY over NZD.
⭐☀🌟Quantitative Analysis⭐☀🌟
Technical Levels:
Support: 83.50 (50-day SMA), 82.00 (200-day SMA).
Resistance: 85.00 (psychological), 86.50 (Fibonacci 61.8% retracement from prior high).
RSI: At 55 (neutral), no overbought/oversold signal.
Bollinger Bands: Price near upper band (e.g., 84.80) suggests potential pullback.
Volatility: Implied volatility (e.g., 10% annualized) indicates moderate moves ahead.
Probability: 60% chance of testing 85.50 if bullish, 55% chance of 83.00 if bearish (based on historical ranges).
⭐☀🌟Market Sentiment Analysis⭐☀🌟
Retail Sentiment: If 70% of retail traders are long NZD/JPY (contrarian signal), a reversal may loom.
News Sentiment: Positive NZ economic releases vs. Japan’s cautious BOJ tone could tilt sentiment bullish.
⭐☀🌟Positioning (Next Trend Move)⭐☀🌟
Short-Term (1-4 weeks):
Bullish Target: 85.50 (break above 85.00 resistance).
Bearish Target: 83.50 (support test).
Medium-Term (1-3 months):
Bullish Target: 86.50 (if risk-on persists).
Bearish Target: 82.00 (200-day SMA breach).
Long-Term (6-12 months):
Bullish Target: 88.00 (multi-year resistance).
Bearish Target: 80.00 (if global recession hits).
Trend Direction: Mildly bullish short-term unless risk-off spikes.
⭐☀🌟Overall Summary Outlook⭐☀🌟
Current Price: 84.500.
Bias: Mildly bullish short-term due to NZD yield advantage and risk-on sentiment, but JPY strength could cap gains if global risks rise.
Key Drivers: RBNZ vs. BOJ policy, commodity prices, global risk appetite.
Prediction: Bullish to 85.50 short-term (70% probability) if equities hold; bearish to 83.00 (60% probability) if JPY safe-haven flows dominate.
📌Keep in mind that these factors can change rapidly, and it's essential to stay up-to-date with market developments and adjust your analysis accordingly.
⚠️Trading Alert : News Releases and Position Management 📰 🗞️ 🚫🚏
As a reminder, news releases can have a significant impact on market prices and volatility. To minimize potential losses and protect your running positions,
we recommend the following:
Avoid taking new trades during news releases
Use trailing stop-loss orders to protect your running positions and lock in profits
💖Supporting our robbery plan 💥Hit the Boost Button💥 will enable us to effortlessly make and steal money 💰💵. Boost the strength of our robbery team. Every day in this market make money with ease by using the Thief Trading Style.🏆💪🤝❤️🎉🚀
I'll see you soon with another heist plan, so stay tuned 🤑🐱👤🤗🤩

NZD/CAD "Kiwi vs Loonie" Forex Market Heist Plan🌟Hi! Hola! Ola! Bonjour! Hallo! Marhaba!🌟
Dear Money Makers & Thieves, 🤑💰💸✈️
Based on 🔥Thief Trading style technical and fundamental analysis🔥, here is our master plan to heist the NZD/CAD "Kiwi vs Loonie" Forex market. Please adhere to the strategy I've outlined in the chart, which emphasizes long entry. Our aim is the high-risk Red Zone. Risky level, overbought market, consolidation, trend reversal, trap at the level where traders and bearish robbers are stronger. 🏆💸Book Profits wealthy and safe trade.💪🏆🎉
Entry 📈 : "The heist is on! Wait for the MA breakout (0.82800) then make your move - Bullish profits await!"
however I advise to Place Buy stop orders above the Moving average (or) Place buy limit orders within a 15 or 30 minute timeframe most recent or swing, low or high level.
📌I strongly advise you to set an alert on your chart so you can see when the breakout entry occurs.
Stop Loss 🛑:
Thief SL placed at the recent/swing low or high level Using the 4H timeframe (0.81800) swing trade basis.
SL is based on your risk of the trade, lot size and how many multiple orders you have to take.
Target 🎯: 0.83700 (or) Escape Before the Target
🧲Scalpers, take note 👀 : only scalp on the Long side. If you have a lot of money, you can go straight away; if not, you can join swing traders and carry out the robbery plan. Use trailing SL to safeguard your money 💰.
NZD/CAD "Kiwi vs Loonie" Forex Market is currently experiencing a Bullish trend., driven by several key factors. 📰🗞️Get & Read the Fundamental, Macro Economics, COT Report, Quantitative Analysis, Intermarket Analysis, Sentimental Outlook, Future Trend Move:
Before start the heist plan read it.👉👉👉
📌Keep in mind that these factors can change rapidly, and it's essential to stay up-to-date with market developments and adjust your analysis accordingly.
⚠️Trading Alert : News Releases and Position Management 📰 🗞️ 🚫🚏
As a reminder, news releases can have a significant impact on market prices and volatility. To minimize potential losses and protect your running positions,
we recommend the following:
Avoid taking new trades during news releases
Use trailing stop-loss orders to protect your running positions and lock in profits
💖Supporting our robbery plan 💥Hit the Boost Button💥 will enable us to effortlessly make and steal money 💰💵. Boost the strength of our robbery team. Every day in this market make money with ease by using the Thief Trading Style.🏆💪🤝❤️🎉🚀
I'll see you soon with another heist plan, so stay tuned 🤑🐱👤🤗🤩

NZD_JPY WILL GO UP|LONG|
✅NZD_JPY has retested a key support level of 85.200
And as the pair is already making a bullish rebound
A move up to retest the supply level above at 86.400 is likely
LONG🚀
✅Like and subscribe to never miss a new idea!✅
Disclosure: I am part of Trade Nation's Influencer program and receive a monthly fee for using their TradingView charts in my analysis.
