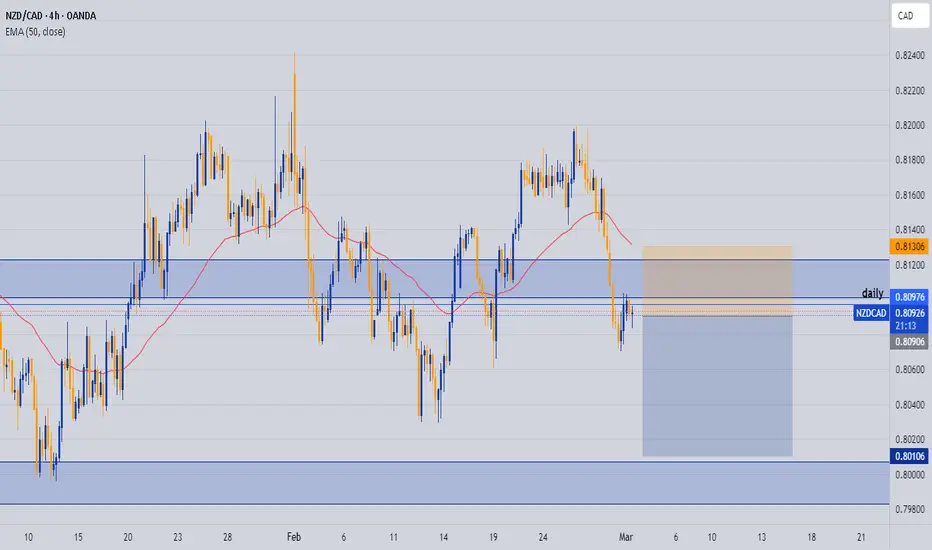
NZDCAD sell setupOANDA:NZDCAD Overall bias on NZDCAD is bearish, entry is based on the 4H bearish engulfing at the Daily AOI around 0.80976
NZD (New Zealand Dollar)
Bearish drop?The Kiwi (NZD/USD) is rising towards the pivot and could drop to the 1st support which is a pullback support.
Pivot: 0.5686
1st Support: 0.5547
1st Resistance: 0.5761
Risk Warning:
Trading Forex and CFDs carries a high level of risk to your capital and you should only trade with money you can afford to lose. Trading Forex and CFDs may not be suitable for all investors, so please ensure that you fully understand the risks involved and seek independent advice if necessary.
Disclaimer:
The above opinions given constitute general market commentary, and do not constitute the opinion or advice of IC Markets or any form of personal or investment advice.
Any opinions, news, research, analyses, prices, other information, or links to third-party sites contained on this website are provided on an "as-is" basis, are intended only to be informative, is not an advice nor a recommendation, nor research, or a record of our trading prices, or an offer of, or solicitation for a transaction in any financial instrument and thus should not be treated as such. The information provided does not involve any specific investment objectives, financial situation and needs of any specific person who may receive it. Please be aware, that past performance is not a reliable indicator of future performance and/or results. Past Performance or Forward-looking scenarios based upon the reasonable beliefs of the third-party provider are not a guarantee of future performance. Actual results may differ materially from those anticipated in forward-looking or past performance statements. IC Markets makes no representation or warranty and assumes no liability as to the accuracy or completeness of the information provided, nor any loss arising from any investment based on a recommendation, forecast or any information supplied by any third-party.

NZDCAD Selling Trading IdeaHello Traders
In This Chart nzdcad HOURLY Forex Forecast By FOREX PLANET
today NZDCAD analysis 👆
🟢This Chart includes_ (NZDCAD market update)
🟢What is The Next Opportunity on NZDCAD Market
🟢how to Enter to the Valid Entry With Assurance Profit
This CHART is For Trader's that Want to Improve Their Technical Analysis Skills and Their Trading By Understanding How To Analyze The Market Using Multiple Timeframes and Understanding The Bigger Picture on the Charts

NZDCHF - Short from bearish OB !!Hello traders!
‼️ This is my perspective on NZDCHF.
Technical analysis: Here we are in a bearish market structure from 4H timeframe perspective, so I look for a short. My point of interest is imbalance filled + rejection from bearish OB.
Like, comment and subscribe to be in touch with my content!

NZDCAD: Bullish Continuation
The price of NZDCAD will most likely increase soon enough, due to the demand beginning to exceed supply which we can see by looking at the chart of the pair.
❤️ Please, support our work with like & comment! ❤️

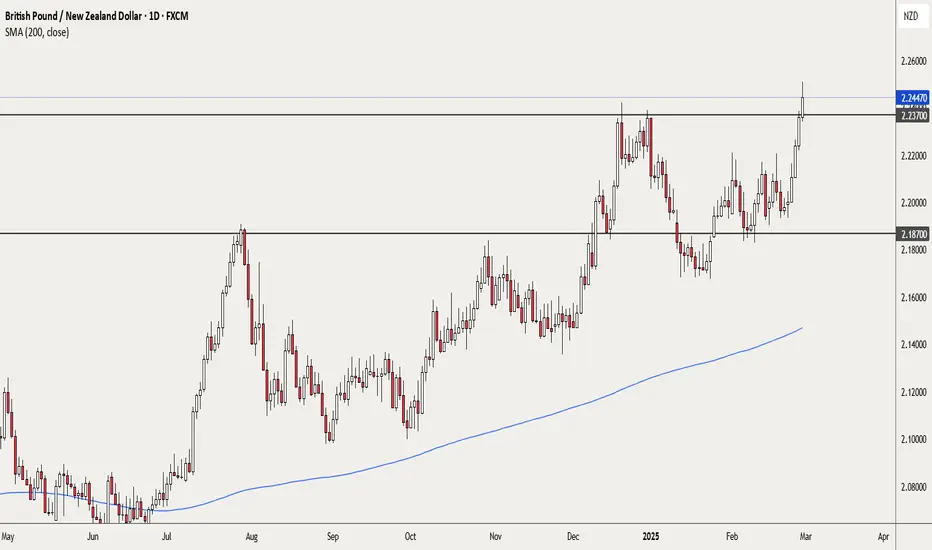
GBPNZD – ready to go long again ... the week of 03 Mar Monthly – bullish
Weekly – bullish
Daily – bullish, broke above previous highs already. Price above 200sma.
H4 – After the break out, price is pulling back. We have no idea where the pullback may terminate, but the support located around 2.2370 or preferably, the zone marked between 2.2212 – 2.21520 (or any other point in between) may hold price.
If there is no further pullback, I will not be interested in trading this pair for now. However, if price action develops as I anticipate, I will be looking for signs of a bullish continuation. My stop would be below the recent swing low and I will at first, target 2.2700 with the potential to extend much higher.
This is not a trade recommendation, merely my own analysis. Trading carries a high level of risk, so only trade with money you can afford to lose and carefully manage your capital and risk. If you like my idea, please give a “boost” and follow me to get even more. Please comment and share your thoughts too!!
It’s not whether you are right or wrong, but how much money you make when you are right and how much you lose when you are wrong – George Soros
NZDCHF Parallel Channel BreakoutNZDCHF breaking the parallel channel in downward direction. We can take entry upon retesting the channel towards sell side.
Manage your risk according to your account size!

NZDJPY: Long Trading Opportunity
NZDJPY
- Classic bullish pattern
- Our team expects retracement
SUGGESTED TRADE:
Swing Trade
Buy NZDJPY
Entry - 84.379
Stop - 83.749
Take - 85.684
Our Risk - 1%
Start protection of your profits from lower levels
❤️ Please, support our work with like & comment! ❤️

NZD/CHF SENDS CLEAR BULLISH SIGNALS|LONG
Hello, Friends!
The BB lower band is nearby so NZD-CHF is in the oversold territory. Thus, despite the downtrend on the 1W timeframe I think that we will see a bullish reaction from the support line below and a move up towards the target at around 0.510.
✅LIKE AND COMMENT MY IDEAS✅

NZD/CAD -H1 Chart - Wedge Breakout (27.02.2025)The NZD/CAD Pair on the H1 timeframe presents a Potential Selling Opportunity due to a recent Formation of a Wedge Breakout Pattern. This suggests a shift in momentum towards the downside in the coming hours.
Possible Short Trade:
Entry: Consider Entering A Short Position around Trendline Of The Pattern.
Target Levels:
1st Support – 0.8101
2nd Support – 0.8068
🎁 Please hit the like button and
🎁 Leave a comment to support for My Post !
Your likes and comments are incredibly motivating and will encourage me to share more analysis with you.
Best Regards, KABHI_TA_TRADING
Thank you.

Bullish bounce off pullback support?NZD/USD is falling towards the support level which is a pullback that is slightly below the 161.8% Fibonacci extension and the 61.8% Fibonacci retracement and could bounce from this level to our take profit.
Entry: 0.5606
Why we like it:
There is a pullback support level that is slightly below the 61.8% Fibonacci retracement and the 161.8% Fibonacci extension.
Stop loss: 0.5567
Why we like it:
There is a pullback support level.
Take profit: 0.5664
Why we like it:
There is a pullback resistance level.
Enjoying your TradingView experience? Review us!
Please be advised that the information presented on TradingView is provided to Vantage (‘Vantage Global Limited’, ‘we’) by a third-party provider (‘Everest Fortune Group’). Please be reminded that you are solely responsible for the trading decisions on your account. There is a very high degree of risk involved in trading. Any information and/or content is intended entirely for research, educational and informational purposes only and does not constitute investment or consultation advice or investment strategy. The information is not tailored to the investment needs of any specific person and therefore does not involve a consideration of any of the investment objectives, financial situation or needs of any viewer that may receive it. Kindly also note that past performance is not a reliable indicator of future results. Actual results may differ materially from those anticipated in forward-looking or past performance statements. We assume no liability as to the accuracy or completeness of any of the information and/or content provided herein and the Company cannot be held responsible for any omission, mistake nor for any loss or damage including without limitation to any loss of profit which may arise from reliance on any information supplied by Everest Fortune Group.

Bearish momentum gaining tractionMarket Analysis:
The current market structure is unfolding with clarity, exhibiting a familiar technical pattern. The price action initiated with a consolidation phase, characteristic of accumulation, followed by a bearish rally to the order block at 0.81400. This rally successfully broke the previous higher high, transitioning into a manipulation phase.
Subsequently, bearish momentum gained traction, reaching the swing low and executing a slight liquidity sweep. The price then marginally rebounded to respect the immediate internal supply zone at 0.81600. A significant rejection occurred at this supply zone, culminating in the clearance of the swing low and resulting in displacement.
Given this shift, the market is anticipated to reverse to the upside, facilitating a liquidity sweep and mitigation of the fair value gap. This final lag of the technique is expected to provide a bearish entry for the distribution phase, targeting the rejection block.
Trade Setup:
- Entry: 0.81700
- Stop Loss: 20 pips at 0.81900
- Target: 100 pips at 0.80700

NZDJPY Will Explode! BUY!
My dear subscribers,
My technical analysis for NZDJPY is below:
The price is coiling around a solid key level - 84.820
Bias - Bullish
Technical Indicators: Pivot Points High anticipates a potential price reversal.
Super trend shows a clear buy, giving a perfect indicators' convergence.
Goal - 85.665
My Stop Loss - 84.404
About Used Indicators:
By the very nature of the supertrend indicator, it offers firm support and resistance levels for traders to enter and exit trades. Additionally, it also provides signals for setting stop losses
———————————
WISH YOU ALL LUCK

NZDCHF The Target Is UP! BUY!
My dear subscribers,
This is my opinion on the NZDCHF next move:
The instrument tests an important psychological level 0.5091
Bias - Bullish
Technical Indicators: Supper Trend gives a precise Bullish signal, while Pivot Point HL predicts price changes and potential reversals in the market.
Target - 0.5121
About Used Indicators:
On the subsequent day, trading above the pivot point is thought to indicate ongoing bullish sentiment, while trading below the pivot point indicates bearish sentiment.
———————————
WISH YOU ALL LUCK

GBP/NZD BEARISH BIAS RIGHT NOW| SHORT
Hello, Friends!
GBP/NZD pair is in the uptrend because previous week’s candle is green, while the price is obviously rising on the 3H timeframe. And after the retest of the resistance line above I believe we will see a move down towards the target below at 2.210 because the pair overbought due to its proximity to the upper BB band and a bearish correction is likely.
✅LIKE AND COMMENT MY IDEAS✅

gbpnzd analysis elliot. Don't forget about stop-loss.
Write in the comments all your questions and instruments analysis of which you want to see.
Friends, push the like button, write a comment, and share with your mates - that would be the best THANK YOU.
P.S. I personally will open entry if the price will show it according to my strategy.
Always make your analysis before a trade

Bullish bounce?AUD/NZD is falling towards the pivot and could bounce to the 1st resistance.
Pivot: 1.10310
1st Support: 1.09910
1st Resistance: 1.10861
Risk Warning:
Trading Forex and CFDs carries a high level of risk to your capital and you should only trade with money you can afford to lose. Trading Forex and CFDs may not be suitable for all investors, so please ensure that you fully understand the risks involved and seek independent advice if necessary.
Disclaimer:
The above opinions given constitute general market commentary, and do not constitute the opinion or advice of IC Markets or any form of personal or investment advice.
Any opinions, news, research, analyses, prices, other information, or links to third-party sites contained on this website are provided on an "as-is" basis, are intended only to be informative, is not an advice nor a recommendation, nor research, or a record of our trading prices, or an offer of, or solicitation for a transaction in any financial instrument and thus should not be treated as such. The information provided does not involve any specific investment objectives, financial situation and needs of any specific person who may receive it. Please be aware, that past performance is not a reliable indicator of future performance and/or results. Past Performance or Forward-looking scenarios based upon the reasonable beliefs of the third-party provider are not a guarantee of future performance. Actual results may differ materially from those anticipated in forward-looking or past performance statements. IC Markets makes no representation or warranty and assumes no liability as to the accuracy or completeness of the information provided, nor any loss arising from any investment based on a recommendation, forecast or any information supplied by any third-party.

Bullish rebound?NZD/CHF is reacting off the pivot and could rise to the 1st resistance.
Pivot: 0.5074
1st Support: 0.5052
1st Resistance: 0.5105
Risk Warning:
Trading Forex and CFDs carries a high level of risk to your capital and you should only trade with money you can afford to lose. Trading Forex and CFDs may not be suitable for all investors, so please ensure that you fully understand the risks involved and seek independent advice if necessary.
Disclaimer:
The above opinions given constitute general market commentary, and do not constitute the opinion or advice of IC Markets or any form of personal or investment advice.
Any opinions, news, research, analyses, prices, other information, or links to third-party sites contained on this website are provided on an "as-is" basis, are intended only to be informative, is not an advice nor a recommendation, nor research, or a record of our trading prices, or an offer of, or solicitation for a transaction in any financial instrument and thus should not be treated as such. The information provided does not involve any specific investment objectives, financial situation and needs of any specific person who may receive it. Please be aware, that past performance is not a reliable indicator of future performance and/or results. Past Performance or Forward-looking scenarios based upon the reasonable beliefs of the third-party provider are not a guarantee of future performance. Actual results may differ materially from those anticipated in forward-looking or past performance statements. IC Markets makes no representation or warranty and assumes no liability as to the accuracy or completeness of the information provided, nor any loss arising from any investment based on a recommendation, forecast or any information supplied by any third-party.

NZDCHF - Looking To Sell Pullbacks In The Short TermH1 - Bearish trend pattern
Currently it looks like a pullback is happening
Until the strong resistance zone holds I expect the price to move lower further after pullbacks.

GBPNZD Is Bearish! Short!
Here is our detailed technical review for GBPNZD.
Time Frame: 2h
Current Trend: Bearish
Sentiment: Overbought (based on 7-period RSI)
Forecast: Bearish
The market is approaching a significant resistance area 2.217.
Due to the fact that we see a positive bearish reaction from the underlined area, I strongly believe that sellers will manage to push the price all the way down to 2.209 level.
P.S
Please, note that an oversold/overbought condition can last for a long time, and therefore being oversold/overbought doesn't mean a price rally will come soon, or at all.
Like and subscribe and comment my ideas if you enjoy them!

Bearish drop?NZD/JPY is rising towards the pivot and could drop to the 1st support.
Pivot: 86.09
1st Support: 85.23
1st Resistance: 86.65
Risk Warning:
Trading Forex and CFDs carries a high level of risk to your capital and you should only trade with money you can afford to lose. Trading Forex and CFDs may not be suitable for all investors, so please ensure that you fully understand the risks involved and seek independent advice if necessary.
Disclaimer:
The above opinions given constitute general market commentary, and do not constitute the opinion or advice of IC Markets or any form of personal or investment advice.
Any opinions, news, research, analyses, prices, other information, or links to third-party sites contained on this website are provided on an "as-is" basis, are intended only to be informative, is not an advice nor a recommendation, nor research, or a record of our trading prices, or an offer of, or solicitation for a transaction in any financial instrument and thus should not be treated as such. The information provided does not involve any specific investment objectives, financial situation and needs of any specific person who may receive it. Please be aware, that past performance is not a reliable indicator of future performance and/or results. Past Performance or Forward-looking scenarios based upon the reasonable beliefs of the third-party provider are not a guarantee of future performance. Actual results may differ materially from those anticipated in forward-looking or past performance statements. IC Markets makes no representation or warranty and assumes no liability as to the accuracy or completeness of the information provided, nor any loss arising from any investment based on a recommendation, forecast or any information supplied by any third-party.

Potential bullish rise?NZD/CHF is reacting off the pivot and could rise to the 1st resistance level.
Pivot: 0.5093
1st Support: 0.5060
1st Resistance: 0.5135
Risk Warning:
Trading Forex and CFDs carries a high level of risk to your capital and you should only trade with money you can afford to lose. Trading Forex and CFDs may not be suitable for all investors, so please ensure that you fully understand the risks involved and seek independent advice if necessary.
Disclaimer:
The above opinions given constitute general market commentary, and do not constitute the opinion or advice of IC Markets or any form of personal or investment advice.
Any opinions, news, research, analyses, prices, other information, or links to third-party sites contained on this website are provided on an "as-is" basis, are intended only to be informative, is not an advice nor a recommendation, nor research, or a record of our trading prices, or an offer of, or solicitation for a transaction in any financial instrument and thus should not be treated as such. The information provided does not involve any specific investment objectives, financial situation and needs of any specific person who may receive it. Please be aware, that past performance is not a reliable indicator of future performance and/or results. Past Performance or Forward-looking scenarios based upon the reasonable beliefs of the third-party provider are not a guarantee of future performance. Actual results may differ materially from those anticipated in forward-looking or past performance statements. IC Markets makes no representation or warranty and assumes no liability as to the accuracy or completeness of the information provided, nor any loss arising from any investment based on a recommendation, forecast or any information supplied by any third-party.

Falling towards overlap support?NZD/USD is falling towards the support level which is an overlap support that aligns with the 50% Fibonacci retracement and could bounce from this level to our take profit.
Entry: 0.5692
Why we like it:
There is an overlap support level that aligns with the 50% Fibonacci retracement.
Stop loss: 0.5664
Why we like it:
There is a pullback support level that lines up with the 61.8% Fibonacci retracement.
Take profit: 0.5745
Why we like it:
There is a pullback resistance level.
Enjoying your TradingView experience? Review us!
Please be advised that the information presented on TradingView is provided to Vantage (‘Vantage Global Limited’, ‘we’) by a third-party provider (‘Everest Fortune Group’). Please be reminded that you are solely responsible for the trading decisions on your account. There is a very high degree of risk involved in trading. Any information and/or content is intended entirely for research, educational and informational purposes only and does not constitute investment or consultation advice or investment strategy. The information is not tailored to the investment needs of any specific person and therefore does not involve a consideration of any of the investment objectives, financial situation or needs of any viewer that may receive it. Kindly also note that past performance is not a reliable indicator of future results. Actual results may differ materially from those anticipated in forward-looking or past performance statements. We assume no liability as to the accuracy or completeness of any of the information and/or content provided herein and the Company cannot be held responsible for any omission, mistake nor for any loss or damage including without limitation to any loss of profit which may arise from reliance on any information supplied by Everest Fortune Group.
