NZDJPY to continue in the upward move?NZDJPY - 24h expiry
The primary trend remains bullish.
The selloff has posted an exhaustion count on the intraday chart.
Preferred trade is to buy on dips.
Risk/Reward would be poor to call a buy from current levels.
Bespoke support is located at 87.30.
We look to Buy at 87.30 (stop at 87.10)
Our profit targets will be 88.00 and 88.20
Resistance: 87.80 / 88.00 / 88.20
Support: 87.20 / 87.00 / 86.80
Risk Disclaimer
The trade ideas beyond this page are for informational purposes only and do not constitute investment advice or a solicitation to trade. This information is provided by Signal Centre, a third-party unaffiliated with OANDA, and is intended for general circulation only. OANDA does not guarantee the accuracy of this information and assumes no responsibilities for the information provided by the third party. The information does not take into account the specific investment objectives, financial situation, or particular needs of any particular person. You should take into account your specific investment objectives, financial situation, and particular needs before making a commitment to trade, including seeking advice from an independent financial adviser regarding the suitability of the investment, under a separate engagement, as you deem fit.
You accept that you assume all risks in independently viewing the contents and selecting a chosen strategy.
Where the research is distributed in Singapore to a person who is not an Accredited Investor, Expert Investor or an Institutional Investor, Oanda Asia Pacific Pte Ltd (“OAP“) accepts legal responsibility for the contents of the report to such persons only to the extent required by law. Singapore customers should contact OAP at 6579 8289 for matters arising from, or in connection with, the information/research distributed.
NZD (New Zealand Dollar)

NZDJPY BUYBy utilizing Fibonacci retracement levels, historical patterns, , we can formulate a hypothesis that the market might follow a similar trajectory if bullish sentiment prevails.

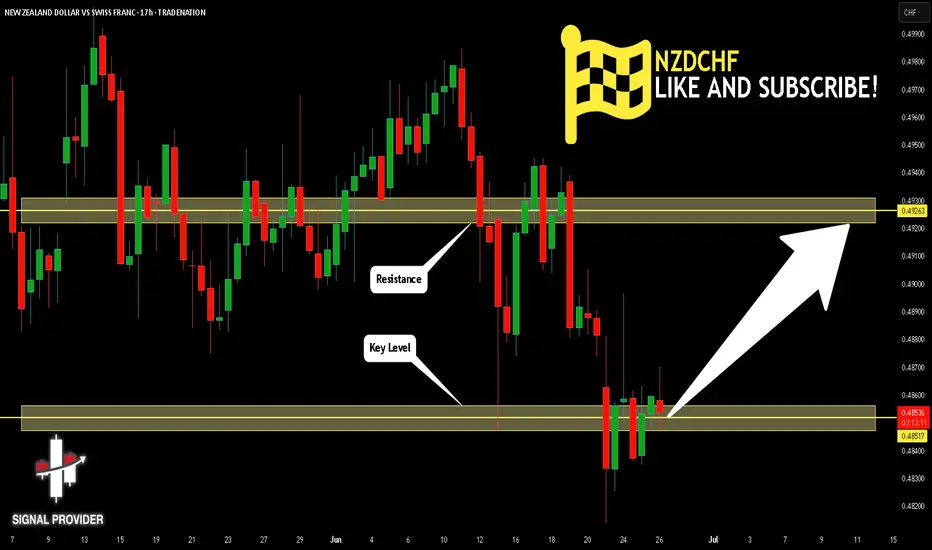
NZDCHF Is Very Bullish! Buy!
Take a look at our analysis for NZDCF
Time Frame: 17h
Current Trend: Bullish
Sentiment: Oversold (based on 7-period RSI)
Forecast: Bullish
The market is testing a major horizontal structure 0.485.
Taking into consideration the structure & trend analysis, I believe that the market will reach 0.492 level soon.
P.S
The term oversold refers to a condition where an asset has traded lower in price and has the potential for a price bounce.
Overbought refers to market scenarios where the instrument is traded considerably higher than its fair value. Overvaluation is caused by market sentiments when there is positive news.
Disclosure: I am part of Trade Nation's Influencer program and receive a monthly fee for using their TradingView charts in my analysis.
Like and subscribe and comment my ideas if you enjoy them!
Potential bullish rise?EUR/NZD has bounced off the support level which is a pullback support that aligns with the 38.2% Fibonacci retracement and could rise from this level to our take profit.
Entry: 1.92267
Why we like it:
There is a pullback support level that lines up with the 38.2% Fibonacci retracement.
Stop loss: 1.91362
Why we like it:
There is a pullback support level that lines up with the 50% Fibonacci retracement.
Take profit: 1.94477
Why we like it:
There is a pullback resistance level.
Enjoying your TradingView experience? Review us!
Please be advised that the information presented on TradingView is provided to Vantage (‘Vantage Global Limited’, ‘we’) by a third-party provider (‘Everest Fortune Group’). Please be reminded that you are solely responsible for the trading decisions on your account. There is a very high degree of risk involved in trading. Any information and/or content is intended entirely for research, educational and informational purposes only and does not constitute investment or consultation advice or investment strategy. The information is not tailored to the investment needs of any specific person and therefore does not involve a consideration of any of the investment objectives, financial situation or needs of any viewer that may receive it. Kindly also note that past performance is not a reliable indicator of future results. Actual results may differ materially from those anticipated in forward-looking or past performance statements. We assume no liability as to the accuracy or completeness of any of the information and/or content provided herein and the Company cannot be held responsible for any omission, mistake nor for any loss or damage including without limitation to any loss of profit which may arise from reliance on any information supplied by Everest Fortune Group.

Bullish bounce?NZD/JPY is falling towards the support level which is a pullback support that lines up with the 23.6% Fibonacci retracement and could bounce from this level to our take profit.
Entry: 87.562
Why we like it:
There is a pullback support level that aligns with the 23.6% Fibonacci retracement.
Stop loss: 87.34
Why we like it:
There is a pullback support that aligns with the 50% Fibonacci retracement.
Take profit: 87.98
Why we like it:
There is a pullback resistance level that lines up with the 145% Fibonacci extension.
Enjoying your TradingView experience? Review us!
Please be advised that the information presented on TradingView is provided to Vantage (‘Vantage Global Limited’, ‘we’) by a third-party provider (‘Everest Fortune Group’). Please be reminded that you are solely responsible for the trading decisions on your account. There is a very high degree of risk involved in trading. Any information and/or content is intended entirely for research, educational and informational purposes only and does not constitute investment or consultation advice or investment strategy. The information is not tailored to the investment needs of any specific person and therefore does not involve a consideration of any of the investment objectives, financial situation or needs of any viewer that may receive it. Kindly also note that past performance is not a reliable indicator of future results. Actual results may differ materially from those anticipated in forward-looking or past performance statements. We assume no liability as to the accuracy or completeness of any of the information and/or content provided herein and the Company cannot be held responsible for any omission, mistake nor for any loss or damage including without limitation to any loss of profit which may arise from reliance on any information supplied by Everest Fortune Group.

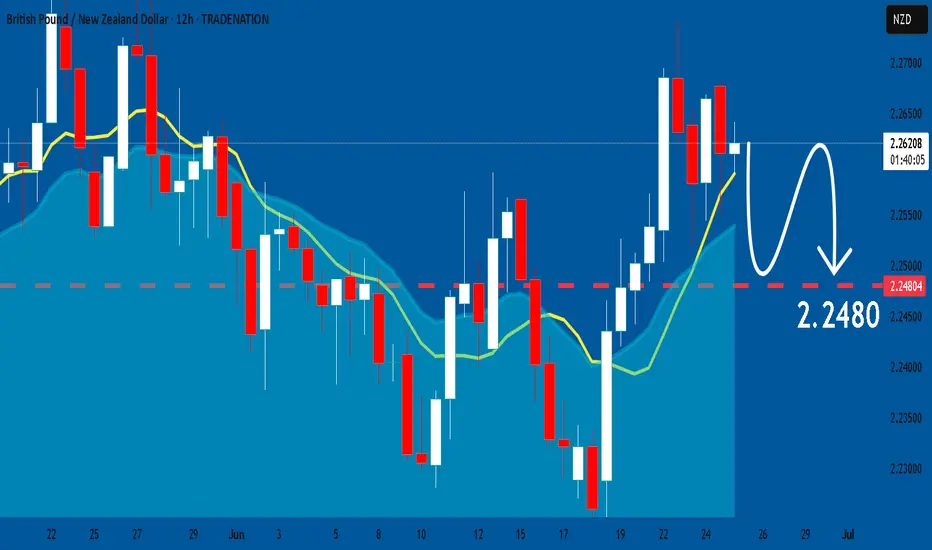
GBPNZD: Forecast & Trading Plan
The price of GBPNZD will most likely collapse soon enough, due to the supply beginning to exceed demand which we can see by looking at the chart of the pair.
Disclosure: I am part of Trade Nation's Influencer program and receive a monthly fee for using their TradingView charts in my analysis.
❤️ Please, support our work with like & comment! ❤️
NZDJPY Buyers In Panic! SELL!
My dear subscribers,
My technical analysis for NZDJPY is below:
The price is coiling around a solid key level - 87.737
Bias - Bearish
Technical Indicators: Pivot Points Low anticipates a potential price reversal.
Super trend shows a clear sell, giving a perfect indicators' convergence.
Goal - 87.205
My Stop Loss - 87.976
About Used Indicators:
By the very nature of the supertrend indicator, it offers firm support and resistance levels for traders to enter and exit trades. Additionally, it also provides signals for setting stop losses
Disclosure: I am part of Trade Nation's Influencer program and receive a monthly fee for using their TradingView charts in my analysis.
———————————
WISH YOU ALL LUCK

NZD/CHF SENDS CLEAR BULLISH SIGNALS|LONG
Hello, Friends!
NZD/CHF pair is trading in a local downtrend which we know by looking at the previous 1W candle which is red. On the 1D timeframe the pair is going down too. The pair is oversold because the price is close to the lower band of the BB indicator. So we are looking to buy the pair with the lower BB line acting as support. The next target is 0.496 area.
Disclosure: I am part of Trade Nation's Influencer program and receive a monthly fee for using their TradingView charts in my analysis.
✅LIKE AND COMMENT MY IDEAS✅

AUDJPY DETAILED ANALYSISAUDJPY has successfully completed a breakout from a bullish pennant structure on the 4H timeframe, signaling the beginning of a strong upward continuation move. After a sustained consolidation below descending resistance, price action has now pierced through the upper trendline with volume and follow-through momentum. The breakout is aligned with the prior bullish leg from mid-June, indicating trend continuation. I’m now targeting 96.500 as the next key price level, with current price holding firm at 94.500.
Fundamentally, the Australian Dollar remains supported by recent hawkish RBA expectations. Traders are now pricing in the possibility of another rate hike following sticky inflation data out of Australia. The latest CPI print showed an annualized rise above 4%, exceeding forecasts, and reinforcing the case for tighter monetary policy. In contrast, the Japanese Yen continues to weaken as the Bank of Japan maintains its dovish tone, with no immediate signs of rate normalization. The ongoing yield divergence continues to fuel bullish flows into AUDJPY.
Today’s market sentiment favors risk-on assets, and AUD typically benefits in such conditions. Global equity strength and higher commodity prices are further backing AUD's upside momentum. Moreover, with carry trade flows increasing as investors seek higher-yielding currencies, AUDJPY is well-positioned to benefit from both fundamental tailwinds and technical breakout confirmation.
This setup is technically clean and fundamentally strong. Pullbacks toward the 94.100–93.900 zone could be retested as new support before the pair extends higher. As long as price holds above the breakout level, I remain bullish with 96.500 as my primary upside target. This pair is offering a high-probability continuation play in alignment with both macro and micro structure.

NZD_CAD SHORT FROM RESISTANCE|
✅NZD_CAD will soon retest a key resistance level of 0.8320
So I think that the pair will make a pullback
And go down to retest the demand level below at 0.8267
SHORT🔥
✅Like and subscribe to never miss a new idea!✅
Disclosure: I am part of Trade Nation's Influencer program and receive a monthly fee for using their TradingView charts in my analysis.

Bearish reversal off pullback resistance?NZD/USD is reacting off the reistance level which is a pullback resistance that lines up with the 127.2% Fibonacci extension and the 78.6% Fibonacci retracement and could drop from this level to our take profit.
Entry: 0.6039
Why we like it:
There is a pullback resistance level that lines up with the 78.6% Fibonacci retracement and the 127.2% Fibonacci extension.
Stop loss: 0.6060
Why we like it:
There is a pullback resistance level that is slightly below the 161.8% Fibonacci extension.
Take profit: 0.5966
Why we like it:
There is a pullback support that lines up with the 50% Fibonacci retracement.
Enjoying your TradingView experience? Review us!
Please be advised that the information presented on TradingView is provided to Vantage (‘Vantage Global Limited’, ‘we’) by a third-party provider (‘Everest Fortune Group’). Please be reminded that you are solely responsible for the trading decisions on your account. There is a very high degree of risk involved in trading. Any information and/or content is intended entirely for research, educational and informational purposes only and does not constitute investment or consultation advice or investment strategy. The information is not tailored to the investment needs of any specific person and therefore does not involve a consideration of any of the investment objectives, financial situation or needs of any viewer that may receive it. Kindly also note that past performance is not a reliable indicator of future results. Actual results may differ materially from those anticipated in forward-looking or past performance statements. We assume no liability as to the accuracy or completeness of any of the information and/or content provided herein and the Company cannot be held responsible for any omission, mistake nor for any loss or damage including without limitation to any loss of profit which may arise from reliance on any information supplied by Everest Fortune Group.

NZD/CAD BEARISH BIAS RIGHT NOW| SHORT
NZD/CAD SIGNAL
Trade Direction: short
Entry Level: 0.827
Target Level: 0.818
Stop Loss: 0.832
RISK PROFILE
Risk level: medium
Suggested risk: 1%
Timeframe: 2h
Disclosure: I am part of Trade Nation's Influencer program and receive a monthly fee for using their TradingView charts in my analysis.
✅LIKE AND COMMENT MY IDEAS✅

GBPAUD XABCD Short from PRZ/D TP1/TP2 Swing Trade🔸Hello traders, let's review the 20 MINUTE chart for GBPAUD. Strong gains off the lows recently, however price getting overextended and expecting reversal later at/near PRZ/D.
🔸Speculative XABCD structure defined by point X 1000 point A 0700 point B 0930 point C 0640 point D/PRZ 1080 still pending.
🔸Currently most points validated, point D/PRZ still pending 1080, so traders should wait until we hit D before SHORTING.
🔸Recommended strategy for GA traders: wait for price to max out to complete at point D near 1080, short/hold, SL 80 pips, TP1/TP2/TP3 0940/0840/0780. SHORT/HOLD at point D/PRZ at 1080 swing trade setup. keep in mind this is a swing trade setup, patience required.
🎁Please hit the like button and
🎁Leave a comment to support our team!
RISK DISCLAIMER:
Trading Futures , Forex, CFDs and Stocks involves a risk of loss.
Please consider carefully if such trading is appropriate for you.
Past performance is not indicative of future results.
Always limit your leverage and use tight stop loss.

NZD/JPY - Triangle Breakout (23.06.2025)The NZD/JPY Pair on the H1 timeframe presents a Potential Selling Opportunity due to a recent Formation of a Triangle Breakout Pattern. This suggests a shift in momentum towards the downside in the coming hours.
Possible Short Trade:
Entry: Consider Entering A Short Position around Trendline Of The Pattern.
Target Levels:
1st Support – 86.35
2nd Support – 86.00
🎁 Please hit the like button and
🎁 Leave a comment to support for My Post !
Your likes and comments are incredibly motivating and will encourage me to share more analysis with you.
Best Regards, KABHI_TA_TRADING
Thank you.
Disclosure: I am part of Trade Nation's Influencer program and receive a monthly fee for using their TradingView charts in my analysis.

GBP-NZD Long From Demand Ahead! Buy!
Hello,Traders!
GBP-NZD is making a bearish
Correction but will soon
Retest a wide demand area
Around 2.2539 from where
We will be expecting a
Local rebound a move up
Buy!
Comment and subscribe to help us grow!
Check out other forecasts below too!
Disclosure: I am part of Trade Nation's Influencer program and receive a monthly fee for using their TradingView charts in my analysis.

Heading into overlap resistance?The Kiwi (NZD/USD) is rising towards the pivot which has been identified as an overlap resistance that aligns with the 61.8% Fibonacci retracement and could reverse to the 1st support which is a pullback support.
Pivot: 0.6009
1st Support: 0.5940
1st Resistance: 0.6044
Risk Warning:
Trading Forex and CFDs carries a high level of risk to your capital and you should only trade with money you can afford to lose. Trading Forex and CFDs may not be suitable for all investors, so please ensure that you fully understand the risks involved and seek independent advice if necessary.
Disclaimer:
The above opinions given constitute general market commentary, and do not constitute the opinion or advice of IC Markets or any form of personal or investment advice.
Any opinions, news, research, analyses, prices, other information, or links to third-party sites contained on this website are provided on an "as-is" basis, are intended only to be informative, is not an advice nor a recommendation, nor research, or a record of our trading prices, or an offer of, or solicitation for a transaction in any financial instrument and thus should not be treated as such. The information provided does not involve any specific investment objectives, financial situation and needs of any specific person who may receive it. Please be aware, that past performance is not a reliable indicator of future performance and/or results. Past Performance or Forward-looking scenarios based upon the reasonable beliefs of the third-party provider are not a guarantee of future performance. Actual results may differ materially from those anticipated in forward-looking or past performance statements. IC Markets makes no representation or warranty and assumes no liability as to the accuracy or completeness of the information provided, nor any loss arising from any investment based on a recommendation, forecast or any information supplied by any third-party.

NZDUSD to find sellers at market price?NZDUSD - 24h expiry
Price action looks to be forming a top.
Further downside is expected.
Risk/Reward is ample to call a sell from current levels.
A move through 0.5910 will confirm the bearish momentum.
The measured move target is 0.5875.
We look to Sell at 0.5975 (stop at 0.6005)
Our profit targets will be 0.5900 and 0.5875
Resistance: 0.5950 / 0.5960 / 0.5975
Support: 0.5910 / 0.5900 / 0.5875
Risk Disclaimer
The trade ideas beyond this page are for informational purposes only and do not constitute investment advice or a solicitation to trade. This information is provided by Signal Centre, a third-party unaffiliated with OANDA, and is intended for general circulation only. OANDA does not guarantee the accuracy of this information and assumes no responsibilities for the information provided by the third party. The information does not take into account the specific investment objectives, financial situation, or particular needs of any particular person. You should take into account your specific investment objectives, financial situation, and particular needs before making a commitment to trade, including seeking advice from an independent financial adviser regarding the suitability of the investment, under a separate engagement, as you deem fit.
You accept that you assume all risks in independently viewing the contents and selecting a chosen strategy.
Where the research is distributed in Singapore to a person who is not an Accredited Investor, Expert Investor or an Institutional Investor, Oanda Asia Pacific Pte Ltd (“OAP“) accepts legal responsibility for the contents of the report to such persons only to the extent required by law. Singapore customers should contact OAP at 6579 8289 for matters arising from, or in connection with, the information/research distributed.

NZD/JPY BEARS WILL DOMINATE THE MARKET|SHORT
NZD/JPY SIGNAL
Trade Direction: short
Entry Level: 87.077
Target Level: 84.490
Stop Loss: 88.805
RISK PROFILE
Risk level: medium
Suggested risk: 1%
Timeframe: 1D
Disclosure: I am part of Trade Nation's Influencer program and receive a monthly fee for using their TradingView charts in my analysis.
✅LIKE AND COMMENT MY IDEAS✅

NZDCHF Analysis – “Kiwi Faces Uphill Battle Against Safe-Haven FNZDCHF Price has formed a bearish pennant / triangle after a strong drop from the highs around 0.4960.
Rejection seen from the trendline resistance at ~0.4900, suggesting limited bullish momentum.
Bearish targets are mapped to:
0.4847 (first support)
0.4819 (deeper bearish target)
Two bearish scenarios drawn, both suggesting downside pressure is likely if support breaks.
Structure Bias: Bearish as long as below ~0.4905
📊 Current Bias: Bearish
🧩 Key Fundamentals Driving NZDCHF
NZD Side (Mixed to Weak):
RBNZ held rates at 5.50%, but no additional hawkish surprises. Kiwi is underperforming against safe-havens despite resilience.
Mixed Chinese influence: Some recent recovery in China’s retail/consumption data (e.g., 618 festival) but not strong enough to fuel Kiwi strength.
Risk sentiment: Global geopolitical tensions (Israel-Iran, Ukraine) are pressuring high-beta currencies like NZD.
CHF Side (Strengthening):
Swiss Franc bid on risk-off: CHF is strengthening as a safe-haven due to escalating geopolitical concerns and volatile global markets.
SNB not cutting yet: Recent SNB assessment indicates gradual, patient stance. The central bank may ease later in 2025, but no urgency.
European proximity flows: CHF benefits from proximity to EU and low volatility in domestic economy.
⚠️ Risks That May Reverse the Trend
Surprise RBNZ hawkish speech or inflation spike
Risk-on reversal boosting NZD
Unexpected SNB rate cut or dovish surprise
🗓️ Key News to Watch
🇳🇿 NZ Trade Balance and inflation expectations
🇨🇭 Swiss inflation data and SNB commentary
Global sentiment drivers: Middle East headlines, equity volatility
🏁 Which Asset May Lead?
NZDCHF may lag behind NZDJPY or AUDCHF in volatility but offers a cleaner risk-off signal. If CHF strength and Kiwi weakness persist, this pair can trend with limited noise.

NZD-CHF Rebound Ahead! Buy!
Hello,Traders!
NZD-CHF made a retest
Of the horizontal support
Level of 0.4847 from where
We are already seeing a
Bullish rebound so we are
Locally bullish biased and
We will be expecting a
Further bullish move up
Buy!
Comment and subscribe to help us grow!
Check out other forecasts below too!
Disclosure: I am part of Trade Nation's Influencer program and receive a monthly fee for using their TradingView charts in my analysis.

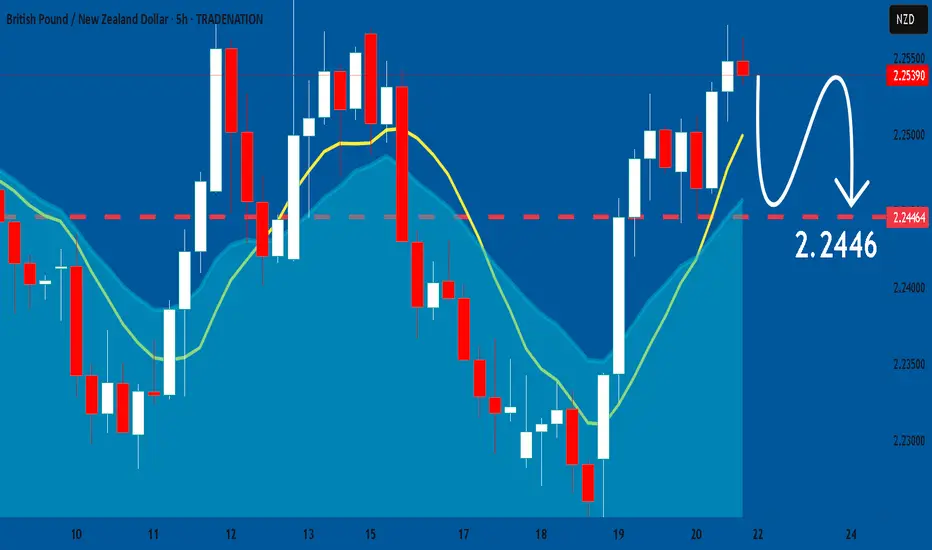
GBPNZD: Market Sentiment & Forecast
Looking at the chart of GBPNZD right now we are seeing some interesting price action on the lower timeframes. Thus a local move down seems to be quite likely.
Disclosure: I am part of Trade Nation's Influencer program and receive a monthly fee for using their TradingView charts in my analysis.
❤️ Please, support our work with like & comment! ❤️
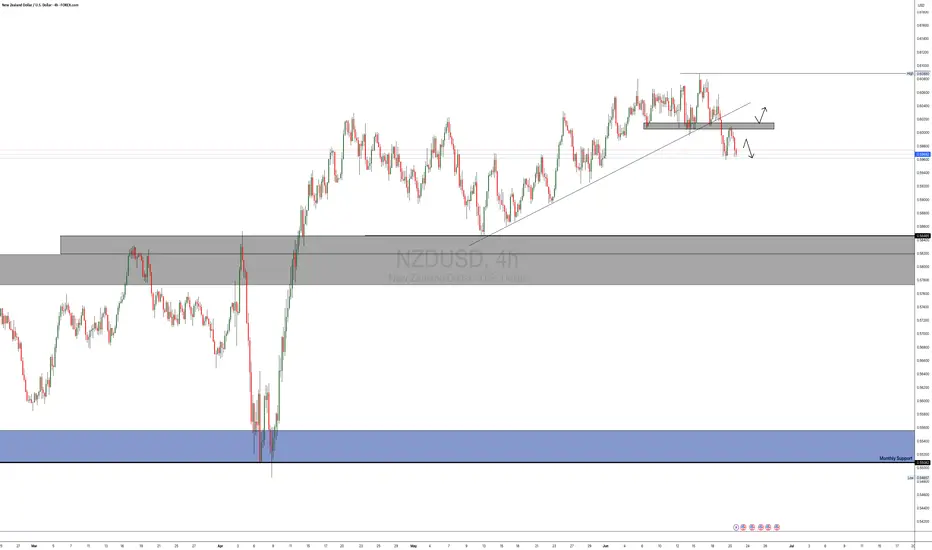
NZDUSD POSSIBLE TRADE SETUPPotential Trade Setup on NZDUSD
NZDUSD is on a strong 3-week rally correction that almost got broken to the downside last week and successfully retested on Friday
That said, I am still quite anticipating for a possible continuation of the bearish trajectory that started last week to continue towards the MAY low at 0.5880
Trading Plan:
1. SELL: is currently in play, and a further downside movement can be well followed through in the 4H chart.
2. BUY: if the resistance is broken and the retest is successful.
Targets:
1. Can be 1:2 for either entry.
GBP_NZD RISKY SHORT|
✅GBP_NZD is going up now
But a strong resistance level is ahead at 2.2591
Thus I am expecting a pullback
And a move down towards the target of 2.2524
SHORT🔥
✅Like and subscribe to never miss a new idea!✅
Disclosure: I am part of Trade Nation's Influencer program and receive a monthly fee for using their TradingView charts in my analysis.
