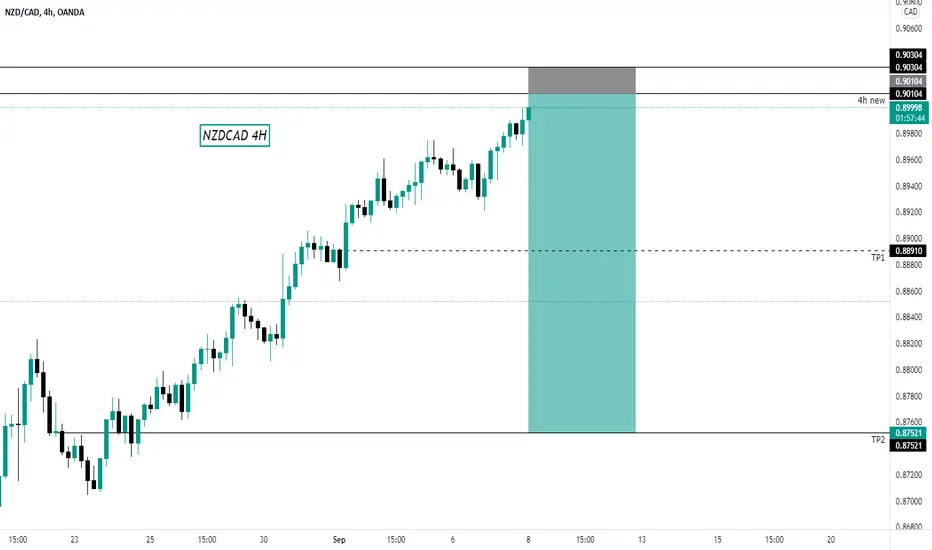
NZDCAD Bearish Idea (H4 Timeframe)CAD seem to gather some strength today, as far as NZDCAD goes any price close below 0.8990 is going to be a clear indication of bearish movement!
NZDCADANALYSIS

NZDCAD: SELL SIGNAL ENTRYLooking for 40-60 PIPS Opportunity
do your own risk.
If you like this idea, Give thumbs up and leave comment below
Appreciate it!!!

NZDCAD { WITH SNIPER ENTRY}Starting from the daily the price has broken the structure to the downside meaning we are bearish ,
NZDCAD SHORT STOP 0.88975don't trade before SELL stop, if you get 20 to 30 pips kindly close, its good for investment 2% risks.
if you wanna more pips fully risks for yours.
we are only try to hit baby pips if you like this analysis, please support our idea by hitting the like button and share to your frnz. we will support start to end trading
have a great trading!

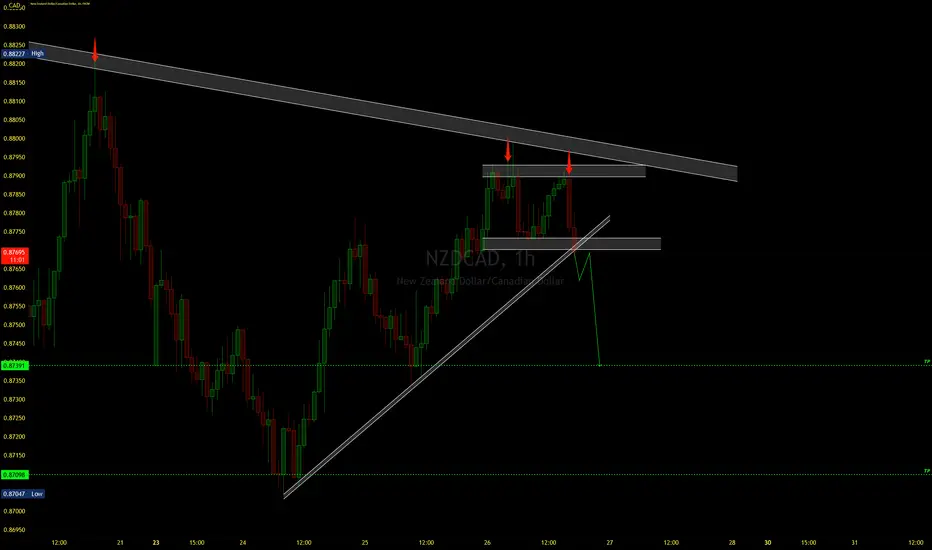
Short NZDCAD NZDCAD after touching Weekly and daily resistance is moving down , once TL and support is broken to the downside we can go short on the retest with the Stop loss previous high and take profit as indicated for good risk reward

NZDCAD Looking For A Buy IdeaIn this we are looking at the Bat Pattern Harmonic as you can see we watching the trend up
Now we wait for the pull back into the logical area ready to push up from the logical area and its also a nice 50% area of this Bat pattern B area looking left
see how we have HL trend forming beautifully on its way up to the D point this is where we wait for the pull back you possibly could sell from this area but im waiting for the pattern 50% retrace then take it on the up to continue trend
What is your thoughts........?

NZDCAD SELL This pair has been on this range since the start of July and now we are looking to once more test it’s resistance, the resistance between 0.88600 and 0.88800 its pretty strong and as soon as we have a candle try and break the resistance but close back inside we can short it for a good trade, we can look for 180 pips. If the 4hr candle does close above the resistance we don’t enter a trade since it might run for the upside, in that situation of a close above resistance we might want to test a sell stop at 0.88500.


NZDCAD [H4] Price is still Swing H/L Sideway 🔥🔥NZDCAD Price is still Swing H/L Sideway, so think when price goes up to test resistance.
will have a comeback Resistance is about 0.886 - 0.888.
When the price touches this zone, it is recommended to sell in that area.
SL above resistance
Goodluck Trader
TonTrader | TamjaiTrader
😎😎😎😎😎😎


💡 NZD/CAD potential short opportunityHi traders. This pair is looking bearish, It has respected the downtrend and created a double top. If we can break below i'll be waiting for a retest of the structure to go short.
NZDCAD HANDLE AND CUP PATTERNhandle and cup, just wait until the handle pattern form perfectly before decide which direction the market go

NZDCAD Hello Friends, I am looking for great long opportunity in this pair. As price has broken Descending wedge and started bullish corrections in range. I will be looking for structure areas where I will wait for rejections or Will wait for breakout and retest. Range structure levels are both in long favor we just need to see confirmations for good risk to reward ratio.

NZD / JPYIf you reach our support range, be ready to buy
The price has reached the bottom of the channel

NZDCAD H1 PROJECTIONReason:
Potential sell setup in the H1 bearish order block or from the 50% of imbalance if it fills.

Wait for confirm and buy signal with NZDCADH1 time frame.
Structure: Break downtrend.
Break Key level and downtrend - retracement.
Wait for retest at Key level 0.88000 and buy signal.
Target is next resistance at 0.88800.
-----------------------------------------------------------------------------------------------
Wish you all have a good trading day!

NZDCAD TO CONTINUE WITH THE BULLSAs we have seen, price has broken above this key level with bullish pressure.
We also see a break outside the corrective downtrend.
We could see further upside on NZDCAD after a pullback.
We'll be watching for early retracements, pullbacks at key levels, any trend continuation techniques to get us in.

NZDCAD TO KEEP PUSHING LOWER?Since the deep fall from the level of 0.88700, we have seen price continue to create lower lows and lower highs to continue the downtrend.
We just recently broke below a support level at 0.87800. Until we see a break above, we remain bearish and will look for sell opportunities.
If we find a break above then we could switch out bias from bearish to bullish. New targets on this sell would be a new low along the trend.

NZDCAD Sell Zones right now price is in the down trend and we are looking to get in to sell position first zone is our first entry and stoploss of that will be end of the zone if it hits our SL we will open another sell position at next zone with stoploss of 5 pips above the zone and both of the TP would be the zone down below

NZDCAD LONG Price making nice FLAG pattern & trying to brake upper trend line . entry will place after retest.

NZDCAD ANALYSISWe have this pair following our last update and continuing to move down.
We expect a fall to 0.87800 and a bounce from that level to the upside.
If price gets to 0.87800, it would be regarded a higher low on the 4-hour and daily timeframe.
We could see the bounce from there. As for now, we remain patient, riding with the current profit on this pair.

NZDCAD ANALYSISAfter the bullish rally on this pair, we see price reacting to and rejecting the key level of 0.88700.
We could see some short term retracements before any bullish rally would continue.
We would look for short term sells on the lower timeframes once the opportunity presents itself.

nzdcad sellnzdcad sell :
Reasons :
1)there is a nice pattern trend formed in 1h,4h,1d timeframes
2)a bullish pin candle is formed as marked in the previous days which indicates perfect entry for sell
3)bearish naked candle confirmation in 1h,4h time frames
take profit : green line
stop loss : red line
wait for my confirmation to place trade
