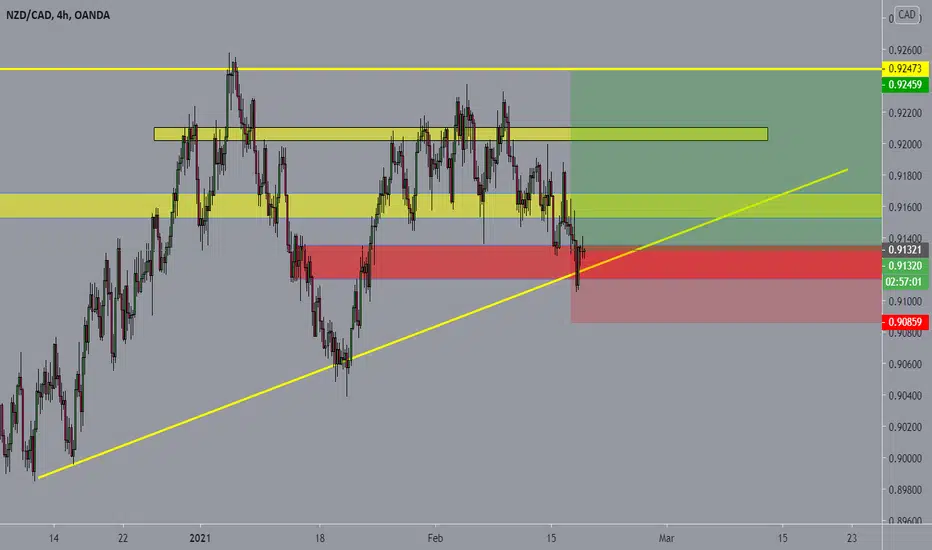
NZD/CAD buyPrice is in a strong support level, keep stop loss below the support structure around 0.8960
iDEA of THE FOREX TRADER CLUB (TFT_CLUB)
NZDCADANALYSIS

NZD/CAD New Entry To Catch More Than 90 PipsThis is an educational + analytic content that will teach why and how to enter a trade
Make sure you watch the price action closely in each analysis as this is a very important part of our method
Disclaimer : this analysis can change at anytime without notice and it is only for the purpose of assisting traders to make independent investments decisions

Bearish Pattern on NZD/CADAs I've shown on the chart, two bearish pattern are happened: 1) Head and Shoulders 2) Inverse Cup and Handle
H4, Daily and Weekly charts all are suggesting bearish movement.


NZDCAD Potential upside moveWe expect NZDCAD to move to the upside , we see the shortening of the thrusts , Rejection and slow down in the FIB level

NZDCAD BUYThis is NZDCAD 1H time frame analysis, i'm expecting a buy on this very pair based on the signal confluences that i saw o n this very pair.

NZDCAD long trade idea (update!)Plan: resistance level breakout --> wait for the price to bounce off from support level --> wait for the rejection candle pattern to form e.g. bullish engulfing, pinbar, etc --> BUY
**Disclaimer** the content on this analysis is subject to change at any time without notice, and is provided for the sole purpose of assisting traders to make independent investment decisions.
Traders!! if you like my ideas and do take the same trade as I do, please write it in a comment so we can manage the trade together.
_____________________________________________________________________________________________________________________
Thank you for your support ;)
GWBFX

NZDCAD short trade ideaPlan: wait for the price to bounce off from resistance level --> wait for the rejection candle pattern to form e.g. bearish engulfing, pinbar, etc --> SELL
**Disclaimer** the content on this analysis is subject to change at any time without notice, and is provided for the sole purpose of assisting traders to make independent investment decisions.
Traders!! if you like my ideas and do take the same trade as I do, please write it in a comment so we can manage the trade together.
_____________________________________________________________________________________________________________________
Thank you for your support ;)
GWBFX

NZDCAD – Still waiting for the completion BIG ascending structurUpdate from my previous forecast that I post on Feb 7th on this pair. The price move slowly the past 2 weeks and still havent come meet my entry criteria. I have evolve my trendline a bit to adjust with recent price action.
I still think this pair will make one last push to the upside and waiting for now until the price to finish its 3rd touch to complete its ascending structure, or at least until the double top area at 0.92800 area. Once the price has reach the area, I will wait for a clearly visible impulsive rejection from that area. Any break of bearish continuation pattern in lower TF will confirm the bearish move that I certainly will make sure to take advantage of.
For now, let’s see how will this pair develop, good luck..
__________________________________________________________________________________________________________________________________________________________
Here is the MOA FX technical analysis, please comment below if you have any question.
The ENTRY in the market will be taken only if the condition of the MOA Fx strategy will trigger.
__________________________________________________________________________________________________________________________________________________________________

NZDCAD Sell Analysis Hey traders, here is the analysis for the NZDCAD. NOTE - Please do your own analysis before taking the trade. Let me know if you guys have any questions in the comment section. If you guys like my analysis please hit like. Thanks.

NZD/CAD Looking very bearishHi Traders
NZD/CAD Signal (Daily Timeframe)
A high probability, entry to go SHORT is forming @ 0.90366 after the market found resistance @ 0.92347. Only the upward break of 0.92347 would cancel this bearish scenario.
Trade details:
Entry: 0.90366
Stop loss: 0.92347
Take profit1: 0.89197
Take profit 2: 0.87216
Take profit 3: 0.83987
Score: 7
Strategy: Bearish Trend Reversal


NZDCAD | Perspective for the new week | Follow-upThis is a follow up on my previous publication (see link below for reference purposes) on this pair as the price action continues to flow according to expectations! Unlike my previous publication, Excited to let you know that I have captured a distinct and tradable pattern on this pair.
The appearance of a Double Top pattern - a strong Reversal structure appears to fine-tune a Bearish setup as Buyers gradually lose momentum and price continues to show tendencies of risking a further decline in the nearest future.
Tendency: Downtrend ( Bearish )
Structure: Reversal pattern | Supply & Demand | Double Top | Channel
Observation: i. Since late January 2021, the price has been caught within a Channel and since the Breakdown of CA$0.91850 followed by a significant rejection of this level... my Bearish bias becomes a little stronger.
ii. This been said, I am anticipating a significant Breakdown/Retest of CA$0.91400 in the coming week(s) to join the decline as CA$0.91900/0.91500 remains a level to watch out for in this regard.
Trading plan: SELL confirmation with a minimum potential profit of 150 pips.
Risk/Reward : 1:5
Potential Duration: 2 to 7 days
NB: This speculation can be considered to make decisions on lower timeframes.
Watch this space for updates as price action is been monitored.
Risk Disclaimer:
Margin trading in the foreign exchange market (including foreign exchange trading, CFDs, etc.) has a high risk and is not suitable for all investors. The content of this speculation (including all data) is organized and published by me for the sole purpose of education and assistance in making independent investment decisions. All information herein is for your reference only and I take no responsibility.
You are hereby advised to carefully consider your investment experience, financial situation, investment objective, risk tolerance level, and consult your independent financial adviser as to the suitability of your situation prior to making any investment.
I do not guarantee its accuracy and is not liable for any loss or damage which may result directly or indirectly from such content or the receipt of any instruction or notification therewith.
Past performance is not necessarily indicative of future results.

What I'd love to see on NZDCAD!After breaking out, price has found its way above my trendline support. with a retest of my trendline on lower timeframe, i should long NZDCAD. Probablities. lets see

NZDCAD forecastingNZDCAD short opportunity for this week . But it could go downside early before touch our entry zone

NZD/CAD New Analysis And 2 Trades Available This is an educational + analytic content that will teach why and how to enter a trade
Make sure you watch the price action closely in each analysis as this is a very important part of our method
Disclaimer : this analysis can change at anytime without notice and it is only for the purpose of assisting traders to make independent investments decisions

NZDCAD long trade ideaPlan: resistance level breakout --> wait for the price to bounce off from support level --> wait for the rejection candle pattern to form e.g. bullish engulfing, pinbar, etc --> BUY
**Disclaimer** the content on this analysis is subject to change at any time without notice, and is provided for the sole purpose of assisting traders to make independent investment decisions.
Traders!! if you like my ideas and do take the same trade as I do, please write it in a comment so we can manage the trade together.
_____________________________________________________________________________________________________________________
Thank you for your support ;)
GWBFX

NZDCAD – Waiting for the completion BIG ascending structureI have been waiting for NZDCAD to make big bearish move to the downside for quite sometime no. But it seems, starting from last November the price lack any real commitment. It just continuing its corrective phase resulting in sideway and choppy movement across all timeframes. However, now I’m starting to see cleary the evolution of the market structure in this pair.
This pair is forming a 3 touch ascending structure in an even bigger ascending structure. Ussually, a pattern within a pattern like this is a big positive confluence for our edge,.. So,..i’m still confident that this pair has a very high probability for a longer term bearish move soon..
What I’m waitin for now is for the price to finish its 3rd touch to complete its ascending structure. So, I think this pair will make one last push to the upside to 0.92700-0.92300 area. Once the price has reach the area, I will wait for a clearly visible impulsive rejection from that area. Any break of bearish continuation pattern in lower TF will confirm the bearish move that I certainly will make sure to take advantage of.
For now, let’s see how will this pair develop, good luck..
__________________________________________________________________________________________________________________________________________________________
Here is the MOA FX technical analysis, please comment below if you have any question.
The ENTRY in the market will be taken only if the condition of the MOA Fx strategy will trigger.
__________________________________________________________________________________________________________________________________________________________________

NZDCAD Possible Head and Shoulders Update Hello Fellow Traders, Here is a Full Analysis on NZDCAD.
The Best way to follow my Analysis is if the following conditions apply.
Conditions -
1. Wait for the Market to Show you some Rejection / Confirmation / Direction
2.Wait for confirmation(Price Action Confirmation Aka . Pinbar , Bullish engulfing / Break of structure Aka Support Or Resistance)
3.Do your Own analysis! (Draw Trend Lines / Support & Resistance Zones / SND )
4.Always Use Risk Management (Risk 1% of your capital)
5.Entry Should be Made on The 4H Timeframe (Only if you have Confirmation)
6.Trade at own risk.
7.Show some support Below ( Like , Comment , Follow & share )
Let Me know if you have any Questions or Comments Below
Happy Trading & Goodluck!
See You in the next Analysis!
Global Fx Education

NZDCAD Short (Sell) Counter Trend Reversal Trade SetupNZDCAD has failed to break above this zone of interest and on the pullback, is showing strong rejections and the setup has high R:R.


Bearish Bat PatternNZDCAD BEARISH BAT PATTERN
Market Sell Order Set Up.
Sell Entry: (0.91867)
Min Take-Profit: (0.91307)
Max Take-Profit: (0.90955)
Stop-Loss: (0.92449)
Max Risk-Reward: (1.57)
Smash a Like button and leave a Comment, I appreciate every support. Goodluck.
