NZDCADIDEA

NZD/CAD, Breakout of the Key Level would offer long opportunityNZD/CAD struggles to break the key level. If the price will break it, we would take long entry with our members with awesome risk to reward and probabilities for a nice push to the upside.

NZD/CAD, Wait for confirmation before entering BuyThis pair has a good chance to break this horizontal key level while staying in this ascending triangle. If it happens, our students will be taking a long position with a nice risk to reward and probabilities for a nice push to the upside.

NZDCAD short trade ideaPlan: wait for the price to bounce off from trendline or resistance level --> wait for the rejection candle pattern to form e.g. bearish engulfing, pinbar, etc --> SELL
**Disclaimer** the content on this analysis is subject to change at any time without notice, and is provided for the sole purpose of assisting traders to make independent investment decisions.
Traders!! if you like my ideas and do take the same trade like i do, please write it in comment so we can manage the trade together.
_____________________________________________________________________________________________________________________
Thank you for your support ;)
GWBFX

Short NZDCAD Move For Short-term/Intraday Trading SetupA short term downward move can be expected in NZDCAD, especially after the big rally because of falling crude oil prices (CAD is heavily reliant on crude oil prices). I feel that some government intervention will happen to cool off such dropping prices, leading to crude oil prices increasing a bit in the short term, thus giving some strength to CAD, which will cause NZDCAD to fall (expected target is 0.85100).

NZDCAD long trade ideawait for the price to test the key support level --> BUY ,. please do your own research before placing any buy order. good luck!
**Disclaimer** the content on this analysis is subject to change at any time without notice, and is provided for the sole purpose of assisting traders to make independent investment decisions.
Traders!! if you like my ideas and do take the same trade like i do, please write it in comment so we can manage the trade together.
_____________________________________________________________________________________________________________________
Thank you for your support ;)
GWBFX

NZDCAD long trade ideaPlan : wait for the price to bounce off from support level --> wait for the rejection candle pattern to form e.g. bullish engulfing, pinbar etc --> BUY
**Disclaimer** the content on this analysis is subject to change at any time without notice, and is provided for the sole purpose of assisting traders to make independent investment decisions.
Traders!! if you like my ideas and do take the same trade like i do, please write it in comment so we can manage the trade together.
_____________________________________________________________________________________________________________________
Thank you for your support ;)
GWBFX

NZDCAD analysisfollowing price - looking for continuation towards recent levels - confirmation pending
patience is key
anticipate - react - execute
cheers

NZDCAD LONG! 4HRPurpose of idea is to complement your research.
Check comments section for future updates on idea.
Like this idea?
Like, Share, Follow, and Support channel for future content.
Thank you and happy trading.

nzdcad ideawhen price leaves the current box pattern i highlighted we sell or buy but nzdacd is on a support level right now and i see a buy follow me up to know when to buy

Trading Pathways Analysis of NZDCAD H4 Chart
The outlined white arrow pathway is the predicted pathway that the NZDCAD will follow in the coming days or weeks. Using my unique charting methods, I have been able to arrive at HIGH PROBABILITY turning points where NZDCAD will turn.
PLEASE NOTE THE ABOVE ANALYSIS IS FOR EDUCATIONAL PURPOSES ONLY. THEY ARE NOT DIRECT INSTRUCTIONS TO TRADE AND ANY LOSS INCURRED BY FOLLOWING THIS ANALYSIS IS AT YOUR OWN RISK.
Eiseprod of Trading Pathways


NZDCAD SHORT IDEA Can we get a Lower High to confirm the market has shifted from a bullish trend to now a bearish trend?
I’ll monitor price action this pair for a short opportunity.
If you do your own Confluence you’ll find a few to support this idea.
Will post an update as it plays out.

NZD/CAD SHORTNZD/CAD SELL LIMIT
ENTRY 1 .86660
ENTRY 2 .86750
Sl .86877
Tp.1 .86410
Tp.2 .86200
Tp.3 .86920


NZDCAD - NEXT LEGANALYSIS ON NZDCAD
Welcome to my analysis
-
30MIN CHart
-
Interesting Point of interest In the NZDCAD pair.
- Price above 200 day EMA.
- look for sell signals.
- Expecting some more downward movement.
- Watch 0.85000/0.84320 for take profit.
- MACD showing bearish divergence
Stay Tuned

ANALYSIS ON NZDCADANALYSIS ON NZDCAD
Welcome to my analysis
-
2HR CHart
-
Interesting Point of interest In the NZDCAD pair.
- Price above 100/200 day EMA.
- sell at top 0.85000 zone.
- Expecting more downward momentum. Price could move to around 0.85400 before the fall
- Watch 0.84400 for take profit.
- MACD showing bearish divergence
Stay Tuned

NZDCAD - BULLS TO CONTINUE PUSH UPANALYSIS ON NZDCAD
Welcome to my analysis
-
30Min CHart
-
Interesting Point of interest In the NZDCAD pair.
- Price flirting with the 200 day EMA.
- Buy reversal.
- Expecting more Upward momentum.
- Watch 0.84500 for take profit or around 0.84800.
- MACD showing bullish divergence
Stay Tuned


My Idea on NZDCAD for a couple of days Im seeing a bearish trend on NZDCAD but we got a bullish momentum so until I see confirmation of a reversal Ill be entering sales ( Feel free to leave a comment )

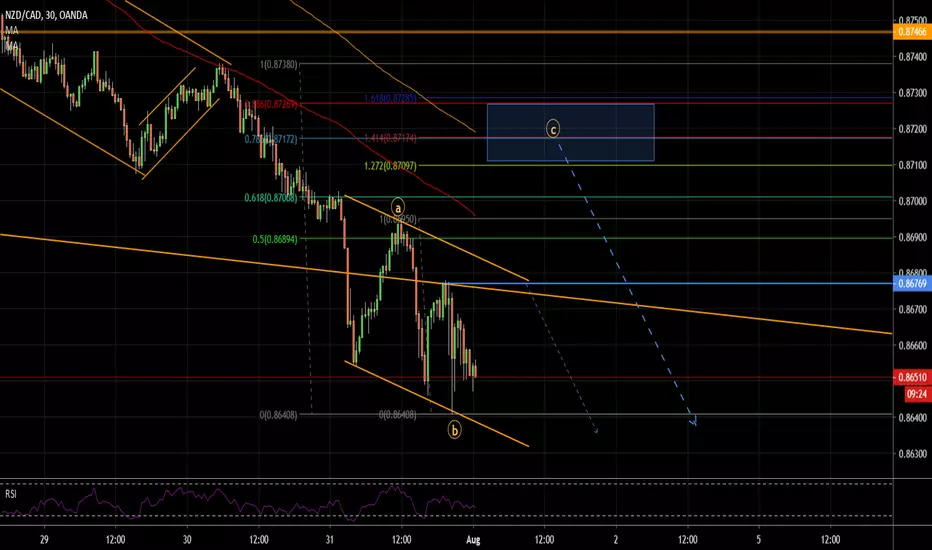
nzdcadok folks since we get precise that nice move down as on previous chart, now im expecting so see some more deeper correction before rushing down again. its early to say whats gonna be but here on this chart im showing my expectations for running flat and expanding. for those who understand patterns there is a gartley taken from the top and butterfly taken from A of the correction. show some love for more updates!