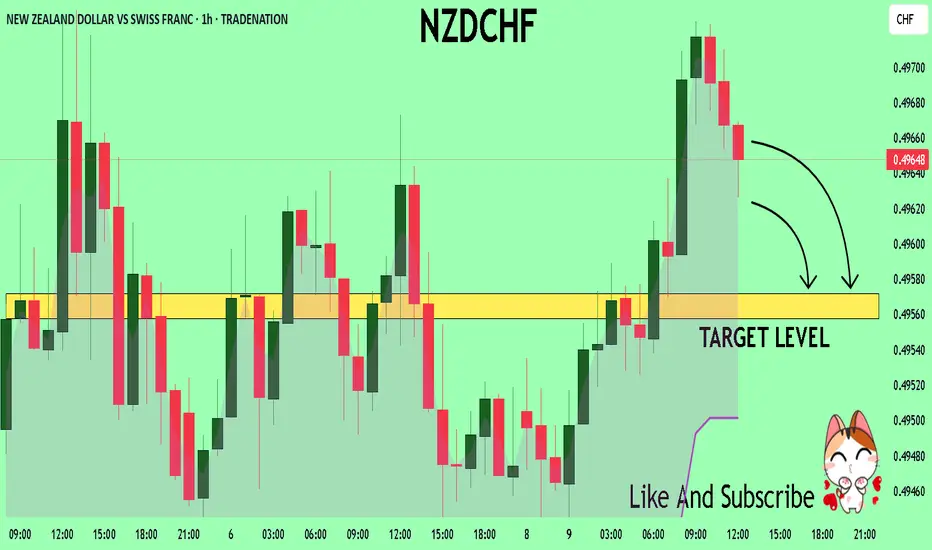
NZDCHF Technical Analysis! SELL!
My dear friends,
Please, find my technical outlook for NZDCHF below:
The instrument tests an important psychological level 0.4965
Bias - Bearish
Technical Indicators: Supper Trend gives a precise Bearish signal, while Pivot Point HL predicts price changes and potential reversals in the market.
Target - 0.4957
About Used Indicators:
Super-trend indicator is more useful in trending markets where there are clear uptrends and downtrends in price.
Disclosure: I am part of Trade Nation's Influencer program and receive a monthly fee for using their TradingView charts in my analysis.
———————————
WISH YOU ALL LUCK
NZDCHF
NZD/CHF SELLERS WILL DOMINATE THE MARKET|SHORT
Hello, Friends!
We are now examining the NZD/CHF pair and we can see that the pair is going up locally while also being in a uptrend on the 1W TF. But there is also a powerful signal from the BB upper band being nearby, indicating that the pair is overbought so we can go short from the resistance line above and a target at 0.493 level.
Disclosure: I am part of Trade Nation's Influencer program and receive a monthly fee for using their TradingView charts in my analysis.
✅LIKE AND COMMENT MY IDEAS✅

NZDCHF Technical Analysis! SELL!
My dear followers,
This is my opinion on the NZDCHF next move:
The asset is approaching an important pivot point 0.4957
Bias - Bearish
Technical Indicators: Supper Trend generates a clear short signal while Pivot Point HL is currently determining the overall Bearish trend of the market.
Goal - 0.4947
About Used Indicators:
For more efficient signals, super-trend is used in combination with other indicators like Pivot Points.
Disclosure: I am part of Trade Nation's Influencer program and receive a monthly fee for using their TradingView charts in my analysis.
———————————
WISH YOU ALL LUCK

NZDCHF Will Go Lower! Short!
Here is our detailed technical review for NZDCHF.
Time Frame: 10h
Current Trend: Bearish
Sentiment: Overbought (based on 7-period RSI)
Forecast: Bearish
The market is trading around a solid horizontal structure 0.492.
The above observations make me that the market will inevitably achieve 0.488 level.
P.S
Please, note that an oversold/overbought condition can last for a long time, and therefore being oversold/overbought doesn't mean a price rally will come soon, or at all.
Disclosure: I am part of Trade Nation's Influencer program and receive a monthly fee for using their TradingView charts in my analysis.
Like and subscribe and comment my ideas if you enjoy them!

NZD-CHF Local Long! Buy!
Hello,Traders!
NZD-CHF is going down
Now and the pair will soon
Hit a horizontal support
Of 0.4881 and after the
Retest we will be expecting
A local bullish rebound
Buy!
Comment and subscribe to help us grow!
Check out other forecasts below too!
Disclosure: I am part of Trade Nation's Influencer program and receive a monthly fee for using their TradingView charts in my analysis.

NZD/CHF LONG FROM SUPPORT
Hello, Friends!
The BB lower band is nearby so NZD-CHF is in the oversold territory. Thus, despite the downtrend on the 1W timeframe I think that we will see a bullish reaction from the support line below and a move up towards the target at around 0.495.
Disclosure: I am part of Trade Nation's Influencer program and receive a monthly fee for using their TradingView charts in my analysis.
✅LIKE AND COMMENT MY IDEAS✅

Tariffs. Turbulence. OpportunityMarkets Rattle as Global Currencies Slide: Central Banks Prepare to Act
Global financial markets plunged on Monday as U.S. tariffs under the Trump administration, alongside retaliatory measures from key trading partners, officially took effect. The result: a wave of uncertainty and volatility that sent the Australian, Canadian, and New Zealand dollars spiraling to steeply discounted levels.
As this new economic reality unfolds, institutional investors and households alike are scrambling to adjust. In response, central banks across the globe face mounting pressure to stabilize their economies. The most immediate solution? Accelerated interest rate cuts.
Beyond the headline noise of trade wars, the deeper concern lies in domestic economic resilience. Economists and central bankers are increasingly turning inward, looking to bolster aggregate demand through aggressive monetary easing. The U.S. Federal Reserve, nudged persistently by President Trump, has already signaled its willingness to comply. Other central banks are expected to follow suit as nations seek to shield local industries from the impact of trade disruption.
The era of lower global interest rates appears to be more than a passing phase—it is becoming the new norm. In volatile times, disciplined strategies and a long-term lens are more essential than ever. We remain focused on seizing value where others see only risk.

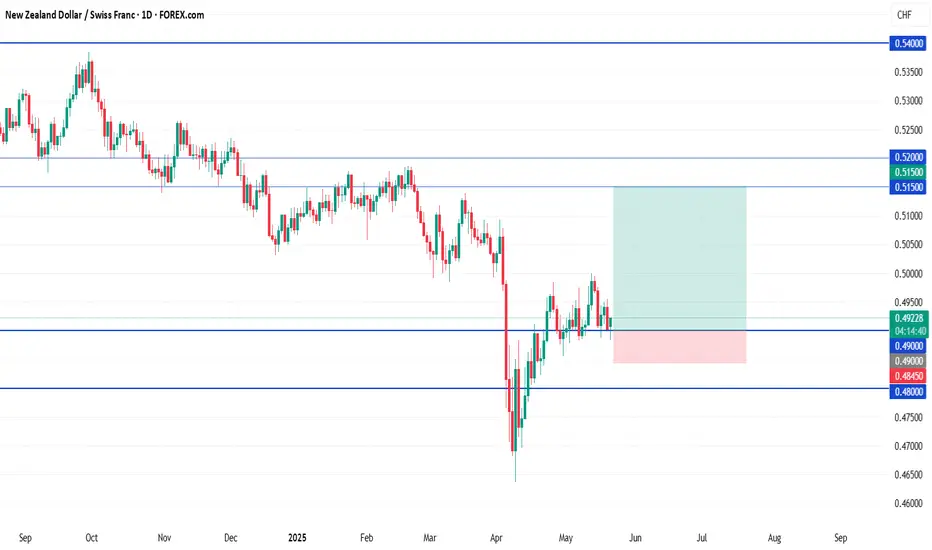
NZDCHF: Weak Market & Bearish Forecast
It is essential that we apply multitimeframe technical analysis and there is no better example of why that is the case than the current NZDCHF chart which, if analyzed properly, clearly points in the downward direction.
Disclosure: I am part of Trade Nation's Influencer program and receive a monthly fee for using their TradingView charts in my analysis.
❤️ Please, support our work with like & comment! ❤️

NZDCHF BULLISH OR BEARISH DETAILED ANALYSIS ??NZDCHF is currently consolidating in a textbook bullish flag pattern after a sharp recovery from the recent lows near 0.4680. Price action is compressing just below a key supply zone around 0.4950–0.4980, signaling a potential breakout setup as momentum builds. This flag is forming after a clear impulse move, and with the structure respecting higher lows, I’m preparing for a bullish continuation toward the 0.5100–0.5150 target zone.
Fundamentally, the New Zealand dollar is gaining strength supported by the RBNZ's firm hold on tight monetary policy, as inflation remains sticky in services and housing. Governor Orr’s latest comments reaffirmed that the central bank is not ready to pivot until they see a clear disinflationary trend. On the other hand, the Swiss franc is showing signs of weakness, as the SNB remains one of the most dovish central banks in the G10 space, with real interest rates still negative and inflation pressures easing significantly.
Technically, we’re in a bullish structure with key demand holding strong at the 0.4840–0.4860 range. Price is now coiling just under resistance, and a clean breakout above the 0.4950 level could ignite the next impulsive leg toward 0.5100. If the breakout confirms with increased volume and market sentiment aligns, this setup presents a high probability long opportunity with a favorable R\:R.
NZDCHF remains on my radar as a breakout trade backed by both technical structure and macro fundamentals. With capital flows favoring the Kiwi and risk appetite rotating back into higher-yielding currencies, this pair offers a solid bullish continuation setup for the coming weeks. Stay patient, let the breakout confirm, and ride the momentum higher.

NZD/CHF BEARS WILL DOMINATE THE MARKET|SHORT
NZD/CHF SIGNAL
Trade Direction: short
Entry Level: 0.492
Target Level: 0.486
Stop Loss: 0.495
RISK PROFILE
Risk level: medium
Suggested risk: 1%
Timeframe: 8h
Disclosure: I am part of Trade Nation's Influencer program and receive a monthly fee for using their TradingView charts in my analysis.
✅LIKE AND COMMENT MY IDEAS✅

NZD/CHF Technical Outlook – Bullish Reversal in Play! 📅 Chart Date: May 26, 2025
💱 Pair: NZD/CHF
📈 Current Price: 0.49246
📏 Indicators Used:
🔵 200 EMA: 0.50959
🔴 50 EMA: 0.49424
📍 Key Technical Levels:
🟣 Reversal Point (Support Zone): 0.4880 – 0.4930
This zone has shown consistent buying interest. The price recently bounced off this level, indicating strong bullish sentiment forming here.
🟪 Resistance Zone: 0.5080 – 0.5160
This area has previously capped upside movement. It's aligned near the 200 EMA – a significant dynamic resistance.
📈 Bullish Setup Active! 🐂
The price action shows a strong bullish reaction off the reversal zone.
There's a potential higher low forming, indicating a trend reversal.
The price is currently reclaiming the 50 EMA – a bullish sign when followed by strong candles.
If momentum continues, we could see a target retest of the resistance zone around 0.51+ 🔝
⚠️ Watch Out:
A rejection from the 50 EMA may lead to another dip toward the support zone.
Bearish confirmation only below 0.4880 with strong volume 🔻
📌 Conclusion:
This chart suggests a bullish momentum building up in NZD/CHF. As long as price holds above the reversal zone, we can expect a push toward the resistance area. A break above 0.5160 would confirm a medium-term trend reversal. 📈🔥
💡 Traders Tip: Consider entries above 0.4945 with SL below 0.4880 and TP around 0.5080–0.5160. 🎯

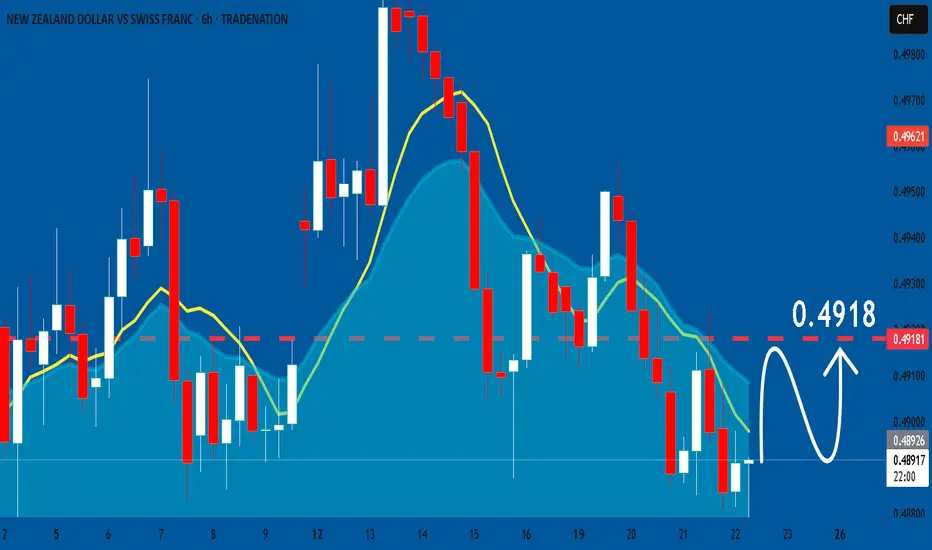
NZDCHF: Market Sentiment & Forecast
The charts are full of distraction, disturbance and are a graveyard of fear and greed which shall not cloud our judgement on the current state of affairs in the NZDCHF pair price action which suggests a high likelihood of a coming move up.
Disclosure: I am part of Trade Nation's Influencer program and receive a monthly fee for using their TradingView charts in my analysis.
❤️ Please, support our work with like & comment! ❤️
NZD-CHF Free Signal! Sell!
Hello,Traders!
NZD-CHF hit a horizontal
Resistance of 0.5002 and
Its a strong supply area so
We will be expecting a local
Pullback, which means we
Can enter a short trade
With the Take Profit of 0.4950
And the Stop Loss of 0.5016
Sell!
Comment and subscribe to help us grow!
Check out other forecasts below too!
Disclosure: I am part of Trade Nation's Influencer program and receive a monthly fee for using their TradingView charts in my analysis.

NZD/CHF BEST PLACE TO SELL FROM|SHORT
Hello, Friends!
NZD/CHF pair is in the uptrend because previous week’s candle is green, while the price is clearly rising on the 1D timeframe. And after the retest of the resistance line above I believe we will see a move down towards the target below at 0.483 because the pair overbought due to its proximity to the upper BB band and a bearish correction is likely.
Disclosure: I am part of Trade Nation's Influencer program and receive a monthly fee for using their TradingView charts in my analysis.
✅LIKE AND COMMENT MY IDEAS✅

SHORT ON NZD/CHFNZD/CHF is currently falling from a major resistance level.
I will be selling this pair to the next level of demand/support for 150-200 pips.

NZDCHF short: trend continuationMain trend – bearish.
Pull back to nearest s/r level at 0.49850 has been completed.
A lower high has now been formed.
Price is below the 200dma.
We are in all time low territory, so I will be targeting the 0.4700 round number and then evaluate again.
This is not a trade recommendation; it’s merely my own analysis. Trading carries a high level of risk, so only trade with money you can afford to lose and carefully manage your capital and risk. If you like my idea, please give a “boost” and follow me to get even more. Please comment and share your thoughts too!!
It’s not whether you are right or wrong, but how much money you make when you are right and how much you lose when you are wrong – George Soros

NZDCHF Bullish Outlook – Wedge Breakout Setup in PlayAscending Structure: Price action has been respecting a series of higher lows, supported by an ascending trendline – a key indicator of bullish pressure.
Bullish Flag/Wedge Formation: The current price is consolidating inside a rising wedge, typically seen as a continuation pattern in bullish trends, especially when preceded by a strong rally.
Breakout Zone: A breakout above the wedge resistance (~0.4915–0.4930) opens the path to retest the recent high at 0.4953, and further to 0.4985 resistance.
Volume & Momentum: If confirmed by bullish momentum or strong candle close above the wedge, it validates further upside.
Key Levels:
Support: 0.4870 (trendline base), 0.4800 (invalidates setup)
Immediate Resistance: 0.4930
Targets:
TP1: 0.4953
TP2: 0.4985 (measured move from wedge)
✅ Confluence for Bullish Setup:
Price respecting higher low structure.
Bullish consolidation wedge near previous highs.
Clean upside path if price breaks above 0.4930.
⚠️ Invalidation:
If price breaks below 0.4870, this would invalidate the bullish structure and could suggest a retest of 0.4800, making the current setup a potential bull trap.

NZD/CHF BEARS WILL DOMINATE THE MARKET|SHORT
Hello, Friends!
NZD/CHF pair is trading in a local uptrend which we know by looking at the previous 1W candle which is green. On the 2H timeframe the pair is going up too. The pair is overbought because the price is close to the upper band of the BB indicator. So we are looking to sell the pair with the upper BB line acting as resistance. The next target is 0.488 area.
Disclosure: I am part of Trade Nation's Influencer program and receive a monthly fee for using their TradingView charts in my analysis.
✅LIKE AND COMMENT MY IDEAS✅

NZDCHF Will Fall! Sell!
Please, check our technical outlook for NZDCHF.
Time Frame: 4h
Current Trend: Bearish
Sentiment: Overbought (based on 7-period RSI)
Forecast: Bearish
The market is approaching a key horizontal level 0.493.
Considering the today's price action, probabilities will be high to see a movement to 0.487.
P.S
Please, note that an oversold/overbought condition can last for a long time, and therefore being oversold/overbought doesn't mean a price rally will come soon, or at all.
Disclosure: I am part of Trade Nation's Influencer program and receive a monthly fee for using their TradingView charts in my analysis.
Like and subscribe and comment my ideas if you enjoy them!

NZD/CHF SELL IDEA (R:R=3.6)Selling NZD/CHF now. A wonderful BUTTERFLY just formed on the 1 hour chart. Currently making lower highs and lower lows on larger timeframes.
Stop Loss is: 0.49350
Please move SL to break even when trade is 75+ pips in profit.
Target: 0.47500
Happy Trading! :)

NZDCHF...SHORTFX:NZDCHF
The zone has historically acted as a wall for price. Let's see if it does the same again. In current conditions, caution is key.
If it fails this time and we get a proper pullback, it could be the start of a trend shift.

NZDCHF m15 BuyHello everyone.
There's a perfect buy opportunity on NZDCHF right now.
You can even set your RRR to 1:4, but those who prefer a shorter target can close at RRR 1:2.
I expect the pair to reach the 0.49225 level during the day.
Wishing everyone profitable trades!
🔔 I post detailed trade ideas and daily market analysis like this every day on my TradingView profile.
👉 Follow me to get notified and read the full breakdowns.
