NZDCHF, long on 0.6387Hi Traders,
This is our view on this cross for the next few days.
#NZDCHF
BUY 0.6387
SL 0.6373
TP 0.6417
We remind you that this is only a forecast based on what current data are.
Therefore the following signal will be activated only if the rules of our strategy are strictly respected.
Eventually, any updates will be given in the comment section below
———————————
Trading Kitchen
Nzdchfanalysis

NZDCHF SELLAs i can see this pair it break trend line and structure show us more bearish move till our design TP
as i had send prediction in last analysis on this exactly retrace to the given levels now hit tp its is going more drop till
design levels we are trading this pair with a small risk and looking for higher rewards
SO friends join the train and earn the profits dont forget push like and follow us for more updates


NZDCHF - Spring PointsThis pair has the potential to bounce aggressively from the points marked to the upside, keep this one on your watchlist.

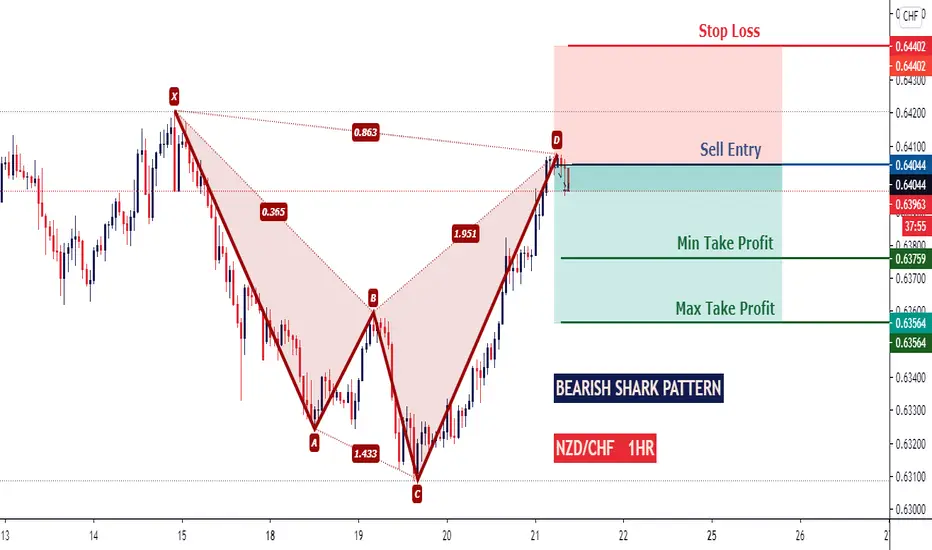
Bearish Shark PatternNZDCHF BEARISH SHARK PATTERN
Market Sell Order Set Up.
Sell Entry: (0.64044)
Min Take-Profit: (0.63759)
Max Take-Profit: (0.63564)
Stop-Loss: (0.64402)
Max Risk-Reward: (1.34)
Smash a Like button and leave a Comment, I appreciate every support. Goodluck.
Short Opportunity For NZDCHF!!! Retesting 161.8% Fib Level...As you can see, we managed to see a nice 261.8% fib rejection with price heading all the way down. For now, we are seeing a short term BULLISH movement which I believe wil be a retest to 161.8% fib level before further BEARISH continuation. I have identified the supply zone as seen from my chart. I am expecting great BEARISH pressure at this zone. I will be expecting price to move till 0.6200 ish price level.
Kindly hit the LIKE Button if you agree with my analysis and feel free to COMMENT your idea below. As for those who are keen to get daily updates and analysis from me feel free to FOLLOW me. Cheers and Happy Trading!!


NZDCHF HARMONIC PATTERN FORMING!!harmonic pattern loading..
if you agree with my setup, feel free to take on the trade with minimal risk.
I have indicated entry and exit points.
Good luck!!

NZDCHF | Perspective for the new weekWith 150pips in our direction since my last publication (see link below for reference purpose); It appears price is at a juncture in the market with a trading opportunity we can take advantage of.
Tendency: Uptrend ( Bullish )
Structure: Breakout | Supply & Demand
Observation: i. Price has been hovering above my Key level @ Fr0.63250 since it's Breakout in December 2020.
ii. As price continues to find Higher Lows, the tendency for a rally increases.
ii. Looking forward to a retest of Key level in the coming week to hop in the uptrend continuation.
iii. Should price enter Demand zone the fifth time, an engulfing Bullish candle from this level should be a signal to watch out for.
Trading plan: BUY confirmation with a minimum potential profit of 170 pips.
Risk/Reward : 1:4
Potential Duration: 7 to 15 days
NB: This speculation can be considered to make decisions on lower timeframes.
Watch this space for updates as price action is been monitored.
Risk Disclaimer:
Margin trading in the foreign exchange market (including foreign exchange trading, CFDs, etc.) has a high risk and is not suitable for all investors. The content of this speculation (including all data) is organized and published by me for the sole purpose of education and assistance in making independent investment decisions. All information herein is for your reference only and I take no responsibility.
You are hereby advised to carefully consider your investment experience, financial situation, investment objective, risk tolerance level, and consult your independent financial adviser as to the suitability of your situation prior to making any investment.
I do not guarantee its accuracy and is not liable for any loss or damage which may result directly or indirectly from such content or the receipt of any instruction or notification therewith.
Past performance is not necessarily indicative of future results.

NZDCAD added to the watchlist Hey traders, here is the analysis for the NZDCAD. NOTE - Please do your own analysis before taking the trade. Let me know if you guys have any questions in the comment section. If you guys like my analysis please hit like. Thanks.

Wave Correction Bearish Crab PatternNZDCHF WAVE CORRECTION AND BEARISH CRAB PATTERN
This setup was on friday, trade is running already.
Market Sell Order Set Up.
Sell Entry: (0.64300)
Take-Profit: (0.63501)
Stop-Loss: (0.64601)
Max Risk-Reward: (2.65)
Smash a Like button and leave a Comment, I appreciate every support. Goodluck.

Game Plan #forexI am currently long the nzd/chf but I am watching to see how it reacts to the previous range high (rectangle) 0.6389. If we can hold above the regression line as well as the low of the breakout day- 0.6363 then the trend to the upside is still intact. But if we get more selling and close below the 0.6363 level then I will reverse my long position to a short looking for a deeper correction back toward the weekly pivot at 0.6300.

NZDCHF Strong Resistance Area!!!Previously, we managed to see a 261.8% fib level price rejection which was also where a resistance level lies (0.6373). After which, we saw a BEARISH movement to the support level @0.6320. As of now, I will be expecting consolidation on this support and resistance level as there is no signs of breakout. Therefore, a short opportunity will be valid here.
Kindly hit the LIKE Button if you agree with my analysis and feel free to COMMENT your idea below. As for those who are keen to get daily updates and analysis from me feel free to FOLLOW me. Cheers and Happy Trading!!


NZD/CHF Short Nzd / Chf is in a very ungrateful position, it is on a very strong trendline, but on the other hand it needs to do the long-awaited retest at 0.62 area. Our setup would be as shown in the chart.


Nzdchf Good luck to you!
Don't forget to like and share, it really helps.
Follow for more.
This is just an idea, not financial advice.

NZDCHF 261.8% Movement Completed...More Retracement Coming!!!NZDCHF managed to hit the 261.8% fib level that we have identified. After that, we saw a substantial retracement but did not managed to hit any of our levels. As price is currently heading towards the supply zone (red area) at approximately 0.6310 price level, I will be expecting a larger retracement to take place. Having said that, I will looking out for a potential retracement movement to the demand zone (green area). Definitely, there is a potential breakout of this area but as of now I will short till this demand zone. I will update again once we reaches this level.
Kindly hit the LIKE Button if you agree with my analysis and feel free to COMMENT your idea below. As for those who are keen to get daily updates and analysis from me feel free to FOLLOW me. Cheers and Happy Trading!!


NZDCHF Can Jump DownIn my view after testing breaking channel and MA200 this pair can move down as per our bias.
Good Luck

NZD/CHF Short NZD / CHF is on the major trendline, plus it has not done any valid retest on higher timeframes. So, according to us, this pair has two scenarios, the first is to start the short immediately, and the second is the 0.63200 area variety, and since then the short to certainly 0.61700 area. Where they would certainly be interested in long.
