Bearish Butterfly PatternNZDCHF BEARISH BUTTERFLY PATTERN
Market Sell Order Set Up.
Sell Entry: (0.64303)
Min Take-Profit: (0.63988)
Max Take-Profit: (0.63778)
Stop-Loss: (0.64689)
Max Risk-Reward: (1.36)
Smash a Like button and leave a Comment, I appreciate every support. Goodluck.
Nzdchfidea

NZDCHF Short (Sell) Trade Setup IdeaPrice has touched & reacted from a supply zone. We're looking at price action on lower timeframes for potential entries to short this pair back down to the bottom.

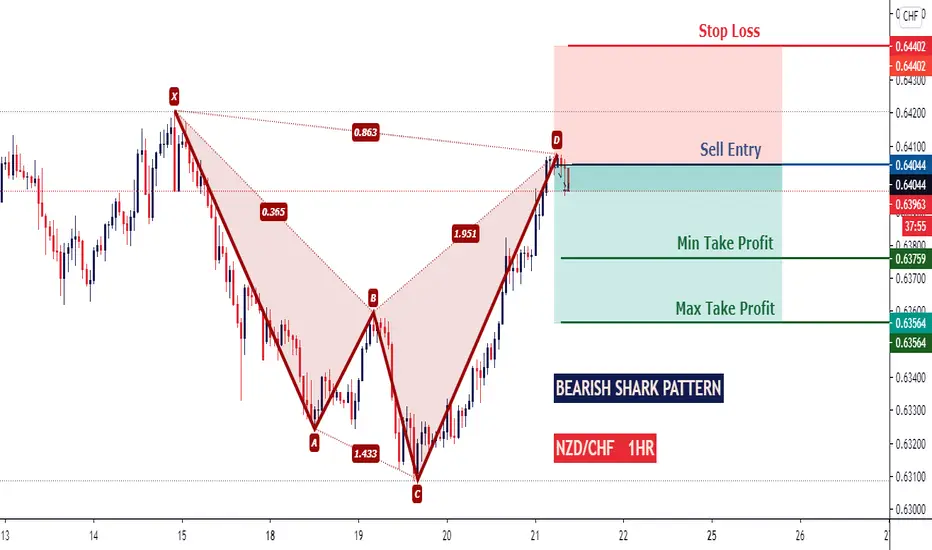
Bearish Shark PatternNZDCHF BEARISH SHARK PATTERN
Market Sell Order Set Up.
Sell Entry: (0.64044)
Min Take-Profit: (0.63759)
Max Take-Profit: (0.63564)
Stop-Loss: (0.64402)
Max Risk-Reward: (1.34)
Smash a Like button and leave a Comment, I appreciate every support. Goodluck.
NZDCHF HARMONIC PATTERN FORMING!!harmonic pattern loading..
if you agree with my setup, feel free to take on the trade with minimal risk.
I have indicated entry and exit points.
Good luck!!

Wave Correction Bearish Crab PatternNZDCHF WAVE CORRECTION AND BEARISH CRAB PATTERN
This setup was on friday, trade is running already.
Market Sell Order Set Up.
Sell Entry: (0.64300)
Take-Profit: (0.63501)
Stop-Loss: (0.64601)
Max Risk-Reward: (2.65)
Smash a Like button and leave a Comment, I appreciate every support. Goodluck.


NZDCHF Top-Down AnalysisHello Traders,
Here is the Top-Down Analysis of NZDCHF (Monthly, Weekly, Daily for direction and 4H for entry) for
Week 49 - Dec 02
M > Market is respecting downward resistance trend-line, price is approaching to test the trend-line. From there we can expect a rejection to the downside.
W > We can see two W patterns and their neck will be Short targets. Price is currently testing weekly supply zone.
D > Price has decelerated and rejection to downside is building up. Bearish divergence can be seen suggesting correction to the downside.
As per COT NZD further added both Long and Short bringing Long to the highest for the year, ZXY has gained strength all of November, it is now testing a major resistance level. We can expect some correction to the downside for NZD. CHF saw addition of both Long and Short. SXY recovered slightly during the said period and it further strengthened last week.
4H > Price has been consolidating at current level for over a week, price can move up for a last final attempt to break the consolidation before making a downward move.
Pair Correlation > NZDCHF has positive correlation with NZDCAD, NZDUSD, NZDJPY and GBPCHF negative correlation with EURNZD and GBPNZD.
This was my Idea and I hope you find it useful. If you find the analysis of help please leave a LIKE and FOLLOW for receiving all updates during the week. In the comment section share your view or ask questions.
Thank You
AP17FX

NZDCHF long trade ideaPlan: wait for the price to bounce off from trendline or support level --> wait for the rejection candle pattern to form e.g. bullish engulfing, pinbar, etc --> BUY
**Disclaimer** the content on this analysis is subject to change at any time without notice, and is provided for the sole purpose of assisting traders to make independent investment decisions.
Traders!! if you like my ideas and do take the same trade as I do, please write it in a comment so we can manage the trade together.
_____________________________________________________________________________________________________________________
Thank you for your support ;)
GWBFX

NZDCHF SELLThis is NZDCHF 4H timeframe analysis, i'm expecting the market to start selling from where it is at a moment.

NzdChf- to "see"0.65?Since the March low, NzdChf traded upwards and now is trading above 0.63 resistance
More important is that the pair seems to press on short term resistance and a break looks imminent.
In this case, the pair have a clear road to 0.65 zone
The medium-term trend is clearly bullish now and only a drop and close under 0.62 would alter this

NzdChf- 0.61+ tells a storyThe long-term trend for NzdChf is bearish and after recovering from this spring lows the pair is ready to resume its downwards trajectory.
Last week NzdChf tried to reconquer 0.61 but without success and we have 4 longtailed candles in this zone (2 being clear pin bars)
I favor short positions with a SL above 0.6160, as for target 0.5950 support could be a good place for TP

NZDCHF short trade ideaPlan: wait for the price to bounce off from supply zone --> wait for the rejection candle pattern to form e.g. bearish engulfing, pinbar, etc --> SELL
**Disclaimer** the content on this analysis is subject to change at any time without notice, and is provided for the sole purpose of assisting traders to make independent investment decisions.
Traders!! if you like my ideas and do take the same trade as I do, please write it in a comment so we can manage the trade together.
_____________________________________________________________________________________________________________________
Thank you for your support ;)
GWBFX

NZDCHF ANALYSISAn Elliot wave outlook on nzdchf shows we may be seeing a leading diagonal as our wave (I) and an expanded flat as our wave (ii).
we expect a sell from the current region to complete wave 3.
we target around 0.59000 region

NzdChf- sell with good R:RThe trend for NzdChf is down and the pair just reached the confluence resistance at around 0.61
I expect the pair to roll back down and a sell trade targeting 0.5950 zone could also have a good R:R

NzdChf outlookExactly like its twin, AudChf, NzdChf is trading in a downtrend.
0.61 should provide strong resistance for this pair and a dive to 0.59 can have a 1:3 R:R
Sell rallies close to 0.61 is my strategy

NZDCHF 4hrs Analysishello traders, here is my analysis for this pair. we are on a downtrend hence, it is save to trade with the trend. trade in regards your strategy.

NZDCHF (19.10.2020) SELL TRADE IDEA BY SABAH FOREX#NZDCHF
ENTRY 0.60396
SL. 0.61067
TP1 0.60061
TP2 0.59725
TP3 0.59390
TP4 0.59055
BELUM ADA AKAUN? Boleh buka akaun under broker liteforex kat sini www.sabahforex.com.my


NZDCHF Top-Down AnalysisHello Traders,
Here is the Top-Down Analysis of NZDCHF (Monthly, Weekly, Daily for direction and 4H for entry) for
Week 42 - 12 Oct
M > Market is moving in a downward channel with few breakouts. Price moved up to test previous support now turned monthly resistance and faced rejection.
W > We can notice that price is facing rejection from supply zones that turn into resistance. Price moved up to face rejection in 1st week of June and supply zone created in last week of June that turned into resistance for price in August and September. Price is now at supply zone.
D > Price created a double top at resistance level and dropped creating LH and LL. We saw a W formation and price dropped till neck to complete the formation and moved up to create next LH at previous demand zone. Price is now dropping down.
As per COT NZD had closure of few Long and major Short increasing net positions, confirming strength of ZXY for the said week. Short positions have reduced to least in current year. ZXY has been gaining strength slowly since June 2020. ZXY improved its position last week. CHF saw closure of both Long and Short positions with Short position reducing to least for current year, increasing net positions marginally. SXY was strong for the said week. SXY further gained strength last week.
4H > Price is respecting support provided by downward trend-line. While testing the neck of W formation price dropped further till the trend-line and moved up. We can see H & S created by the price while moving upwards, price further moved up to creating a LH. We expect price to drop till support trend-line and its behaviour there will provide further target.
Pair Correlation > NZDCHF has positive correlation with AUDCHF, CADJPY, NZDJPY, NZDCAD and NZDUSD and negative correlation with EURNZD.
This was my Idea and I hope you find it useful. If you find the analysis of help please leave a LIKE and FOLLOW for receiving all updates during the week. In the comment section share your view or ask questions.
Thank You
AP17FX
